


《DSP using MATLAB》Problem 2.10

代码:
%% ------------------------------------------------------------------------
%% Output Info about this m-file
fprintf('\n***********************************************************\n');
fprintf(' <DSP using MATLAB> Problem 2.10 \n\n');
banner();
%% ------------------------------------------------------------------------
nx = [0:1:199];
x = cos(0.2*pi*nx) + 0.5*cos(0.6*pi*nx);
alpha = 0.1; k = 50;
[xk, nxk] = sigshift(x, nx, k);
[y, ny] = sigadd(x, nx, alpha*xk, nxk);
[x1, nx1] = sigfold(x, nx);
[y1, ny1] = sigfold(y, ny);
[Rxy, nxy] = conv_m(x1, nx1, y, ny);
[Rxx, nxx] = conv_m(x1, nx1, x, nx);
figure('NumberTitle', 'off', 'Name', 'Problem 2.10 original sequence')
set(gcf,'Color',[1,1,1]) % 改变坐标外围背景颜色
subplot(2,1,1); stem(nx, x); title('x sequence');
xlabel('nx'); ylabel('x(n)') ;
grid on
subplot(2,1,2); stem(ny, y); title('y sequence');
xlabel('ny'); ylabel('y(n)');
grid on;
figure('NumberTitle', 'off', 'Name', 'Problem 2.10 correlation sequence')
set(gcf,'Color',[1,1,1]) % 改变坐标外围背景颜色
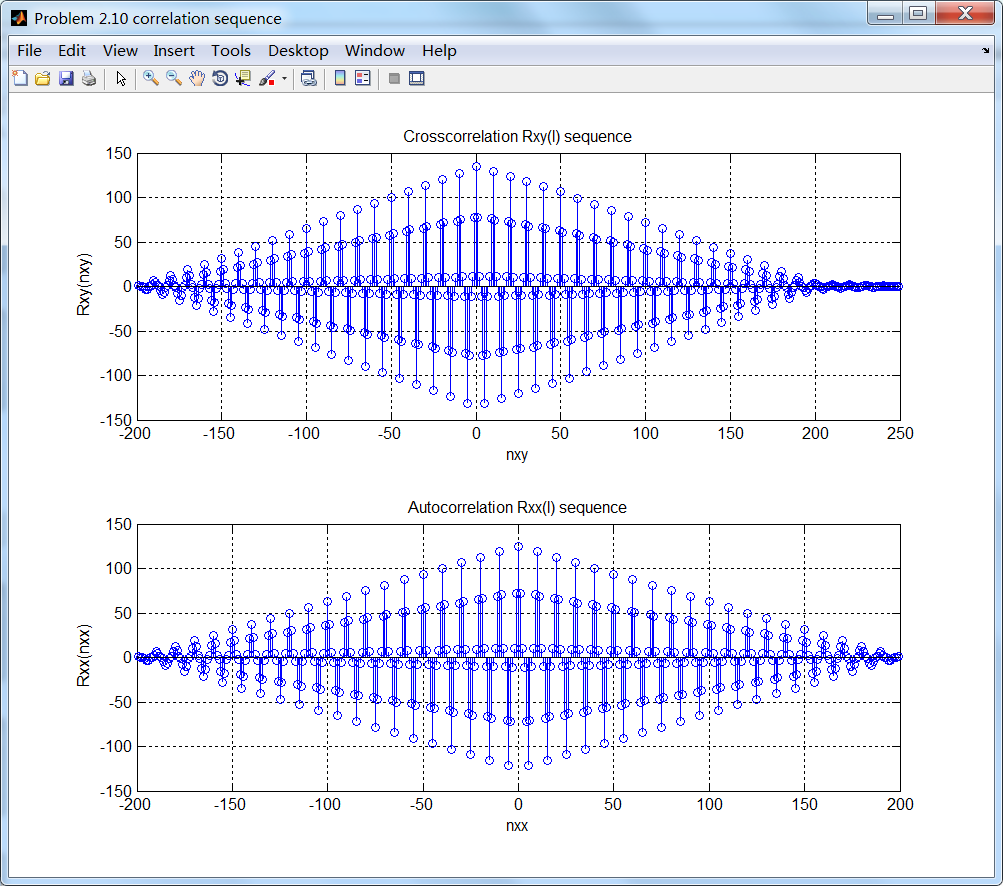
subplot(2,1,1); stem(nxy, Rxy); title('Crosscorrelation Rxy(l) sequence');
xlabel('nxy'); ylabel('Rxy(nxy)') ;
grid on
subplot(2,1,2); stem(nxx, Rxx); title('Autocorrelation Rxx(l) sequence');
xlabel('nxx'); ylabel('Rxx(nxx)');
grid on;
运行结果:

牢记:
1、如果你决定做某事,那就动手去做;不要受任何人、任何事的干扰。2、这个世界并不完美,但依然值得我们去为之奋斗。
