


《DSP using MATLAB》示例Example5.16
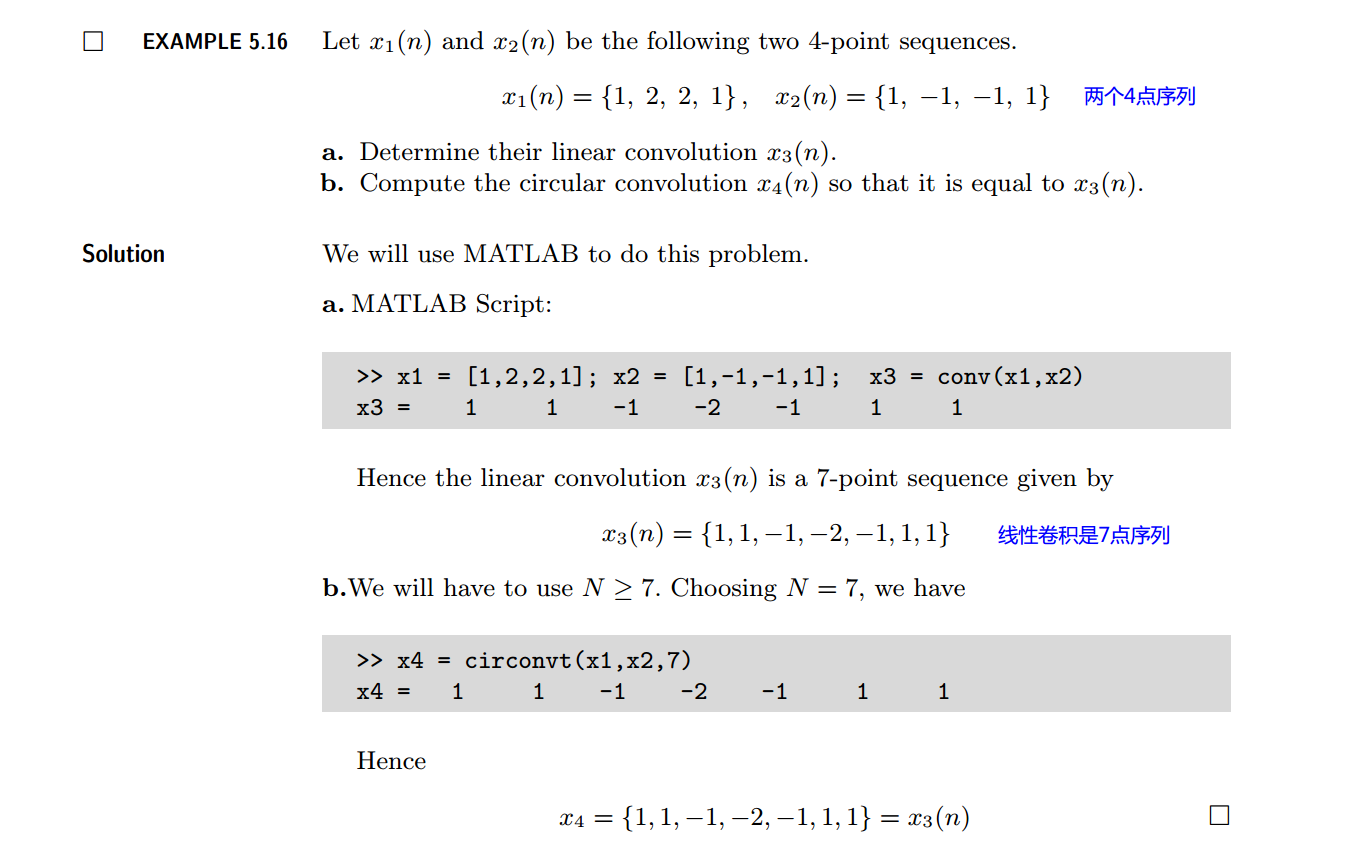
代码:
x1 = [1,2,2,1]; x2 = [1,-1,-1,1];
x3 = conv(x1,x2); % N = 5
n1 = 0:1:length(x1)-1;
n2 = 0:1:length(x2)-1;
n3 = 0:1:length(x3)-1;
%% -----------------------------------------------------------------
%% START a
%% -----------------------------------------------------------------
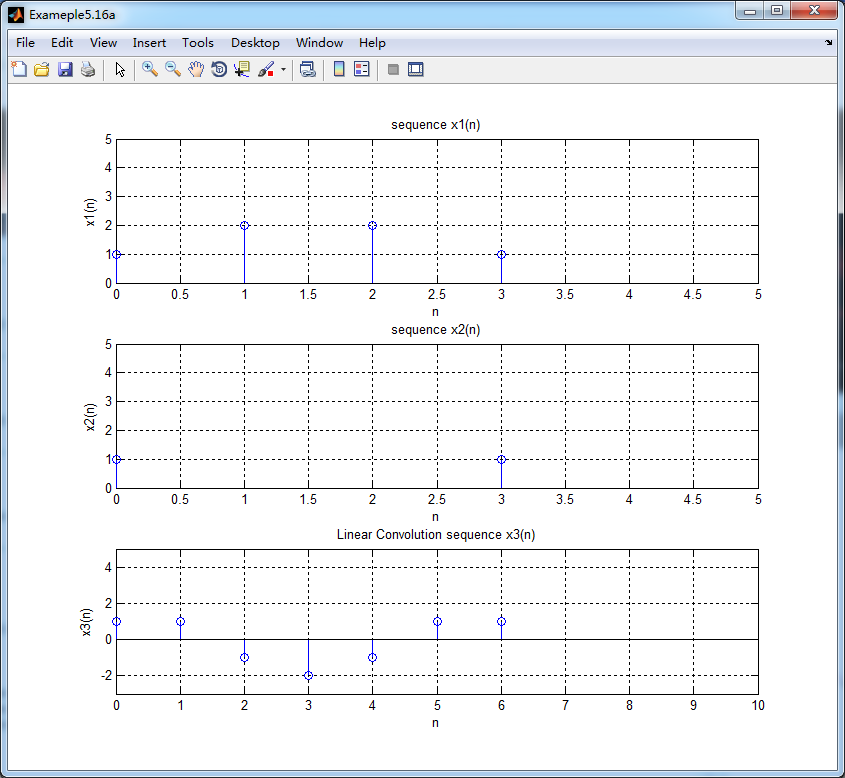
figure('NumberTitle', 'off', 'Name', 'Exameple5.16a ')
set(gcf,'Color','white');
subplot(3,1,1); stem(n1,x1); title('sequence x1(n)'); axis([0,5,0,5]);
xlabel('n'); ylabel('x1(n)'); grid on;
subplot(3,1,2); stem(n2,x2); title('sequence x2(n)'); axis([0,5,0,5]);
xlabel('n'); ylabel('x2(n)'); grid on;
subplot(3,1,3); stem(n3,x3); title('Linear Convolution sequence x3(n)'); axis([0,10,-3,5]);
xlabel('n'); ylabel('x3(n)'); grid on;
%% -----------------------------------------------------------------
%% END a
%% -----------------------------------------------------------------
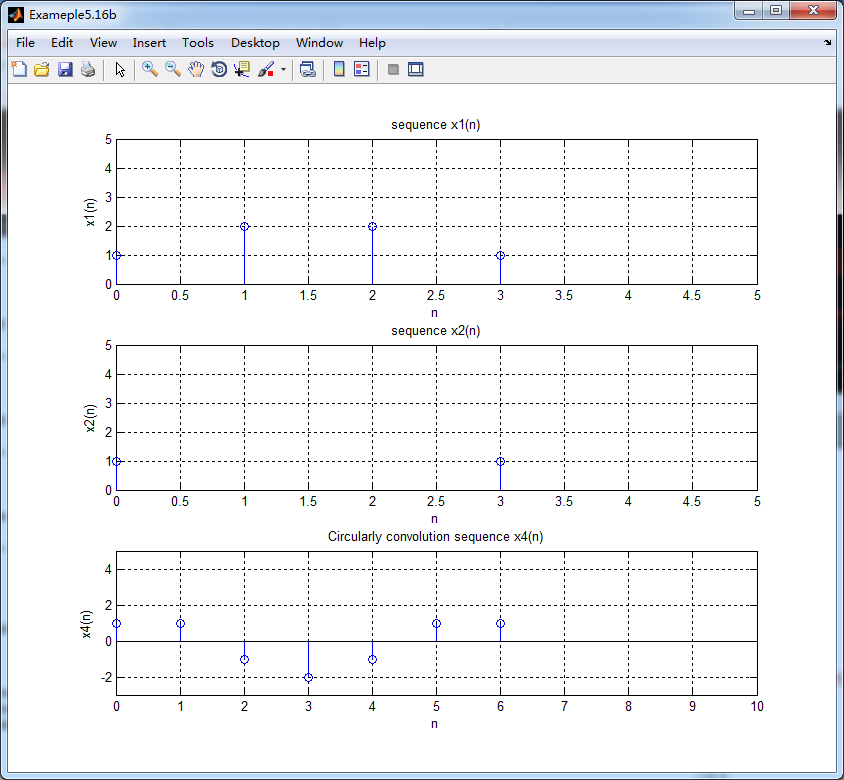
x4 = circonvt(x1,x2,7); % N = 7
n4 = 0:1:length(x4)-1;
%% -----------------------------------------------------------------
%% START b
%% -----------------------------------------------------------------
figure('NumberTitle', 'off', 'Name', 'Exameple5.16b ')
set(gcf,'Color','white');
subplot(3,1,1); stem(n1,x1); title('sequence x1(n)'); axis([0,5,0,5]);
xlabel('n'); ylabel('x1(n)'); grid on;
subplot(3,1,2); stem(n2,x2); title('sequence x2(n)'); axis([0,5,0,5]);
xlabel('n'); ylabel('x2(n)'); grid on;
subplot(3,1,3); stem(n4,x4); title('Circularly convolution sequence x4(n)'); axis([0,10,-3,5]);
xlabel('n'); ylabel('x4(n)'); grid on;
%% -----------------------------------------------------------------
%% END b
%% -----------------------------------------------------------------
运行结果:

牢记:
1、如果你决定做某事,那就动手去做;不要受任何人、任何事的干扰。2、这个世界并不完美,但依然值得我们去为之奋斗。
