
一个简单的C4.5算法,采用Python语言
Test1.py 主要是用来运行的 代码如下:
# -*- coding: utf-8 -*-

from math import log
import operator
import treePlotter

def calcShannonEnt(dataSet):
    """
    输入:数据集
    输出:数据集的香农熵
    描述:计算给定数据集的香农熵;熵越大,数据集的混乱程度越大
    """
    # 数据集个数
    numEntries = len(dataSet)
    #print("dd",numEntries)
    # 标签个数
    labelCounts = {}
    for featVec in dataSet:
        # 获取每一行的结果 也就是yes or no
        currentLabel = featVec[-1]
        # print('e',currentLabel)
        # 判断我获取的这个yes or no 在不在labelCounts字典中 如果不在创建新的设置为0
        if currentLabel not in labelCounts.keys():
            labelCounts[currentLabel] = 0
        labelCounts[currentLabel] += 1
    #print('r',labelCounts)
    shannonEnt = 0.0
    for key in labelCounts:
        # 计算类别信息熵
        prob = float(labelCounts[key])/numEntries
        shannonEnt -= prob * log(prob, 2)
        #print('----',shannonEnt)
    return shannonEnt
# 分别按照这几个属性来计算信息熵 找出最大的,最后按照这一个来划分。
def splitDataSet(dataSet, axis, value):
    """
    输入:数据集,选择维度,选择值
    输出:划分数据集
    描述:按照给定特征划分数据集;去除选择维度中等于选择值的项
    """
    retDataSet = []
    # 这个时候 dataSet 还是完整的
    for featVec in dataSet:
        # print(axis,featVec)
        # print('A',featVec[axis],"是不是等于",value)
        if featVec[axis] == value:
            reduceFeatVec = featVec[:axis]
            # print("B",reduceFeatVec,"此时的维度:",axis)
            reduceFeatVec.extend(featVec[axis+1:])
            retDataSet.append(reduceFeatVec)
    # print('GG',retDataSet)
    return retDataSet

def chooseBestFeatureToSplit(dataSet):
    """
    输入:数据集
    输出:最好的划分维度
    描述:选择最好的数据集划分维度
    """
    # 特征数量 也就是字段个数
    numFeatures = len(dataSet[0]) - 1
    ###################################################################
    # (1)信息增益
    # print('cc',numFeatures)
    # 信息增益实际上是ID3算法中用来进行属性选择度量的。
    # 它选择具有最高信息增益的属性来作为节点N的分裂属性。
    # 该属性使结果划分中的元组分类所需信息量最小。
    # 对D中的元组分类所需的期望信息为下式:
    baseEntropy = calcShannonEnt(dataSet) # 香农熵
    # print('z',baseEntropy)
    bestInfoGainRatio = 0.0 # 最好的熵
    bestFeature = -1 # 最好的特征
    for i in range(numFeatures):
        featList = [example[i] for example in dataSet]
        uniqueVals = set(featList)
        # print('s',i,uniqueVals)
        newEntropy = 0.0
        splitInfo = 0.0
        for value in uniqueVals:
            # 划分数据集
            # print("Bn",i,value)
            subDataSet = splitDataSet(dataSet, i, value)
            #print("After",subDataSet,i,value)
            prob = len(subDataSet)/float(len(dataSet))
            # 现在假定按照属性A划分D中的元组,且属性A将D划分成v个不同的类。
            # 在该划分之后,为了得到准确的分类还需要的信息由下面的式子度量
            newEntropy += prob * calcShannonEnt(subDataSet)
            # 信息增益定义为原来的信息需求(即仅基于类比例)与新需求(即对A划分之后得到的)之间的差
            splitInfo += -prob * log(prob, 2)
        # 信息增益
        infoGain = baseEntropy - newEntropy
        ##########################################################################
        if (splitInfo == 0): # 修复溢出错误
            continue
        #########################################################################
        # (2)信息增益率
        # 训练数据集D划分成对应于属性A测试的v个输出的v个划分产生的信息。信息增益率定义:
        infoGainRatio = infoGain / splitInfo
        # 选择具有最大增益率的属性作为分裂属性。
        if (infoGainRatio > bestInfoGainRatio):
            bestInfoGainRatio = infoGainRatio
            bestFeature = i
    return bestFeature

def majorityCnt(classList):
    """
    输入:分类类别列表
    输出:子节点的分类
    描述:数据集已经处理了所有属性,但是类标签依然不是唯一的,
          采用少数服从多数的原则决定该子节点的分类
    """
    ''' 找出数量最多的分类 '''
    # 分类字典
    classCount = {}
    for vote in classList:
        if vote not in classCount.keys():
            classCount[vote] = 0
        classCount[vote] += 1
    # 创建键值为classList中唯一值的数据字典,字典对象存储了classList中每个类标签出现的频率,最后利用operator操作键值排序字典,并返回出现次数最多的分类名称。
    # iteritems:迭代器
    # operator模块提供的itemgetter函数用于获取对象的哪些维的数据,参数为一些序号(即需要获取的数据在对象中的序号)
    # sorted() 是Python内置的一个排序函数,它会从一个"迭代器"返回一个排好序的新列表。
    sortedClassCount = sorted(classCount.iteritems(), key=operator.itemgetter(1), reversed=True)
    return sortedClassCount[0][0]
# 创建决策树 参数:数据集、标签
def createTree(dataSet, labels):
    """
    输入:数据集,特征标签
    输出:决策树
    描述:递归构建决策树,利用上述的函数
    """
    # 截取dataSet的最后一行
    classList = [example[-1] for example in dataSet]
    # 数据集都是同一类的情况
    if classList.count(classList[0]) == len(classList):
        return classList[0]
    # 遍历完所有特征时返回出现次数最多的
    #print('bb',dataSet[1])
    # 如果数据集只有一个特征的情况
    if len(dataSet[0]) == 1:
        return majorityCnt(classList)
    # 最大增益率的属性作为分裂属性
    bestFeat = chooseBestFeatureToSplit(dataSet)  # 最好的特征
    # print('bestFeat',bestFeat) # 0 2 当选择0(outlook)之后 剩下的012中选择2(windy)中
    bestFeatLabel = labels[bestFeat] # 最好的分类
    myTree = {bestFeatLabel:{}}
    # print(myTree) # {'outlook': {}} {'windy': {}}
    del(labels[bestFeat])
    # 得到列表包括节点所有的属性值
    featValues = [example[bestFeat] for example in dataSet]
    # print('featValues',featValues)
    uniqueVals = set(featValues)
    # print('uniqueVals',uniqueVals)
    for value in uniqueVals:
        # 去掉前面标签之后剩下的标签
        subLabels = labels[:]
        # print('subLabels',subLabels)
        myTree[bestFeatLabel][value] = createTree(splitDataSet(dataSet, bestFeat, value), subLabels)
        # print('myTree',myTree)
    return myTree

def classify(inputTree, featLabels, testVec):
    """
    输入:决策树,分类标签,测试数据
    输出:决策结果
    描述:跑决策树
    """
    firstStr = list(inputTree.keys())[0]
    # print('t2',firstStr)
    secondDict = inputTree[firstStr]
    #print('t3',secondDict)
    featIndex = featLabels.index(firstStr)
    # print('t4',featIndex)
    for key in secondDict.keys():
        #print('key',key)
        if testVec[featIndex] == key:
            #print('testVec[featIndex]',testVec[featIndex])
            if type(secondDict[key]).__name__ == 'dict':
                classLabel = classify(secondDict[key], featLabels, testVec)
            else:
                classLabel = secondDict[key]
    # print('t5',classLabel)
    return classLabel
# 通过输入的决策树和对应的标签  来对测试集合 进行预测
def classifyAll(inputTree, featLabels, testDataSet):
    """
    输入:决策树,分类标签,测试数据集
    输出:决策结果
    描述:跑决策树
    """
    # 空列表
    classLabelAll = []
    for testVec in testDataSet:
        # print('t1',testVec)
        # 将预测结果插入到classLabelAll中
        classLabelAll.append(classify(inputTree, featLabels, testVec))
        # print("t6",classLabelAll)
    return classLabelAll

# 训练集
def createDataSet():
    """
    天气情况 outlook->   sunny | overcast |  rain
    温度情况 temperature->  hot |  mild | cool
    湿度情况 humidity-> high |  normal
    风力情况 windy-> false | true
    """
    ######## no or yes  is play golf ???
    dataSet = [["sunny",    "hot",   "high", "false",  'no'],
               ["sunny",    "hot",   "high",  "true",  'no'],
               ["overcast", "hot",   "high", "false", 'yes'],
               ["rain",    "mild",   "high", "false", 'yes'],
               ["rain",    "cool", "normal", "false", 'yes'],
               ["rain",    "cool", "normal",  "true",  'no'],
               ["overcast","cool", "normal",  "true", 'no'],
               ["rain",     "hot",   "high",  "true", 'yes'],
               ["sunny",   "mild",   "high",  "true", 'no'],
               ["rain",     "hot", "normal",  "true", 'yes'],
               ["overcast","mild",   "high", "false", 'no']]
    # 对应的标签
    labels = ['outlook', 'temperature', 'humidity', 'windy']
    return dataSet, labels
# 测试集
def createTestSet():
    testSet = [["sunny",   "mild",   "high", "false"],
               ["sunny",   "cool", "normal", "false"],
               ["rain",    "mild", "normal", "false"],
               ["sunny",   "mild", "normal",  "true"],
               ["overcast","mild",   "high",  "true"],
               ["rain", "hot", "normal", "true"],
               ["sunny", "mild", "normal", "false"],
               ["rain", "hot", "high", "true"],
               ["sunny", "mild", "high", "true"],
               ["rain", "hot", "normal", "true"],
               ["overcast", "mild", "high", "false"],
               ["rain",    "mild",   "high",  "true"]]
    return testSet
#主函数 定义
def main():
    dataSet, labels = createDataSet()
    labels_tmp = labels[:] # 拷贝 labels
    Tree = createTree(dataSet, labels_tmp)
    print('Tree:\n', Tree)
    treePlotter.createPlot(Tree)
    print('------------------------------')
    # 获取测试集 进行预测
    testSet = createTestSet()
    print('classifyResult:\n', classifyAll(Tree, labels, testSet))
# 调用主函数
if __name__ == '__main__':
    main()
treePlotter.py 用来画决策树。 代码如下所示:
import matplotlib.pyplot as plt
# 定义文本框和箭头格式
decisionNode = dict(boxstyle="sawtooth", fc="0.8")
leafNode = dict(boxstyle="round4", fc="0.8")
arrow_args = dict(arrowstyle="<-")
# 绘制带箭头的注释
def plotNode(nodeTxt, centerPt, parentPt, nodeType):
    createPlot.ax1.annotate(nodeTxt, xy=parentPt, xycoords='axes fraction', \
                            xytext=centerPt, textcoords='axes fraction', \
                            va="center", ha="center", bbox=nodeType, arrowprops=arrow_args)
''' 获得决策树的叶节点数 '''
def getNumLeafs(myTree):
    numLeafs = 0
    # fistStr获得字典的键 代表树根
    firstStr = list(myTree.keys())[0] # 头结点
    # print('firstStr',firstStr)
    secondDict = myTree[firstStr] # 取出头结点的的字典
    for key in secondDict.keys(): # 测试节点的数据类型是否为字典
        if type(secondDict[key]).__name__ == 'dict':
            numLeafs += getNumLeafs(secondDict[key])
        else:
            numLeafs += 1
    return numLeafs
''' 求树的深度 '''
def getTreeDepth(myTree):
    maxDepth = 0
    firstStr = list(myTree.keys())[0] # 头结点
    secondDict = myTree[firstStr]
    for key in secondDict.keys(): # 测试节点的数据类型是否为字典
        if type(secondDict[key]).__name__ == 'dict':
            thisDepth = getTreeDepth(secondDict[key]) + 1
        else:
            thisDepth = 1
        if thisDepth > maxDepth:
            maxDepth = thisDepth
    return maxDepth
''' 在父子节点之间填充文本信息 '''
def plotMidText(cntrPt, parentPt, txtString):
    xMid = (parentPt[0] - cntrPt[0]) / 2.0 + cntrPt[0]
    yMid = (parentPt[1] - cntrPt[1]) / 2.0 + cntrPt[1]
    createPlot.ax1.text(xMid, yMid, txtString)
''' 根节点坐标 '''
def plotTree(myTree, parentPt, nodeTxt):
    numLeafs = getNumLeafs(myTree)  # 子节点数量
    depth = getTreeDepth(myTree)     # 深度
    firstStr = list(myTree.keys())[0]  # 根节点的key
    '''X坐标=节点的x偏移量 + 叶节点数距离
    所有该节点下子叶子节点的距离:numLeafs / plotTree.totalW
    但是坐标在叶子节点的中心:numLeafs / 2 / plotTree.totalW
    又因为xOff初始坐标点在原点的左边:numLeafs / 2 / plotTree.totalW + 0.5 / plotTree.totalW ,这是偏移量
    那么x = numLeafs / 2 / plotTree.totalW + 0.5 / plotTree.totalW + plotTree.xOff
    '''
    # 根节点坐标
    # 叶子节点距离
    cntrPt = (plotTree.xOff + (1.0 + float(numLeafs)) / 2.0 / plotTree.totalw, plotTree.yOff)
    # 标记子节点属性值
    plotMidText(cntrPt, parentPt, nodeTxt)
    plotNode(firstStr, cntrPt, parentPt, decisionNode)
    secondDict = myTree[firstStr]
    plotTree.yOff = plotTree.yOff - 1.0 / plotTree.totalD
    for key in secondDict.keys():
        if type(secondDict[key]).__name__ == 'dict':
            plotTree(secondDict[key], cntrPt, str(key))
        else:
            plotTree.xOff = plotTree.xOff + 1.0 / plotTree.totalw
            plotNode(secondDict[key], (plotTree.xOff, plotTree.yOff), cntrPt, leafNode)
            plotMidText((plotTree.xOff, plotTree.yOff), cntrPt, str(key))
    plotTree.yOff = plotTree.yOff + 1.0 / plotTree.totalD
# plot构建树
def createPlot(inTree):
    # figure语法 创建自定义图像 定义了一个框架
    # num:图像编号或名称,数字为编号
    # facecolor:背景颜色
    fig = plt.figure(1, facecolor='white')
    #plt.close()将完全关闭图形窗口
    # plt.clf()将清除图形-您仍然可以在其上绘制另一个绘图。
    fig.clf()
    # xticks是一个列表,其中的元素就是x轴上将显示的坐标
    # yticks是y轴上显示的坐标,这里空列表则不显示坐标
    axprops = dict(xticks=[], yticks=[])
    # 这里定义一个子图窗口
    # 第一个参数xyz含义是,将框架划分为x行y列窗口,ax1代表其第z个窗口。
    # ps:111 就是一行一列第一个窗口
    # frameon = False将隐藏坐标轴
    createPlot.ax1 = plt.subplot(111, frameon=False, **axprops)
    # plotTree.totalW是决策树的叶子树,也代表宽度
    plotTree.totalw = float(getNumLeafs(inTree))
    # plotTree.totalD是决策树的深度
    plotTree.totalD = float(getTreeDepth(inTree))
    # 方便后面加上 1.0 / plotTree.totalW 后位置刚好在中间
    plotTree.xOff = -0.5 / plotTree.totalw
    plotTree.yOff = 1.0
    # 调用函数plotTree(),绘制整棵决策树,最后显示出来。
    plotTree(inTree, (0.5, 1.0), '')
    plt.show()
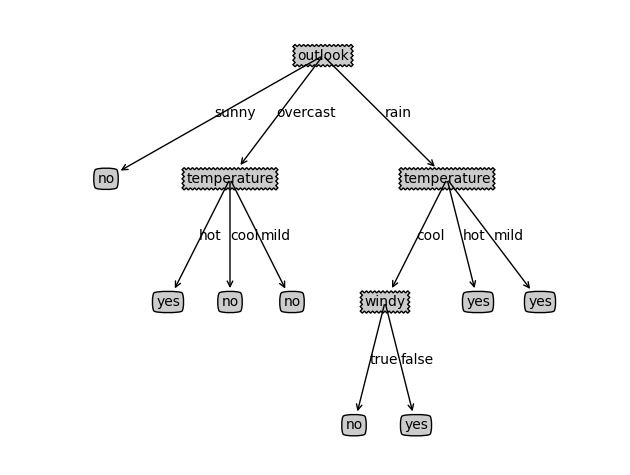
运行结果如下所示:


 浙公网安备 33010602011771号