
summarize() 计算摘要统计量 搭配group_by()分组计算 ; 等效aggregate()
summarize() 即summarise(). 输出列包含group_by分组变量以及计算所得统计量
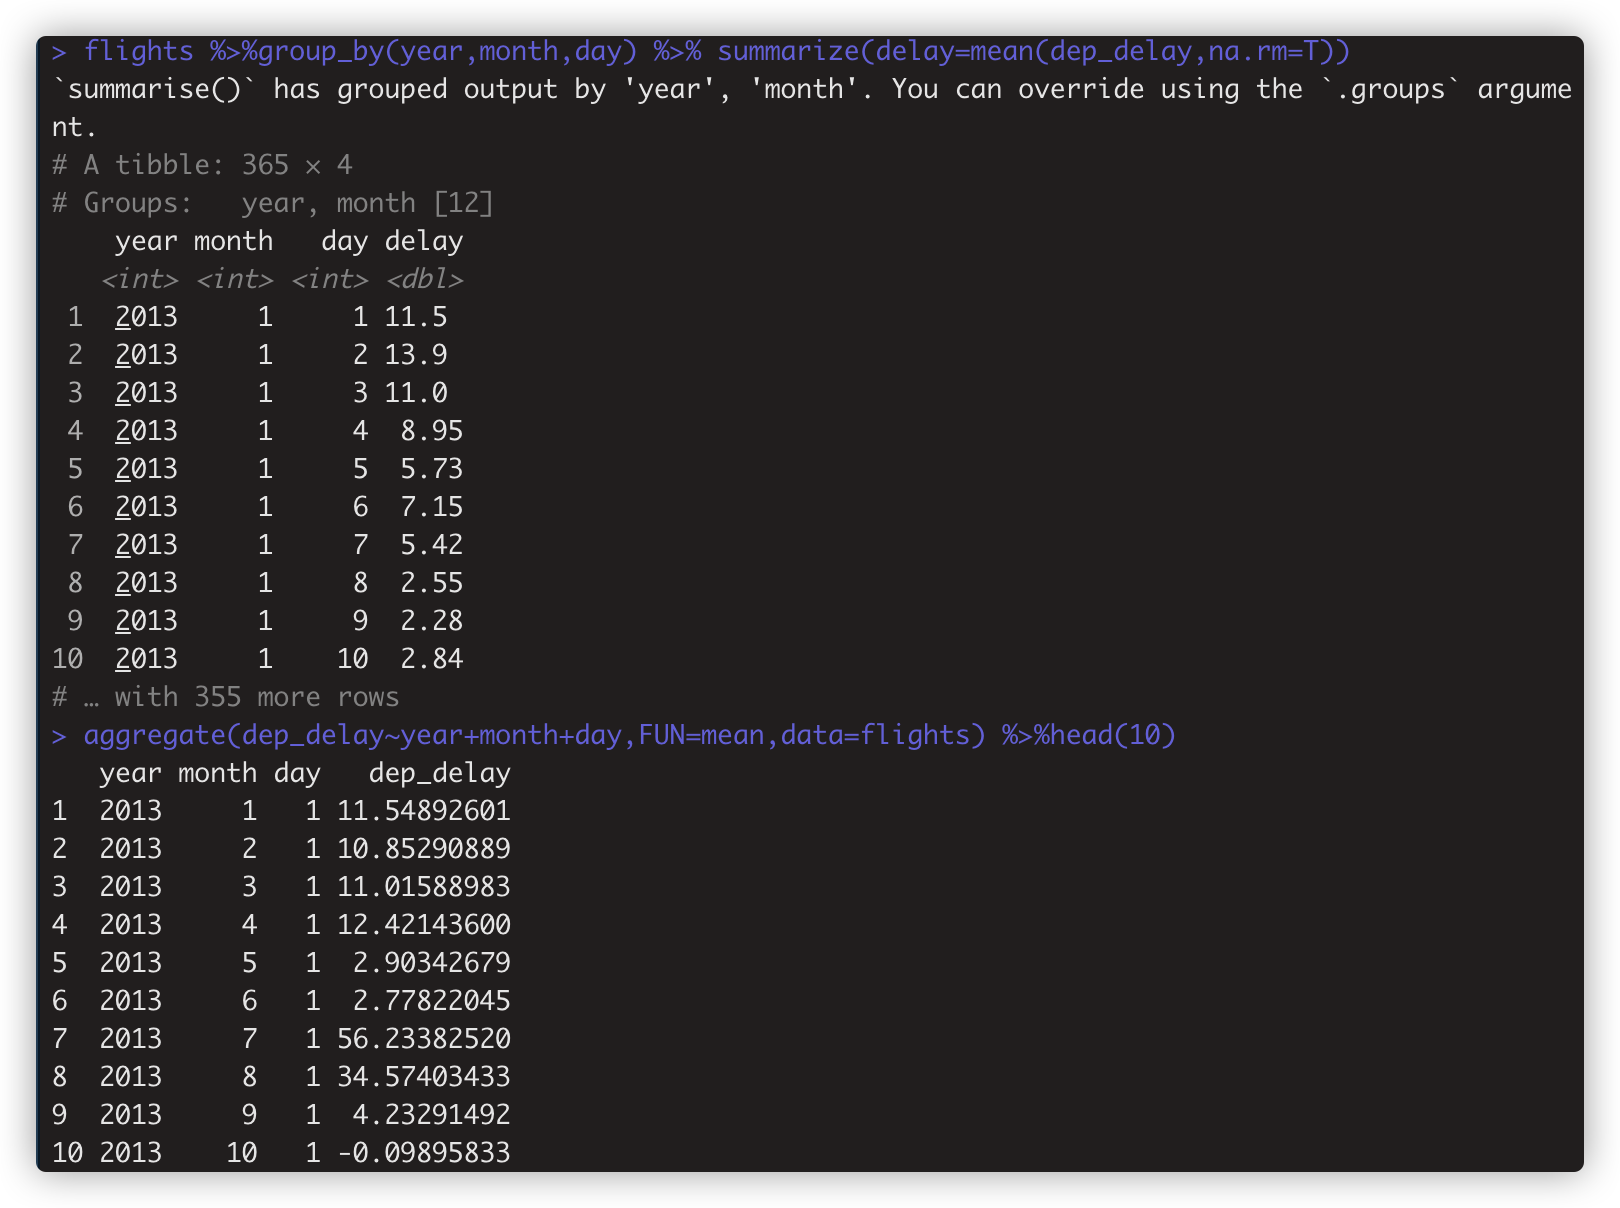
如: > flights %>% group_by(year,month,day) %>% summarize(delay=mean(dep_delay,na.rm=T)) # na.rm=T 计算前剥离缺失值na,否则统计值容易出现很多na
进一步的summarise函数扩展
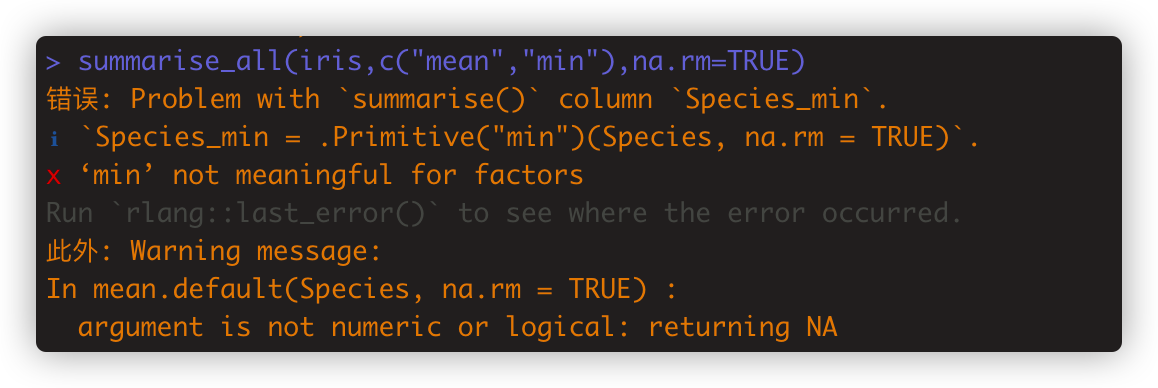
- summarise_all 默认对所有变量列计算fun()函数 ,但一般不是所有列都适合函数,如有的列是字符型不能平均值计算。如
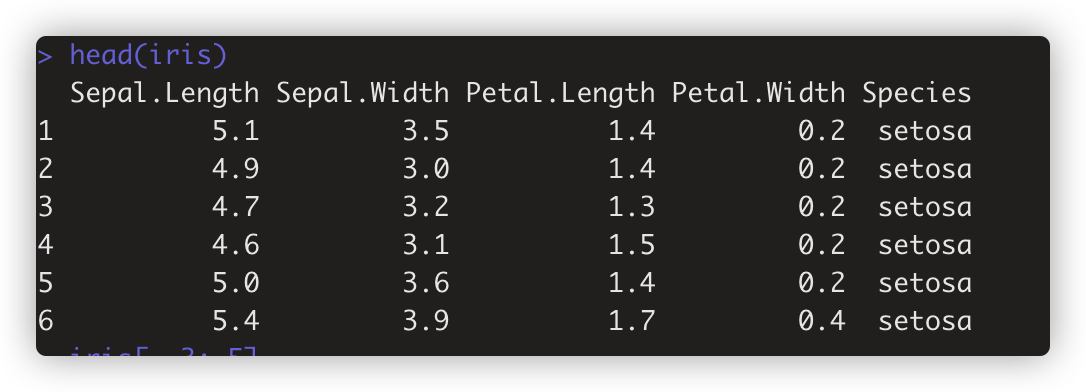
head(iris)
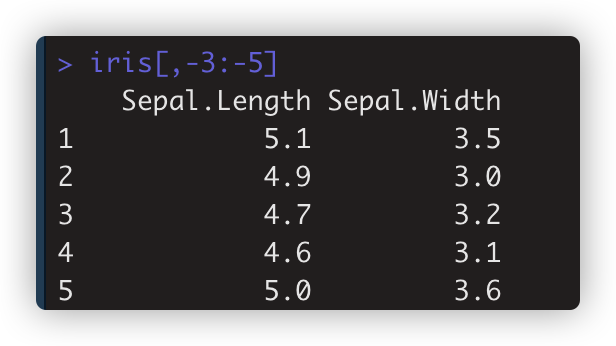
iris[,-3:-5] # 去掉3-5列,这里即只取1-2列
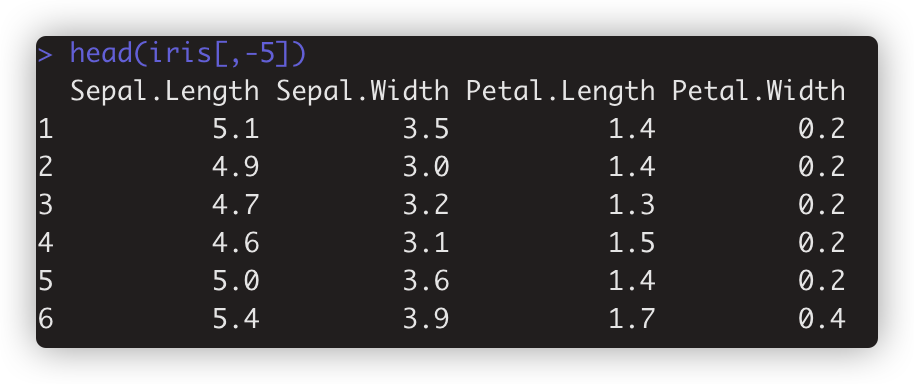
head(iris[,-5]) #不取第5列 #R 的负号是不取的意思
summarise_all(iris,c("mean","min"),na.rm=TRUE) #某列是factor型,函数计算对此列没意义
summarise_all(iris[,-3:-5],c("mean","min"),na.rm=TRUE)

- summarise_at() 对指定的变量列,运行函数。最像select%>%summarise 如
iris %>% summarise_at(vars("Sepal.Length","Sepal.Width"),mean,na.rm=TRUE) #用vars()括起选择的变量列

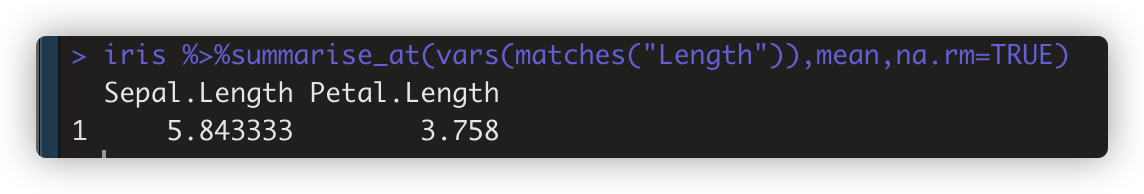
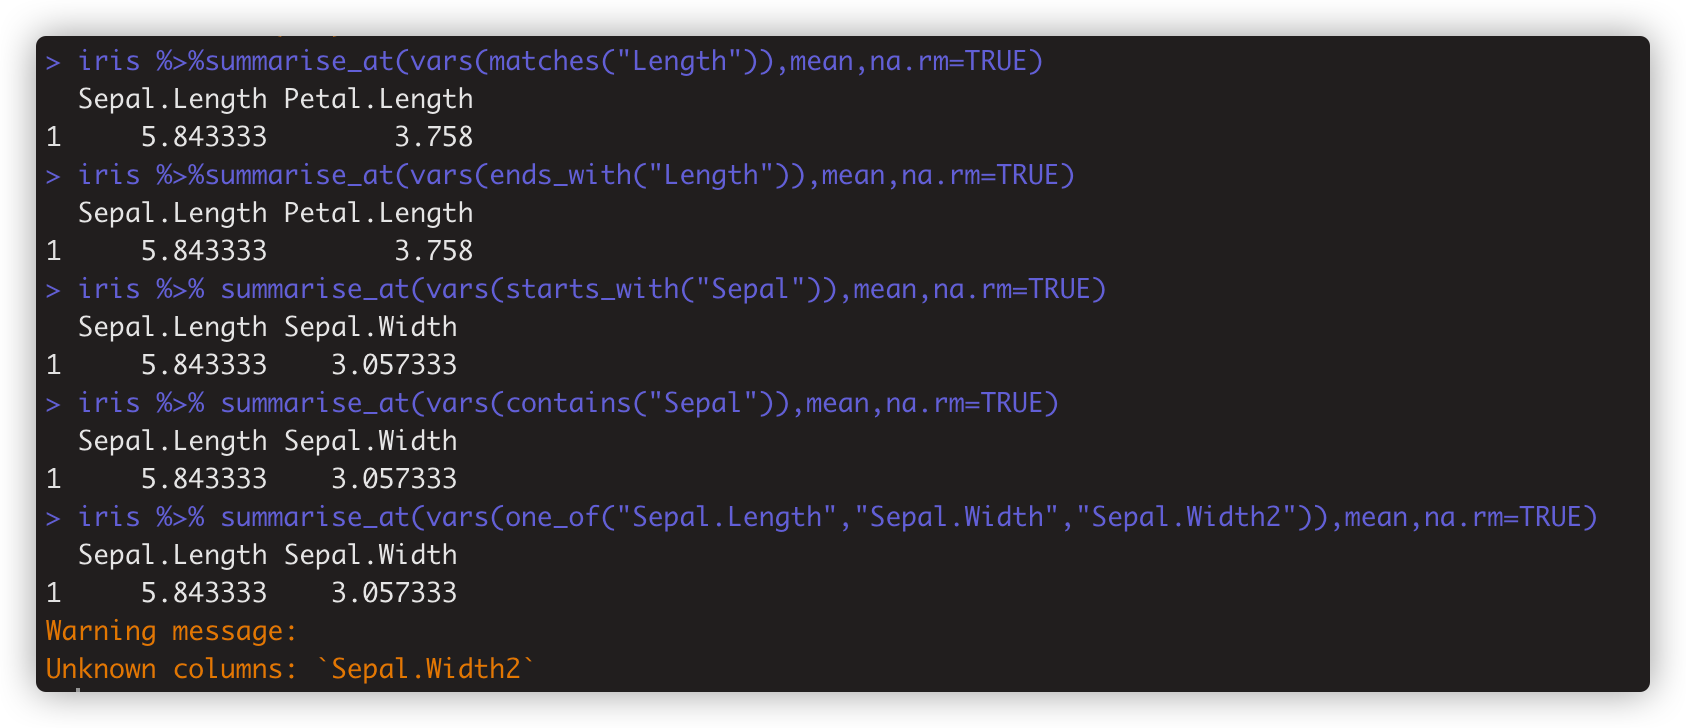
iris %>%summarise_at(vars(matches("Length")),mean,na.rm=TRUE #对匹配上Length的列用vars()括起来,运行函数
通过条件设置选择列还包括:
iris %>%summarise_at(vars(ends_with("Length")),mean,na.rm=TRUE) # 列名以“Length”结尾的列
iris %>% summarise_at(vars(starts_with("Sepal")),mean,na.rm=TRUE) # 列名以“Sepal”开头的列
iris %>% summarise_at(vars(contains("Sepal")),mean,na.rm=TRUE) #列名含"Sepal"的列 . contains 和matches 功能一致
iris %>% summarise_at(vars(one_of("Sepal.Length","Sepal.Width","Sepal.Width2")),mean,na.rm=TRUE) # 列名在这范围内的列
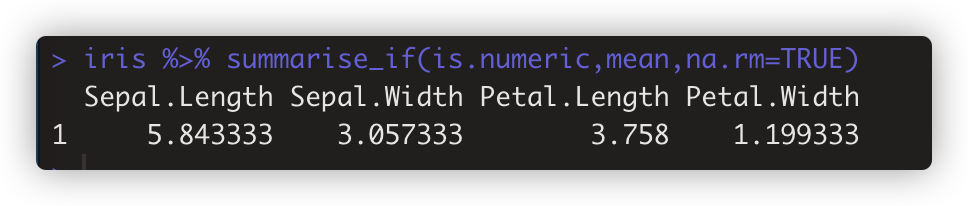
- summarise_if 列变量类型符合条件的列。如 iris %>% summarise_if(is.numeric,mean,na.rm=TRUE)
上述等效:aggregate(dep_delay~year+month+day,FUN=mean,data=flights) %>%head(20) 。只是summarize+group_by()很好的最后一个分组基础单位先循环
默认的aggregate(x,by,FUN) 将数据框x的观测行按by=分组,然后用FUN函数计算每组的summary statistics。结果包含by变量和x . #by接 分组的list。 等效的使用方式汇总如下:
## Default S3 method:
aggregate(x, ...)

## S3 method for class 'data.frame'
aggregate(x, by, FUN, ..., simplify = TRUE, drop = TRUE)

## S3 method for class 'formula' #应用中很常见
aggregate(formula, data, FUN, ...,
          subset, na.action = na.omit)

## S3 method for class 'ts'
aggregate(x, nfrequency = 1, FUN = sum, ndeltat = 1,
          ts.eps = getOption("ts.eps"), ...)
#formula, a formula, such as y ~ x or cbind(y1, y2) ~ x1 + x2, where the y variables are numeric data to be split into groups according to the grouping x variables (usually factors). ~左侧是要计算聚合值的变量,右侧代表分组依据。
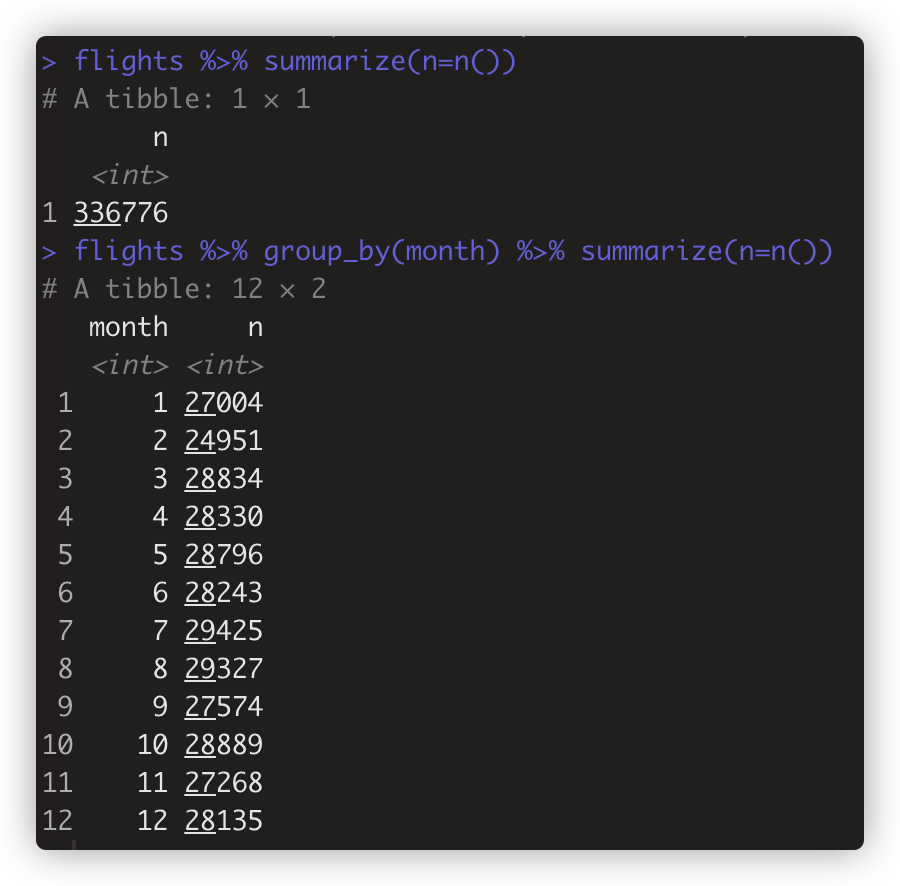
- n()常用于summarize()中,单独使用时计算行数。 flights %>% summarize(n=n())
- n()与group_by搭配使用,计算每个分组有多少个观测。 flights %>% group_by(month) %>% summarize(n=n()) # n=n()等价n=sum(month)
-
注:我n()会把缺失值包含在计数中,如果只算非缺失值,可以用sum(!is.na(x)) . # 需要再雕琢
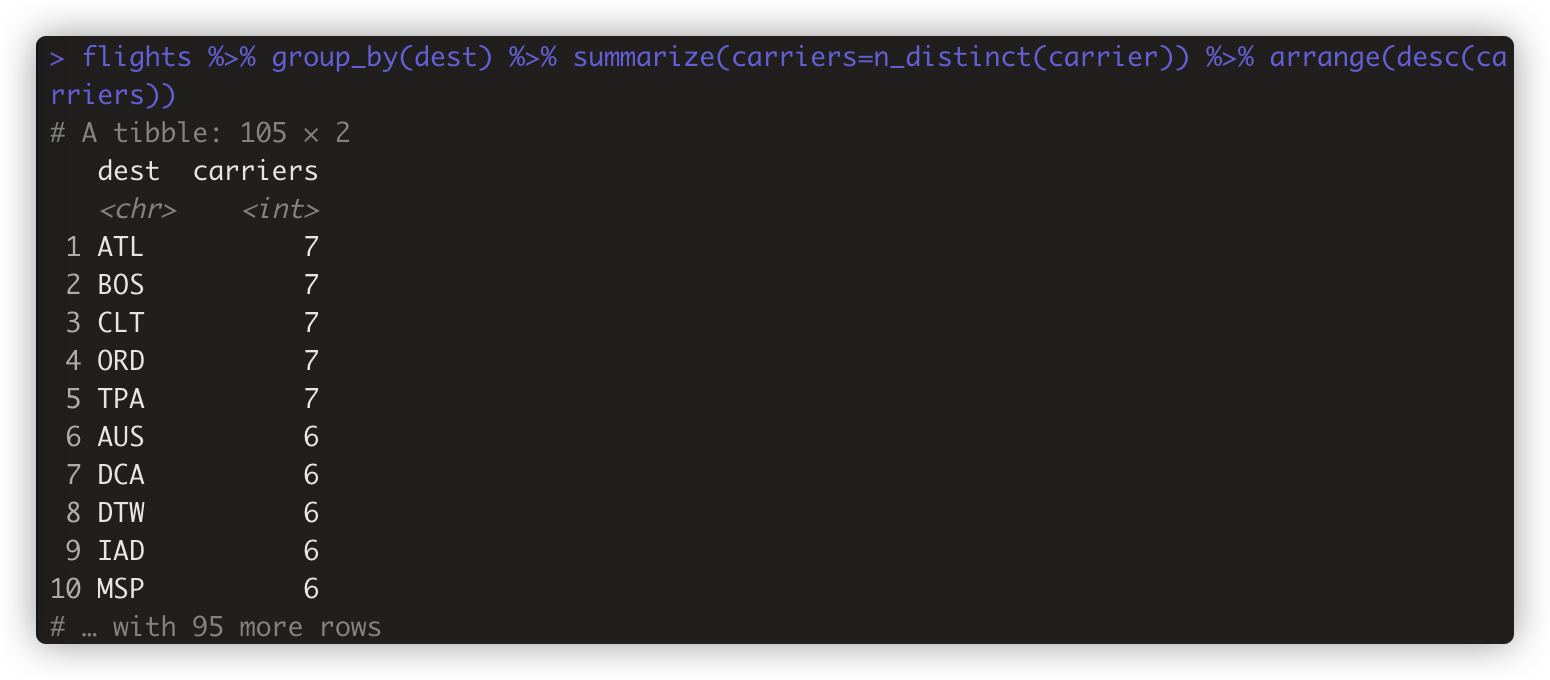
- 如只计算唯一值的数量,用n_distinct(). 如 >flights %>% group_by(dest) %>% summarize(carriers=n_distinct(carrier)) %>% arrange(desc(carriers))
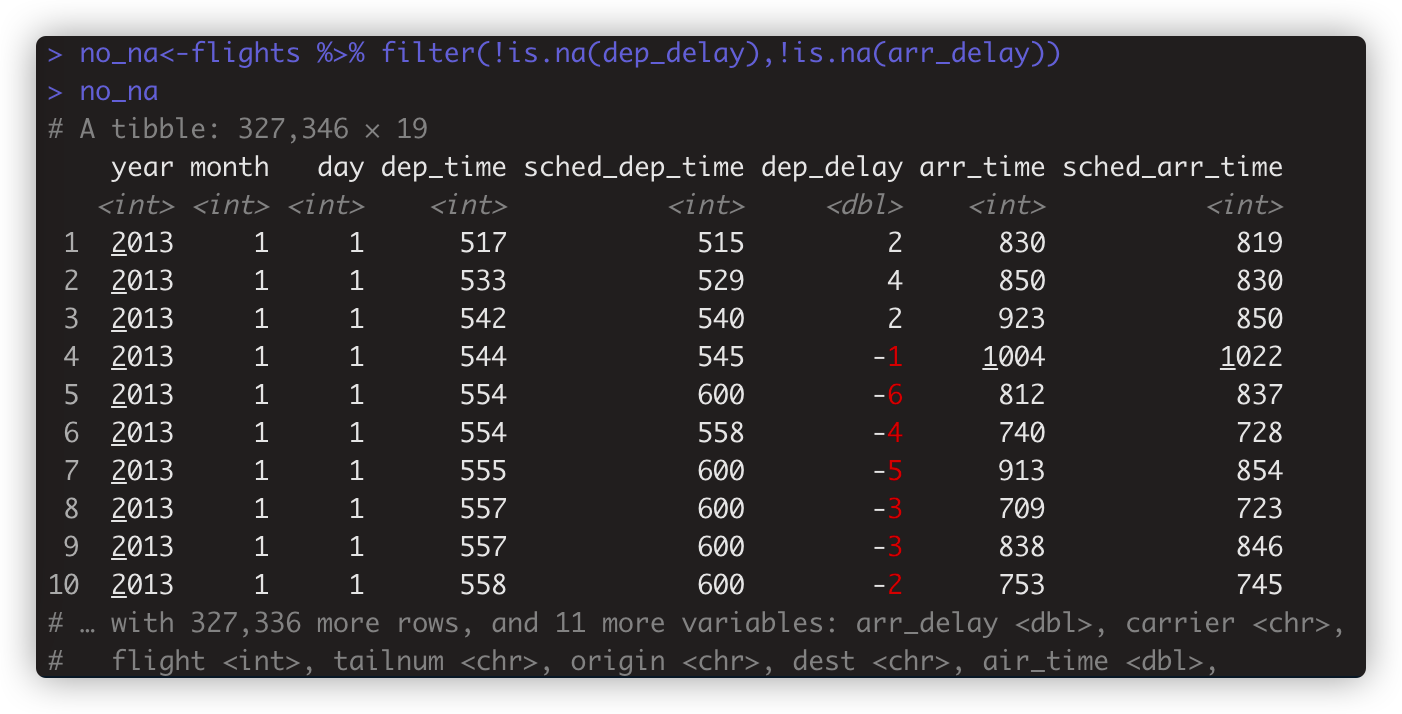
注2:所有聚合函数都有na.rm参数,好在计算前除去缺失值。 也可以计算前 通过no_na<-flights %>% filter(!is.na(dep_delay),!is.na(arr_delay)) 这样先筛选非na的观测行。
n()外的计数函数还包括
tally(x, wt = NULL, sort = FALSE, name = "n")
count(x, ..., wt = NULL, sort = FALSE, name = "n",
.drop = group_by_drop_default(x))
add_tally(x, wt, sort = FALSE, name = "n")
add_count(x, ..., wt = NULL, sort = FALSE, name = "n")
summary()结合n()为作图准备:
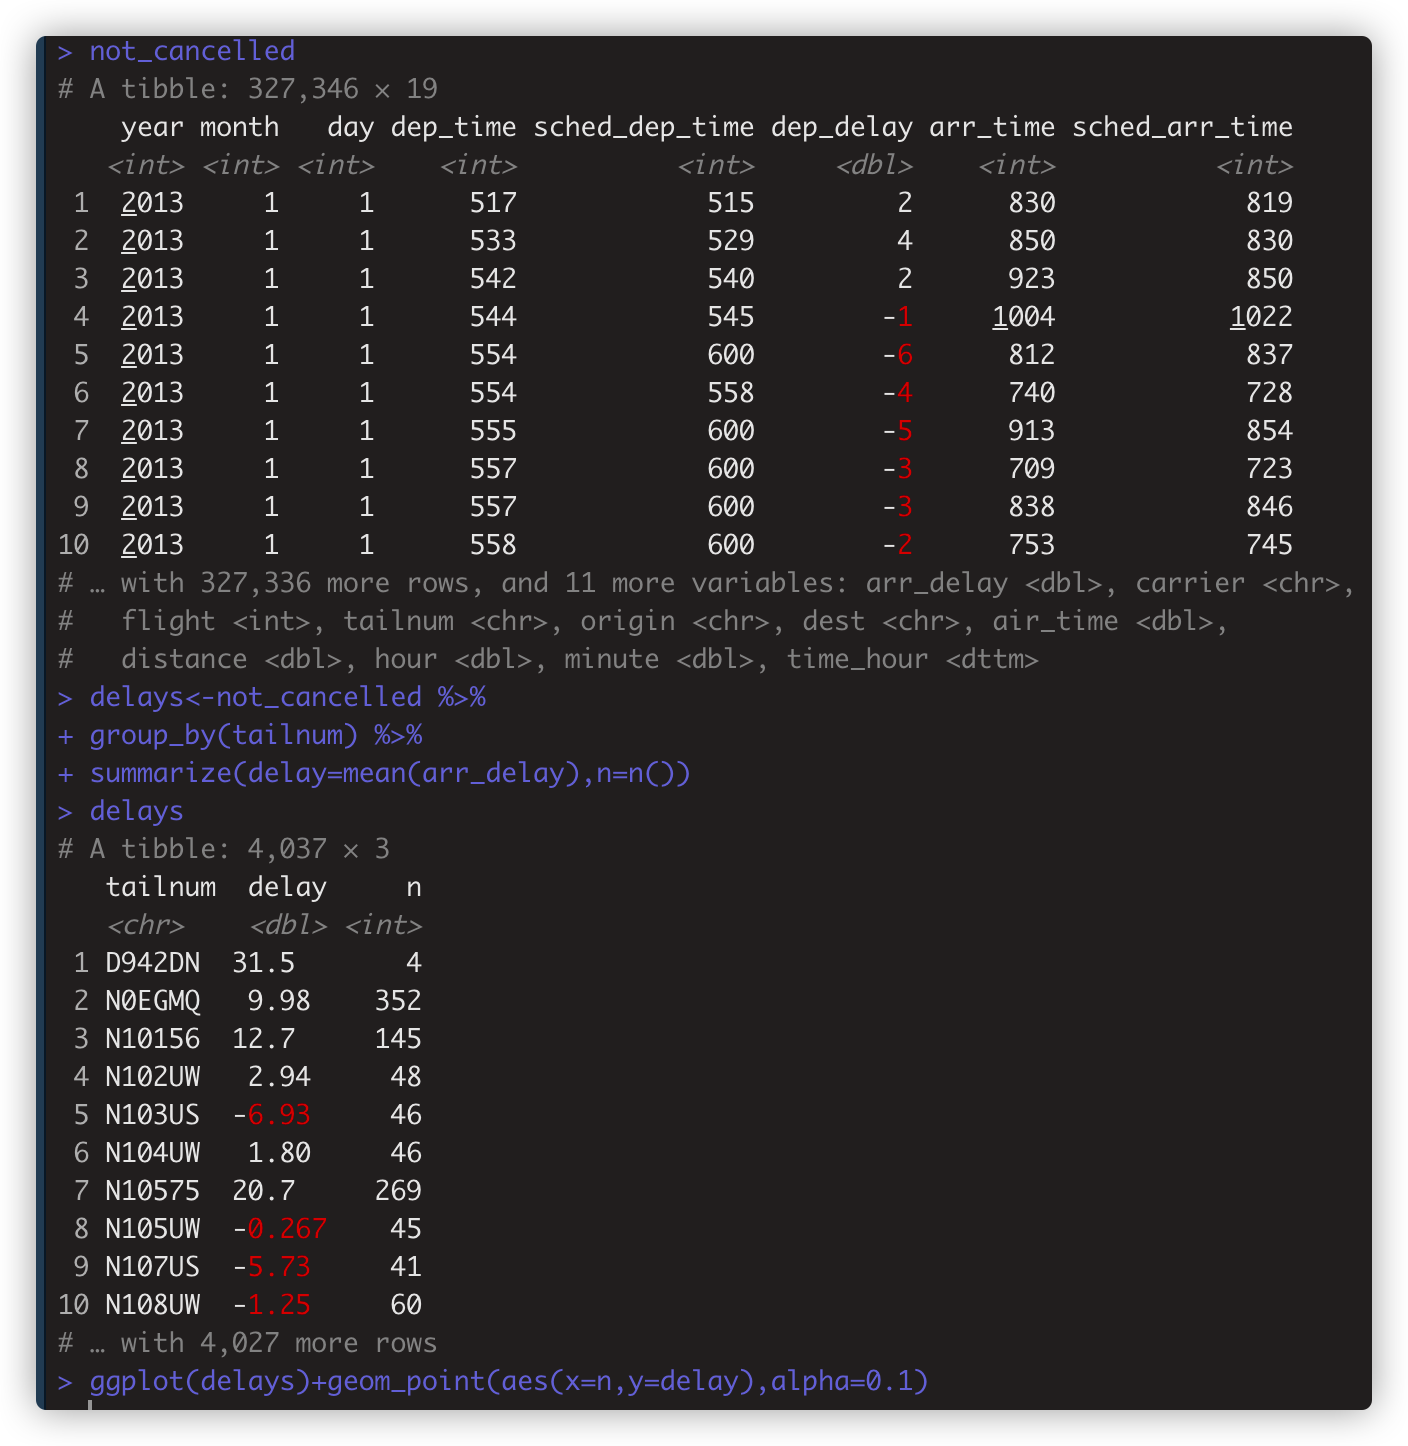
- not_cancelled<-flights %>% filter(!is.na(dep_delay),!is.na(arr_delay)) # 筛选值非na 行
-
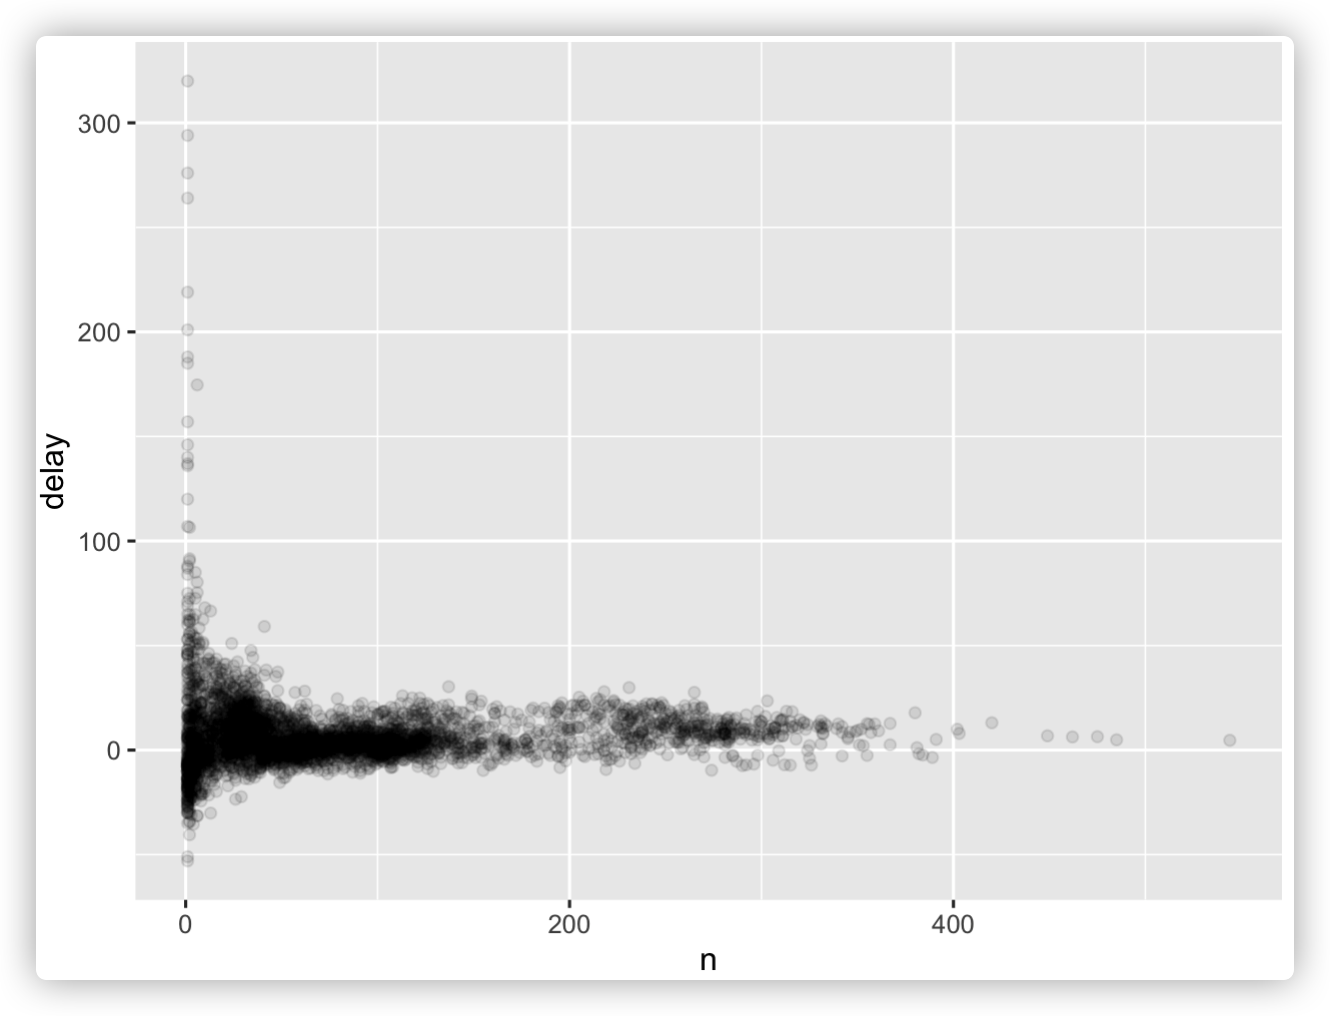
delays<-not_cancelled %>% group_by(tailnum) %>% summarize(delay=mean(arr_delay),n=n()) #生成summary statistics
- ggplot(delays)+geom_point(aes(x=n,y=delay),alpha=0.1) # 基于summary statistics作图。
-
常用于summarize()函数中的基础计算常常还包括:
- sum()计数。 not_cancelled %>% group_by(year,month,day) %>% summarize(n_early=sum(dep_time<500))
- mean() 所占比例。not_cancelled %>% group_by(year,month,day) %>% summarize(n_early=mean(arr_delay>60))
- median()中位数。not_cancelled %>% group_by(year,month,day) %>% summarize( arr_delay1=median(arr_delay))
- sd()标准差。 not_cancelled %>% group_by(dest) %>% summarize(distance_sd=sd(distance)) %>%arrange(desc(distance_sd))

-
IQR() 四分位距
-
mad() 绝对中值差
-
min(x) 最小值
- quantile(x,0.25) 找出x中从小到大排序大于前25%而小于后75%的📄
-
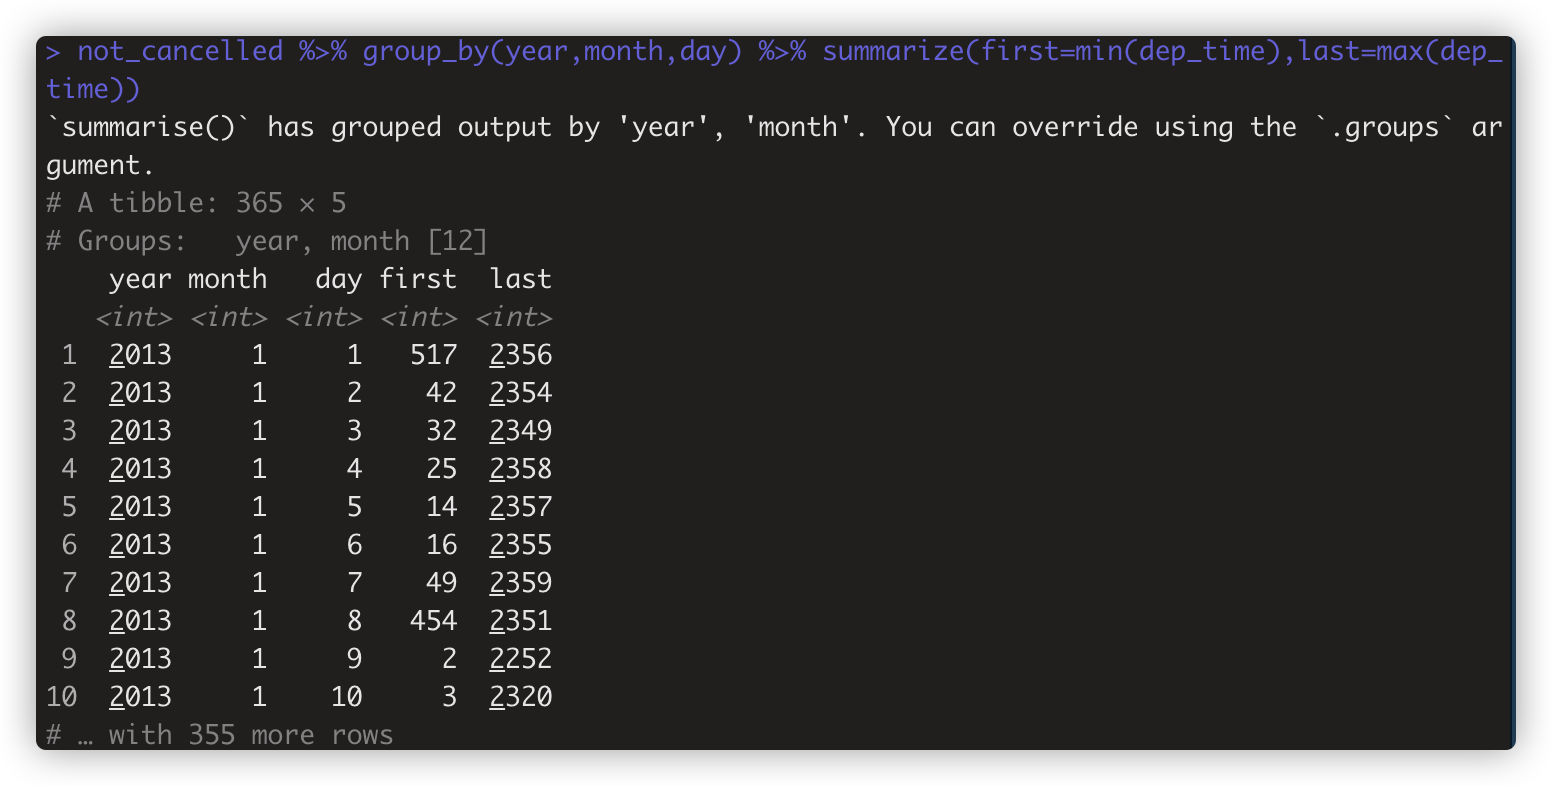
max(x) 最大值 .如:not_cancelled %>% group_by(year,month,day) %>% summarize(first=min(dep_time),last=max(dep_time))
-
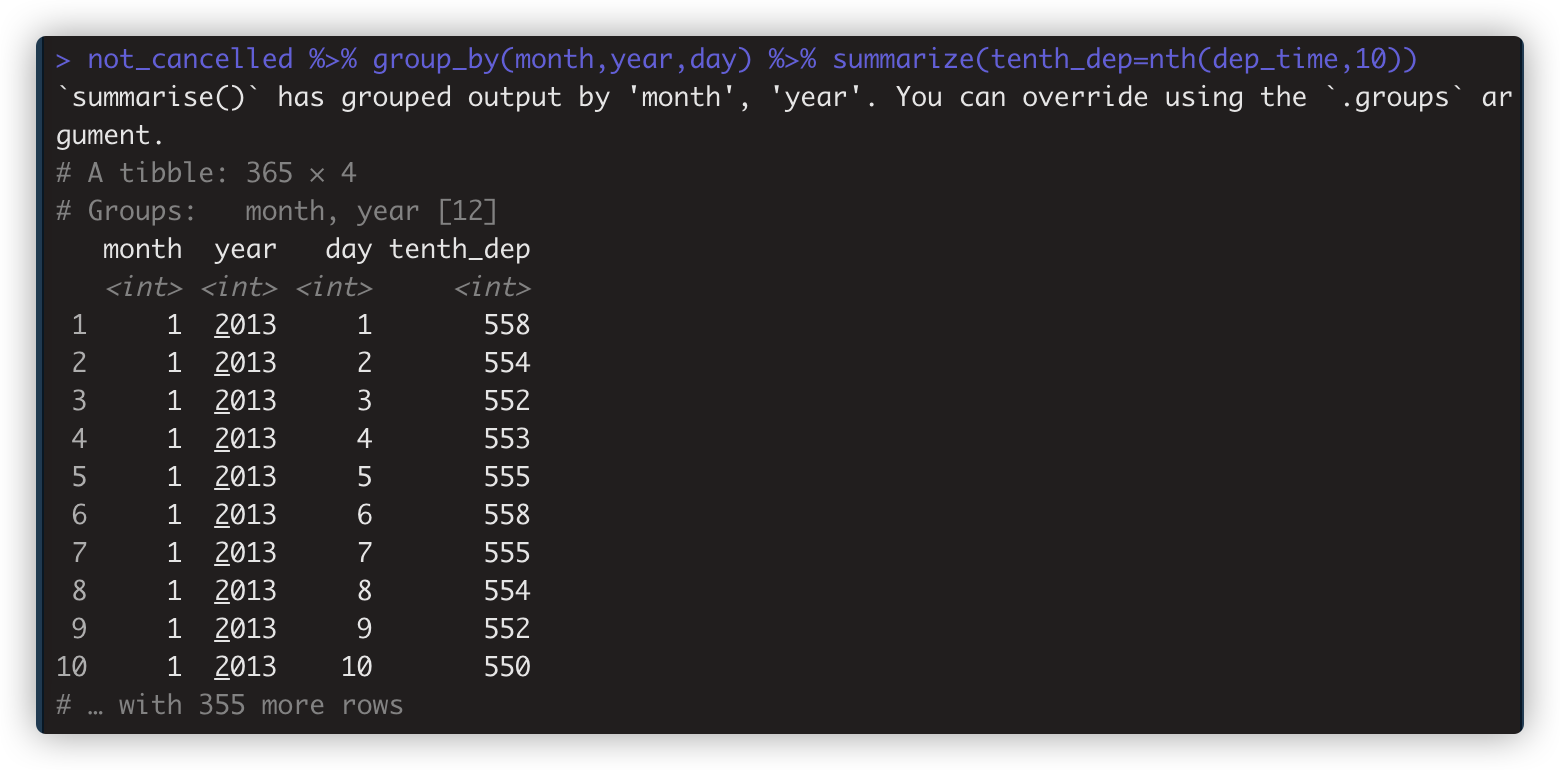
first(x) nth(x,n) last(x) 取向量的第一个、第n个、最后一个值. 如not_cancelled %>% group_by(month,year,day) %>% summarize(tenth_dep=nth(dep_time,10))
aggregate() 数据统计的常用formular方式。
aggregate(formula, data, FUN, ..., subset, na.action = na.omit)
- formula, 指定formula对象,包括符号~ ,以及两侧的变量,左侧代表待计算聚合值的变量,右侧代表分组的依据变量。
- data 数据框
- FUN 指定函数,按~分组把FUN应用在~左侧变量
- ...FUN需要的其他参数
- subset 指定data的观测子集
- na.action 默认是忽略NA。如果不选择na.omit,则需指定函数去处理NA。
例子:
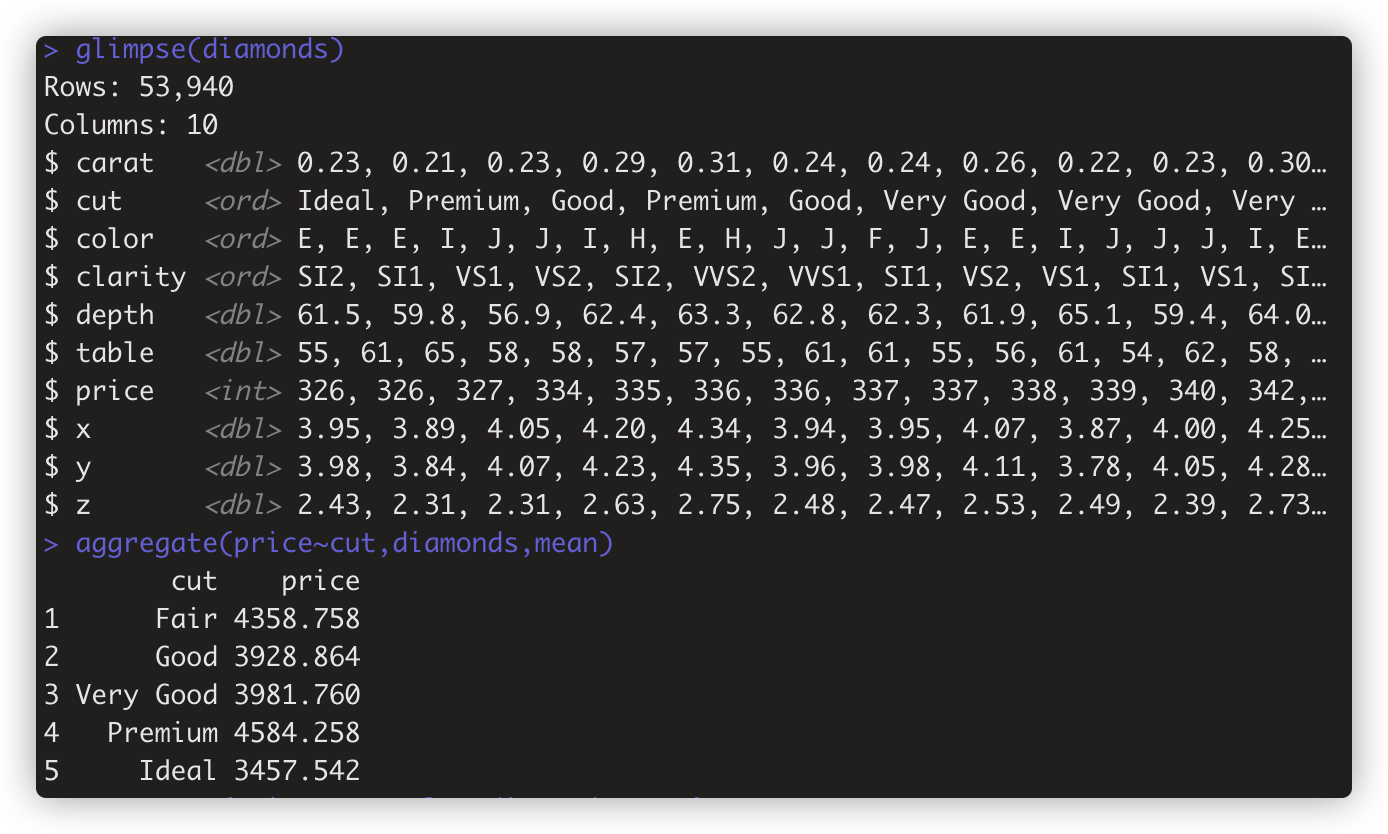
> aggregate(price~cut,diamonds,mean) #按cut分组,计算price在各组的平均值。
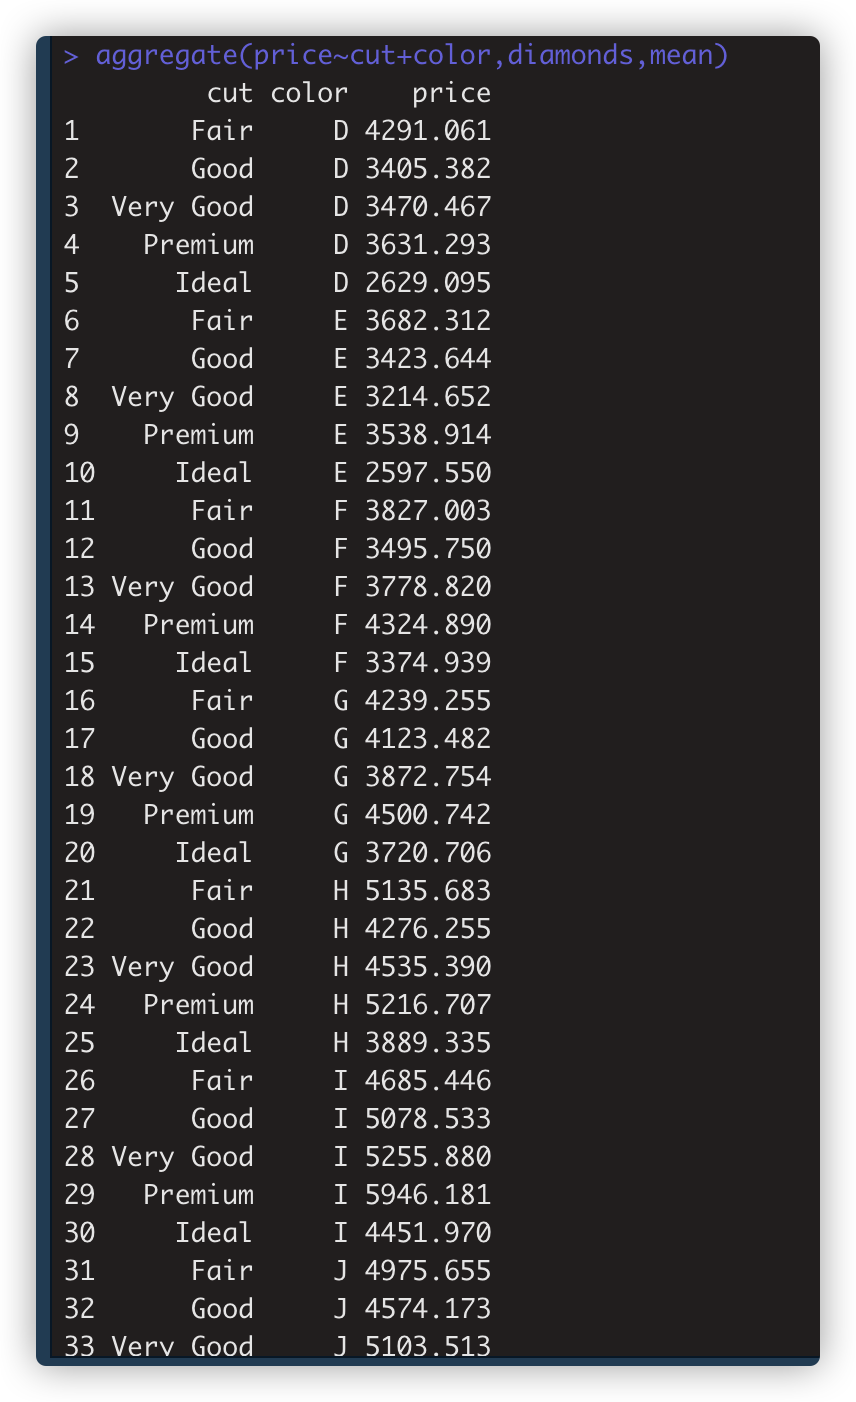
> aggregate(price~cut+color,diamonds,mean) #多个分组依据,用加号+隔离。类似group_by(a.b)
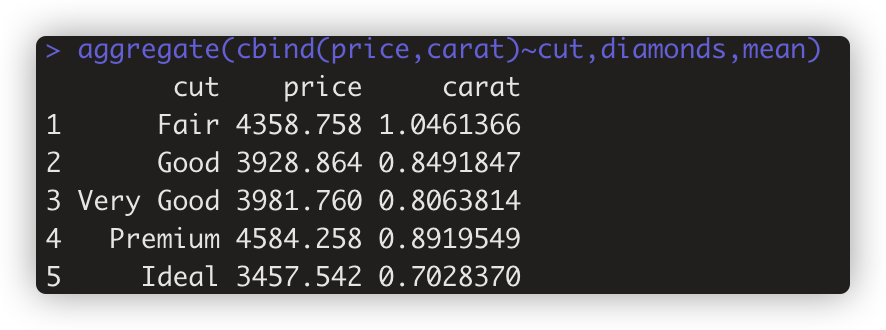
> aggregate(cbind(price,carat)~cut,diamonds,mean) #想按分组,计算多个变量。
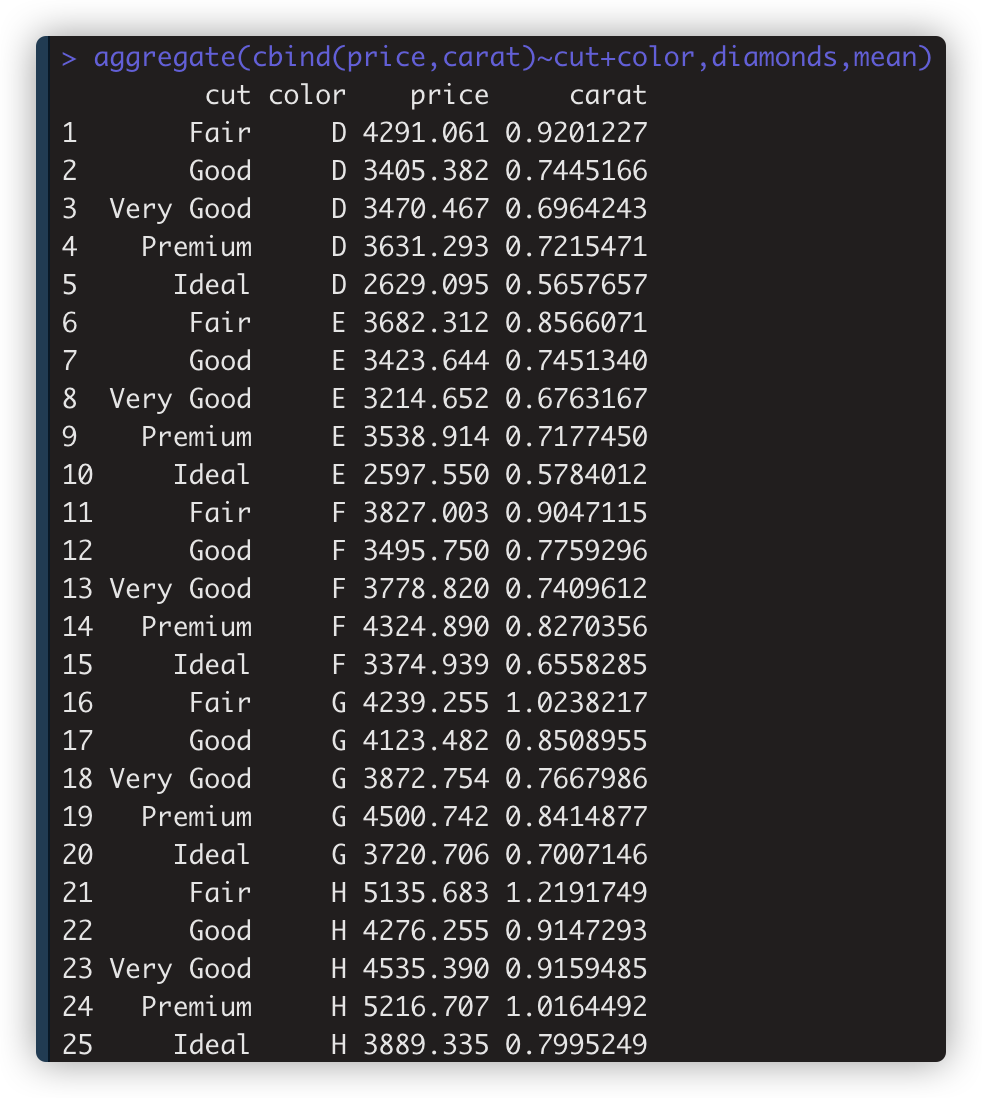
> aggregate(cbind(price,carat)~cut+color,diamonds,mean) #按多个分组变量计算各自组内的多个变量
本文来自博客园,作者:BioinformaticsMaster,转载请注明原文链接:https://www.cnblogs.com/koujiaodahan/p/15695396.html

posted on 2021-12-15 21:39 BioinformaticsMaster 阅读(903) 评论(0) 编辑 收藏 举报


【推荐】国内首个AI IDE,深度理解中文开发场景,立即下载体验Trae
【推荐】编程新体验,更懂你的AI,立即体验豆包MarsCode编程助手
【推荐】抖音旗下AI助手豆包,你的智能百科全书,全免费不限次数
【推荐】轻量又高性能的 SSH 工具 IShell:AI 加持,快人一步
· 基于Microsoft.Extensions.AI核心库实现RAG应用
· Linux系列:如何用heaptrack跟踪.NET程序的非托管内存泄露
· 开发者必知的日志记录最佳实践
· SQL Server 2025 AI相关能力初探
· Linux系列:如何用 C#调用 C方法造成内存泄露
· 震惊!C++程序真的从main开始吗?99%的程序员都答错了
· 【硬核科普】Trae如何「偷看」你的代码?零基础破解AI编程运行原理
· 单元测试从入门到精通
· 上周热点回顾(3.3-3.9)
· winform 绘制太阳,地球,月球 运作规律