
K8S 搭建 Prometheus (二) 安装 Grafana 和 kube-state-metrics
Grafana 安装和配置
mkdir -p /data/yaml/monitor-sa/grafana
cd /data/yaml/monitor-sa/grafana

cat grafana-deploy.yaml
apiVersion: apps/v1
kind: Deployment
metadata:
  name: monitoring-grafana
  namespace: monitor-sa
spec:
  replicas: 1
  selector:
    matchLabels:
      task: monitoring
      k8s-app: grafana
  template:
    metadata:
      labels:
        task: monitoring
        k8s-app: grafana
    spec:
      nodeName: k8s-node2
      securityContext:
        fsGroup: 104                  # 设置允许访问某些Volume的Group ID范围,可以将rule字段设置为ManyRunAs、MayRunAs、RunAsAny
        supplementalGroups:           # supplementalGroups:允许容器使用的其他用户组ID
        - 107
      containers:
      - name: grafana
        image: grafana/grafana:5.0.4
        ports:
        - containerPort: 3000
          protocol: TCP
        volumeMounts:
        - mountPath: /var/lib/grafana
          name: grafana-storage
      volumes:
      - name: grafana-storage
        hostPath:
           path: /data/grafana-data
           type: DirectoryOrCreate

kubectl apply -f grafana-deploy.yaml


cat grafana-svc.yaml
---
apiVersion: v1
kind: Service
metadata:
  labels:
    # For use as a Cluster add-on (https://github.com/kubernetes/kubernetes/tree/master/cluster/addons)
    # If you are NOT using this as an addon, you should comment out this line.
    kubernetes.io/cluster-service: 'true'
    kubernetes.io/name: monitoring-grafana
  name: monitoring-grafana
  namespace: monitor-sa
spec:
  # In a production setup, we recommend accessing Grafana through an external Loadbalancer
  # or through a public IP.
  # type: LoadBalancer
  # You could also use NodePort to expose the service at a randomly-generated port
  # type: NodePort
  ports:
  - port: 80
    targetPort: 3000
    nodePort: 30080
  selector:
    k8s-app: grafana
  type: NodePort


kubectl apply -f grafana-svc.yaml
配置grafana界面:
访问 http://192.168.1.111:30080/,开始配置grafana的web界面:
选择 "Create your first data source"
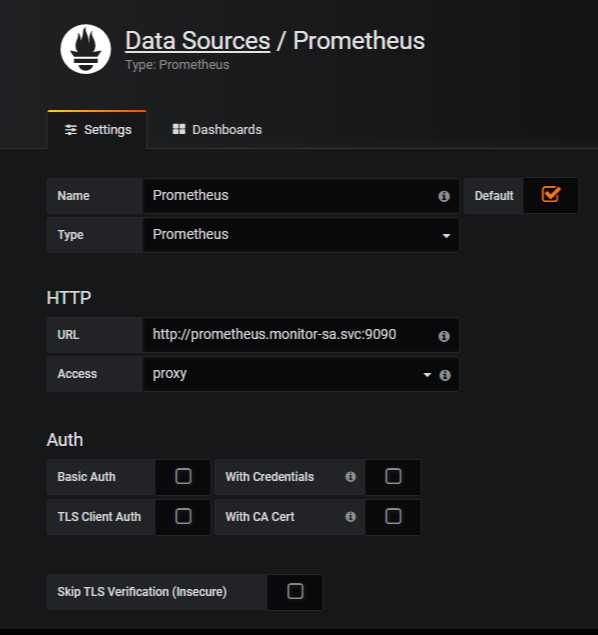
Name: Prometheus
Type: Prometheus
HTTP 处的URL写 如下:
http://prometheus.monitor-sa.svc:9090
安装 kube-state-metrics 组件
mkdir /data/yaml/monitor-sa/kube-state-metrics
cd /data/yaml/monitor-sa/kube-state-metrics/

cat kube-state-metrics-rbac.yaml
---
apiVersion: v1
kind: ServiceAccount
metadata:
  name: kube-state-metrics
  namespace: monitor-sa
---
apiVersion: rbac.authorization.k8s.io/v1
kind: ClusterRole
metadata:
  name: kube-state-metrics
rules:
- apiGroups: [""]
  resources: ["nodes", "pods", "services", "resourcequotas", "replicationcontrollers", "limitranges", "persistentvolumeclaims", "persistentvolumes", "namespaces", "endpoints"]
  verbs: ["list", "watch"]
- apiGroups: ["extensions"]
  resources: ["daemonsets", "deployments", "replicasets"]
  verbs: ["list", "watch"]
- apiGroups: ["apps"]
  resources: ["statefulsets"]
  verbs: ["list", "watch"]
- apiGroups: ["batch"]
  resources: ["cronjobs", "jobs"]
  verbs: ["list", "watch"]
- apiGroups: ["autoscaling"]
  resources: ["horizontalpodautoscalers"]
  verbs: ["list", "watch"]
---
apiVersion: rbac.authorization.k8s.io/v1
kind: ClusterRoleBinding
metadata:
  name: kube-state-metrics
roleRef:
  apiGroup: rbac.authorization.k8s.io
  kind: ClusterRole
  name: kube-state-metrics
subjects:
- kind: ServiceAccount
  name: kube-state-metrics
  namespace: monitor-sa

kubectl apply -f kube-state-metrics-rbac.yaml


cat kube-state-metrics-deploy.yaml
apiVersion: apps/v1
kind: Deployment
metadata:
  name: kube-state-metrics
  namespace: monitor-sa
spec:
  replicas: 1
  selector:
    matchLabels:
      app: kube-state-metrics
  template:
    metadata:
      labels:
        app: kube-state-metrics
    spec:
      serviceAccountName: kube-state-metrics
      containers:
      - name: kube-state-metrics
        image: harbor.junengcloud.com/monitor/kube-state-metrics:v1.9.0
        ports:
        - containerPort: 8080

kubectl apply -f kube-state-metrics-deploy.yaml

cat kube-state-metrics-svc.yaml
apiVersion: v1
kind: Service
metadata:
  annotations:
    prometheus.io/scrape: 'true'
  name: kube-state-metrics
  namespace: monitor-sa
  labels:
    app: kube-state-metrics
spec:
  ports:
  - name: kube-state-metrics
    port: 8080
    protocol: TCP
  selector:
    app: kube-state-metrics

kubectl apply -f kube-state-metrics-svc.yaml
在 grafana web界面导入Kubernetes Cluster (Prometheus)-1577674936972.json 和 Kubernetes cluster monitoring (via Prometheus) (k8s 1.16)-1577691996738.json

 浙公网安备 33010602011771号