1-出口数据的平稳性分析
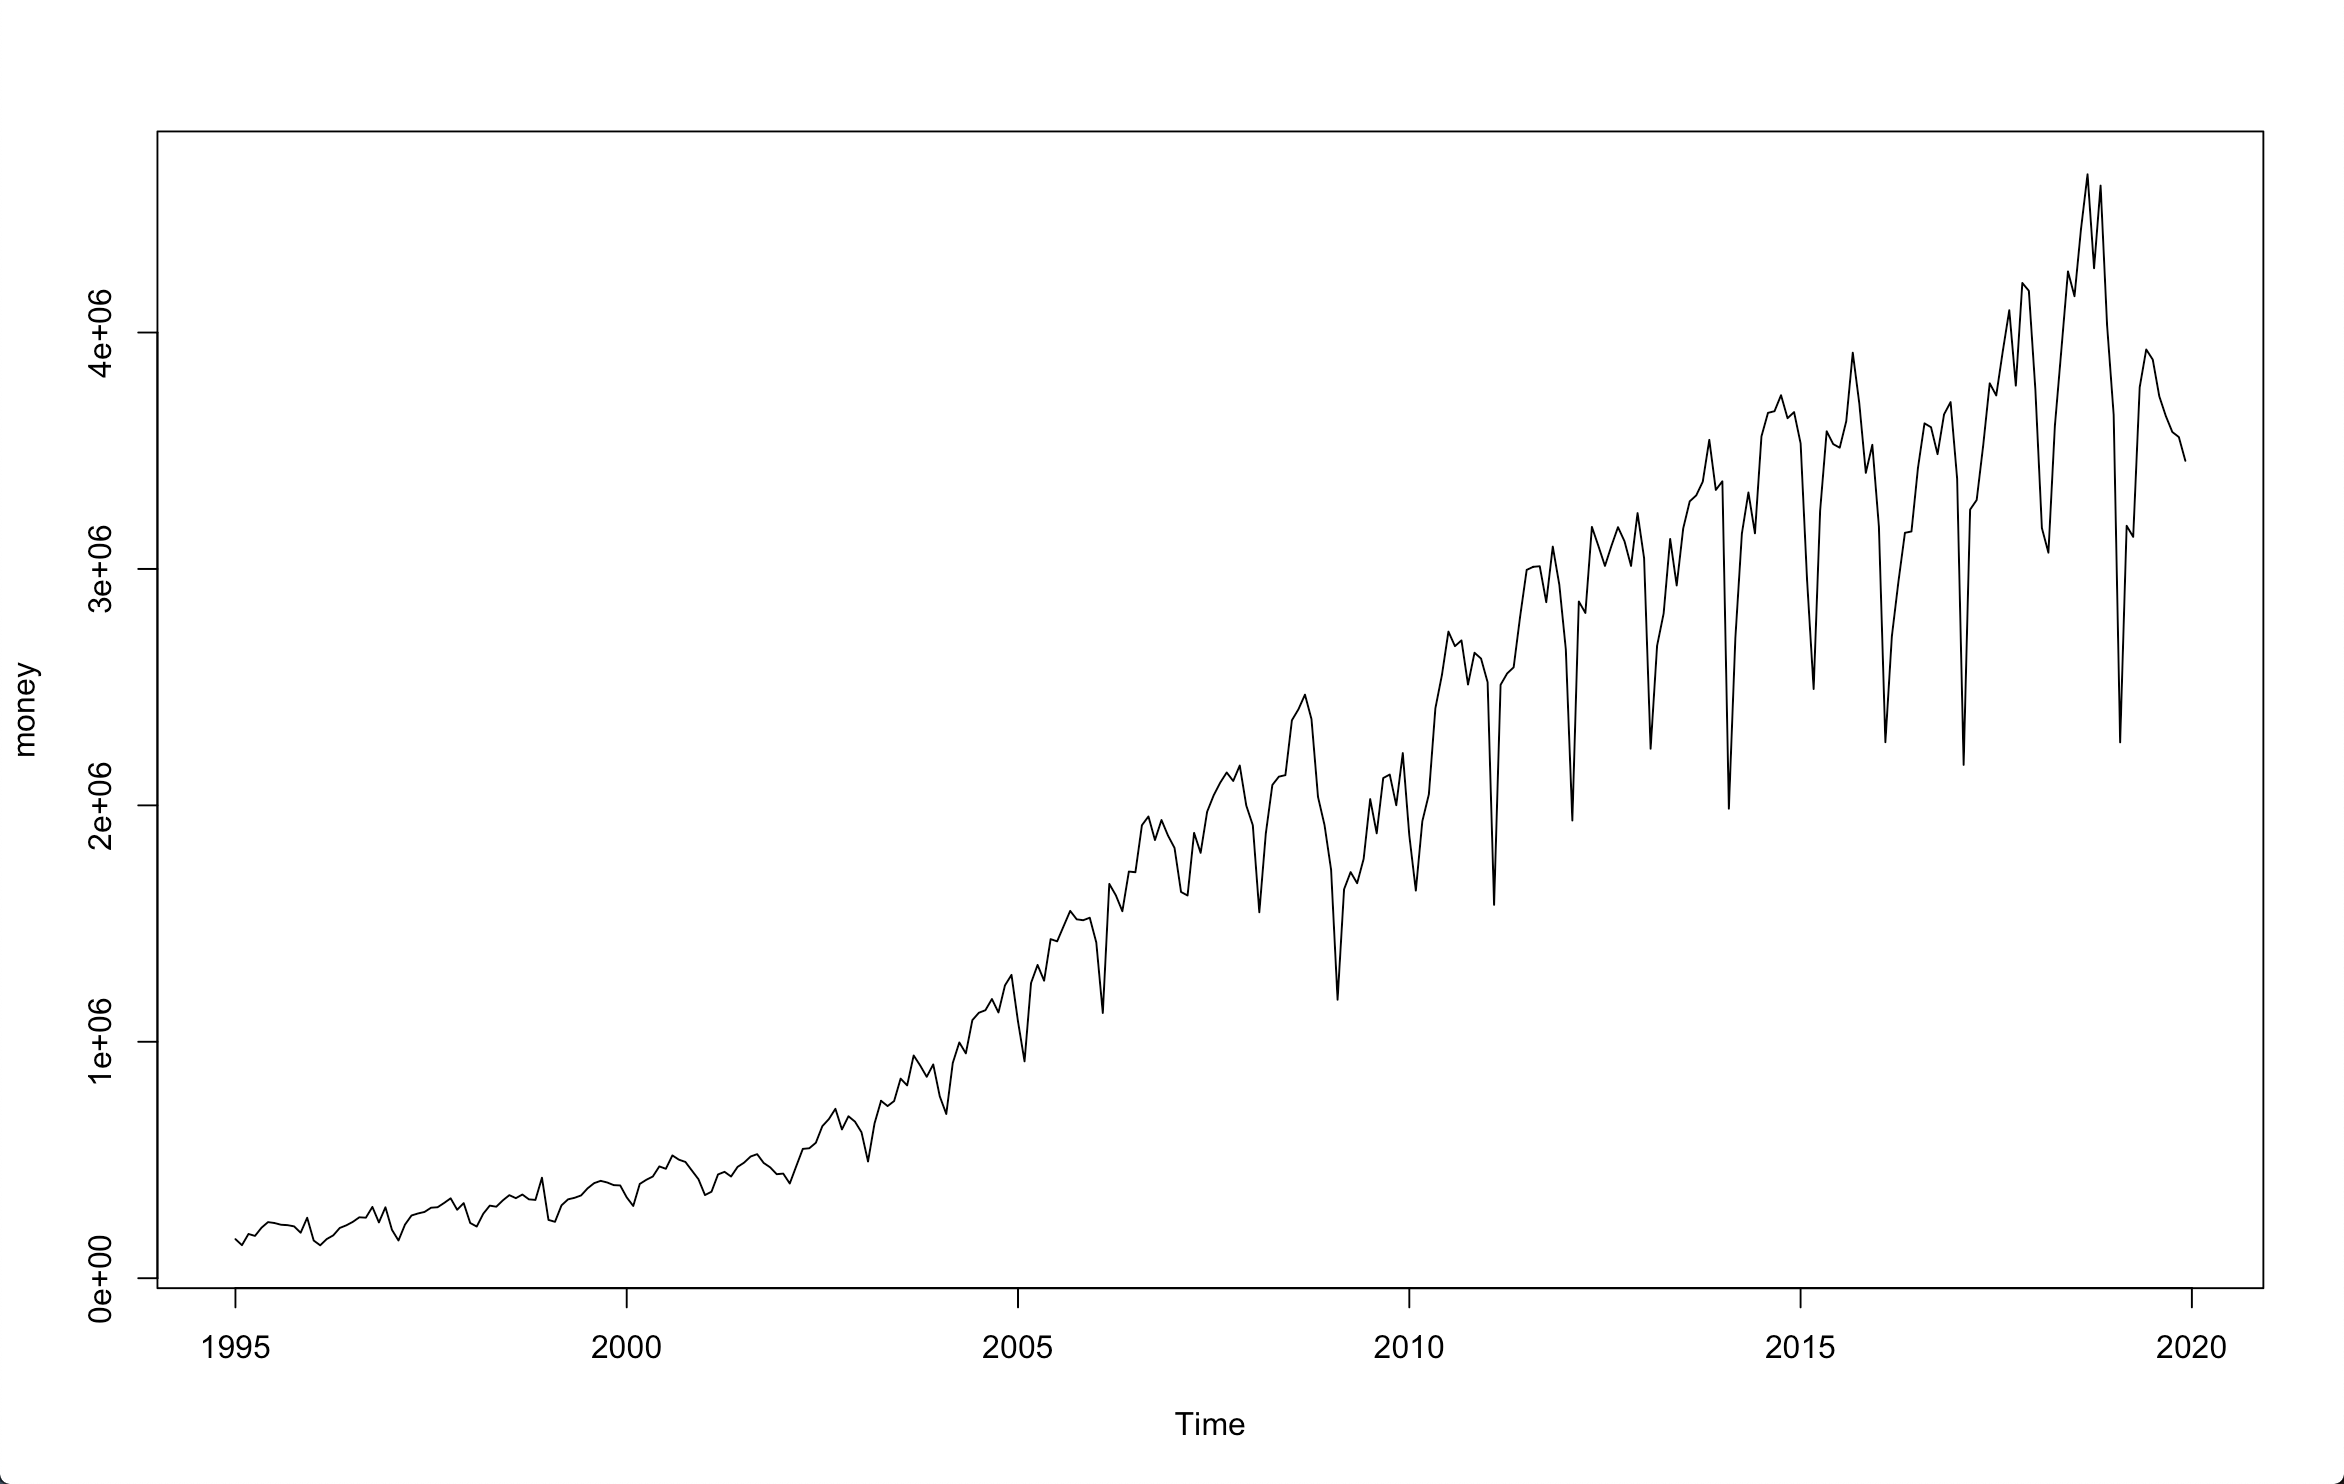
首先根据时序图判断

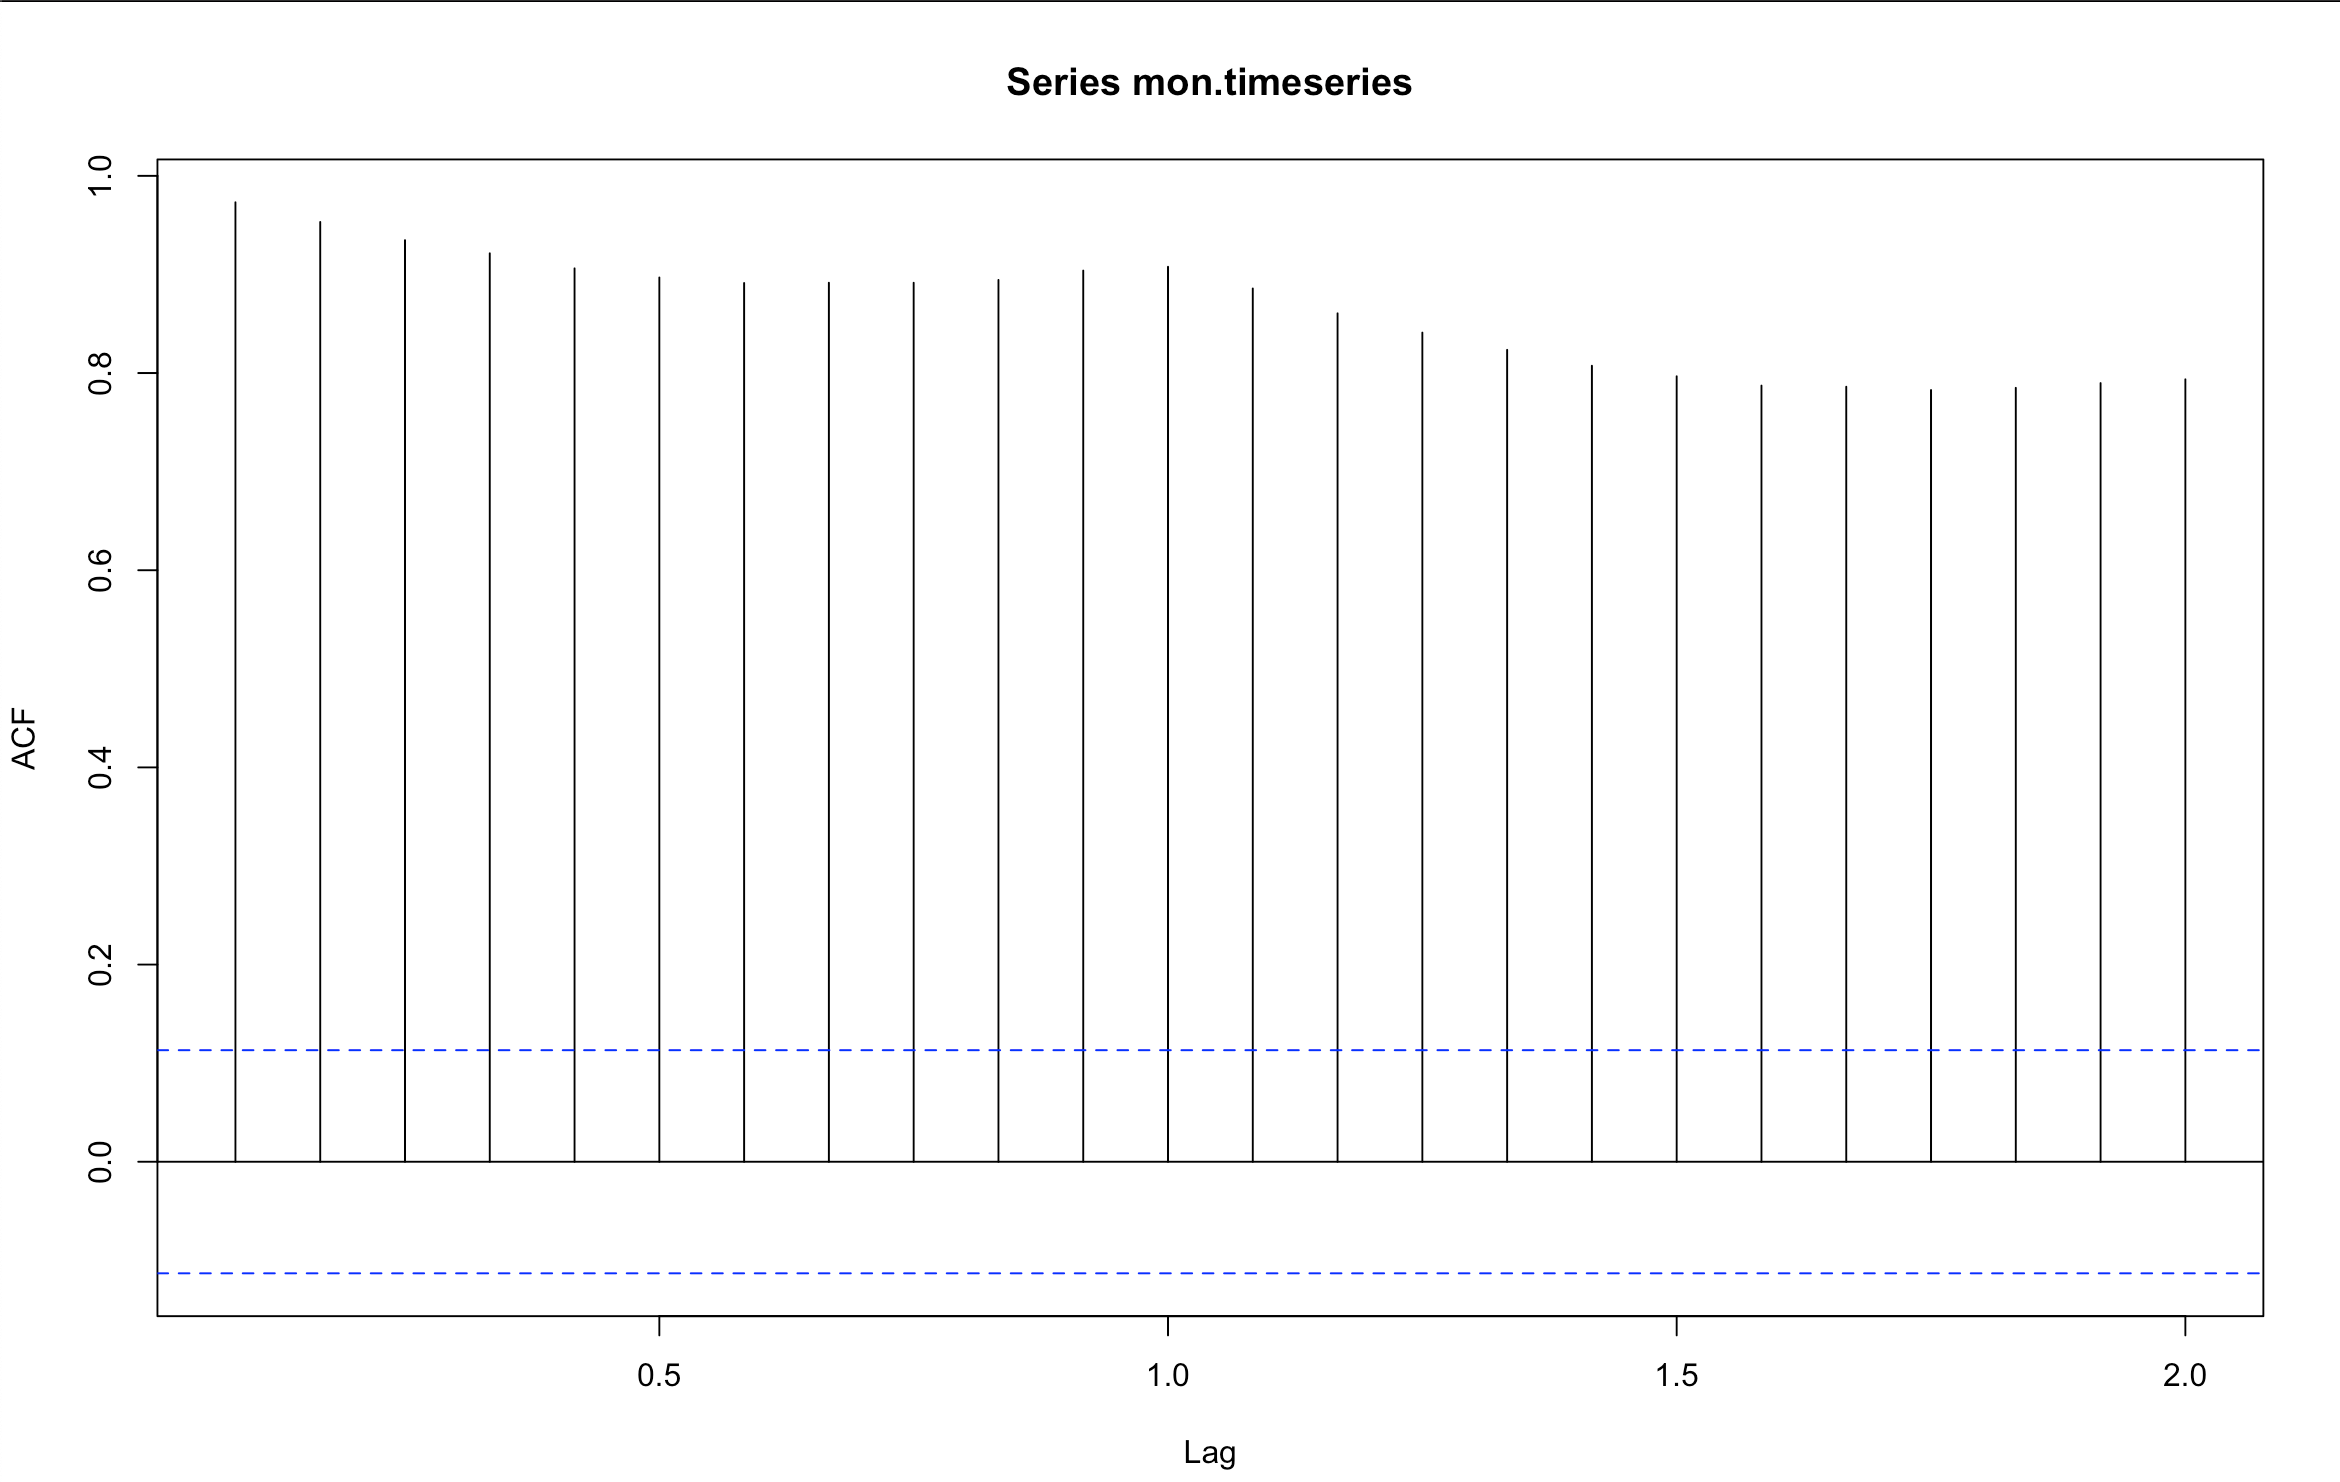
序列呈增长趋势和周期趋势,所以初步判定为非平稳序列
自相关图

进行ADF单位根检验
R语言adfTest函数中对序列三种假设进行检验
nc 无常数均值,无趋势类型
c 有常数均值,无趋势类型
ct 有常数均值,有趋势类型
library(readxl)
library(TSA)
library(fUnitRoots)
library(fBasics)
library(tseries)
# 导入数据
xlsx_1<-read_excel("~/Desktop/graduation design/WIND/export for USA.xlsx",
                   sheet = "Sheet2")
# 提取数据
mon <- xlsx_1[,2]

# 构建时间序列
mon.timeseries <- ts(mon,start = c(1995,1),end = c(2019,12),frequency = 12)
# 画出时序图和自相关图
plot(mon.timeseries)
acf(mon.timeseries)

# 对时间序列进行DF检验
print(adfTest(mon.timeseries,lags = 1,type = "c"))
print(adfTest(mon.timeseries,lags = 1,type = "nc"))
print(adfTest(mon.timeseries,lags = 1,type = "ct"))


Title:
 Augmented Dickey-Fuller Test

Test Results:
  PARAMETER:
    Lag Order: 1
  STATISTIC:
    Dickey-Fuller: -1.5387
  P VALUE:
    0.4841

Description:
 Mon Mar 30 21:47:39 2020 by user:


Title:
 Augmented Dickey-Fuller Test

Test Results:
  PARAMETER:
    Lag Order: 1
  STATISTIC:
    Dickey-Fuller: -0.2097
  P VALUE:
    0.5495

Description:
 Mon Mar 30 21:47:39 2020 by user:


Title:
 Augmented Dickey-Fuller Test

Test Results:
  PARAMETER:
    Lag Order: 1
  STATISTIC:
    Dickey-Fuller: -6.2865
  P VALUE:
    0.01

Description:
 Mon Mar 30 21:47:39 2020 by user:

Warning message:
In adfTest(mon.timeseries, lags = 1, type = "ct") :
  p-value smaller than printed p-value
根据p值,可以判断接受原假设,即非平稳
人前一杯酒,各自饮完;人后一片海,独自上岸


