
KingbaseES 并行查询
背景:随着硬件技术的提升,磁盘的IO能力及CPU的运算能力都得到了极大的增强,如何充分利用硬件资源为运算加速,是数据库设计过程中必须考虑的问题。数据库是IO和CPU密集型的软件,大规模的数据访问需要大量的IO,大数据量的连接操作需要大量的CPU运算。并行查询可以通过在数据的读和计算上,通过把Join、聚合、排序等操作分解成多个子任务实现并行。
一、并行查询功能
在讲述并行前,我们先来看个并行的执行计划:本例启动了4个worker,加上gather,共5个worker。
test=# explain analyze select max(id) from test;
                                                                QUERY PLAN
-------------------------------------------------------------------------------------------------------------------------------------------
 Finalize Aggregate  (cost=95945.78..95945.79 rows=1 width=4) (actual time=573.226..574.809 rows=1 loops=1)
   ->  Gather  (cost=95945.36..95945.77 rows=4 width=4) (actual time=567.567..574.794 rows=5 loops=1)
         Workers Planned: 4
         Workers Launched: 4
         ->  Partial Aggregate  (cost=94945.36..94945.37 rows=1 width=4) (actual time=558.113..558.113 rows=1 loops=5)
               ->  Parallel Seq Scan on test  (cost=0.00..88695.29 rows=2500029 width=4) (actual time=0.069..317.337 rows=2000000 loops=5)
 Planning Time: 0.059 ms
 Execution Time: 574.839 ms
(8 rows)
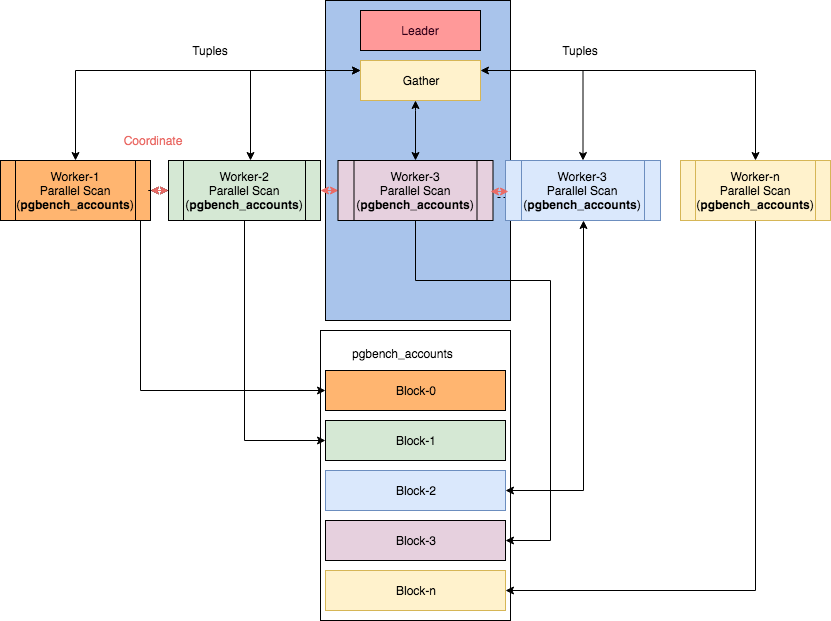
KingbaseES 的并行化包含三个重要组件:进程本身(leader进程)、gather、workers。查询执行是从leader进程开始。一旦开启了并行,就会分配一个gather节点和多个worker线程。relation blocks在各个workers线程之间划分。workers的数量受KingbaseES 的配置参数或对象参数控制。每个进程在内部称之为1个worker,这些worker可以动态地创建、销毁。
当用户输入一个查询语句时,查询分析、查询重写以及查询规划都和原来一样,只有到执行时,才开始真正进入并行查询环节。Gather 节点只是执行计划的一个子节点,属于执行计划的一部分,当查询执行走到Gather 节点时,会话进程会申请一定数量的worker 进程(根据配置参数,以及执行计划COST确定)来进行并行查询过程。Gather 进程充当leader worker 的角色,负责收集汇总各个worker 进程查询的结果。该leader worker 进程也会根据查询的数据量大小承担部分的并行查询部分。
Leader worker 进程和其他worker 进程通过动态共享内存进行通信,在每个worker初始化时就为每个worker分配共享内存,用于worker各自获取计划数据和缓存中间结果。其他worker 进程(包括leader worker 进程)把分担查询的结果存储到共享内存中,然后由leader worker 进程进行汇总整个查询的结果。所以需要注意的是,由于并行查询需要使用了动态共享内存,所以dynamic_shared_memory_type 参数需要设置为none 以外的值。下图截取自网络:
二、优化器与并行
查询优化器会根据表或索引大小减少或增加工作线程的数量,min_parallel_table_scan_size 和 min_parallel_index_scan_size 控制此行为。每当表比 min_parallel_(index|table)_scan_size 大 3 倍时,KingbaseES就会添加一个工作线程。Worker的数量不是基于成本的,相反,优化器使用简单的规则,这些规则在生产中可以调整的,可以使用 ALTER TABLE ... SET (parallel_workers = N) 修改特定表的Worker数量。
与worker 数量基于简单规则不同,优化器会基于cost,确认是否使用并行:
- parallel_setup_cost, 该参数可以避免并行执行短查询。它对内存设置、进程启动和初始通信所花费的时间进行建模。
- parallel_tuple_cost , leader 和 worker 之间的通信可能需要很长时间,时间与worker发送的元组数量成正比。该参数对通信成本进行建模。
三、并行相关参数
- max_parallel_workers_per_gather 定义了每个并发操作可以使用的 worker的最大数量。该参数为0表示不使用并行。
- max_parallel_workers 定义并行池中所有 worker的数量,也就是整个实例最大并行进程数量。不能大于参数 max_worker_processes 值。
- max_worker_processes 定义了后台worker进程的总数量。
- min_parallel_table_scan_size 表的存储空间至少大于等于该值,才有可能触发并行,默认值8MB。
- min_parallel_index_scan_size 索引存储空间至少大于等于该数值,才有可能触发并行。默认256 KB。
- force_parallel_mode:强制开启并行模式的开关
- dynamic_shared_memory_type 必须被设置为除none之外的值。并行查询要求动态共享内存以便在合作的进程之间传递数据。
- parallel_setup_cost :以避免并行执行短查询。它对内存设置、进程启动和初始通信所花费的时间进行建模
- parallel_tuple_cost :leader 和 worker 之间的通信可能需要很长时间。时间与工作人员发送的元组数量成正比。该参数对通信成本进行建模。
四、KingbaseES 支持的主要并行操作
1、并行顺序扫描
顺序扫描是在表上进行的扫描,在该表中一个接一个的块顺序地被评估。顺序扫描允许并行化,这样,整个表将在多个workers线程之间顺序扫描。
test=# explain analyze select * from test where id>9999000;
                                                        QUERY PLAN
--------------------------------------------------------------------------------------------------------------------------
 Gather  (cost=1000.00..96045.36 rows=1000 width=19) (actual time=320.617..329.582 rows=1000 loops=1)
   Workers Planned: 4
   Workers Launched: 4
   ->  Parallel Seq Scan on test  (cost=0.00..94945.36 rows=250 width=19) (actual time=304.470..304.544 rows=200 loops=5)
         Filter: (id > 9999000)
         Rows Removed by Filter: 1999800
 Planning Time: 0.091 ms
 Execution Time: 329.732 ms
(8 rows)

test=# set max_parallel_workers_per_gather=0;    --关闭并行
SET
test=# explain analyze select * from test where id>9999000;
                                                  QUERY PLAN
--------------------------------------------------------------------------------------------------------------
 Seq Scan on test  (cost=0.00..188696.44 rows=1000 width=19) (actual time=871.033..871.126 rows=1000 loops=1)
   Filter: (id > 9999000)
   Rows Removed by Filter: 9999000
 Planning Time: 0.075 ms
 Execution Time: 871.168 ms
(5 rows)
以上例子从1000万条数据中返回1000条,使用并行相比于不使用并行,效率得到了很大提升。
注意:如果顺序扫描结果返回了大量的行,并行扫描的效率可能更低。请看以下例子:
test=# explain analyze select * from test where id>1000000;
                                                     QUERY PLAN
--------------------------------------------------------------------------------------------------------------------
 Seq Scan on test  (cost=0.00..188696.44 rows=8991074 width=19) (actual time=91.963..1173.468 rows=9000000 loops=1)
   Filter: (id > 1000000)
   Rows Removed by Filter: 1000000
 Planning Time: 0.055 ms
 Execution Time: 1452.951 ms
(5 rows)

test=# set force_parallel_mode=on;   --强制使用并行
SET
test=# explain analyze select * from test where id>1000000;
                                                        QUERY PLAN
--------------------------------------------------------------------------------------------------------------------------
 Gather  (cost=1000.00..1088803.84 rows=8991074 width=19) (actual time=97.620..4899.234 rows=9000000 loops=1)
   Workers Planned: 1
   Workers Launched: 1
   Single Copy: true
   ->  Seq Scan on test  (cost=0.00..188696.44 rows=8991074 width=19) (actual time=91.083..1803.754 rows=9000000 loops=1)
         Filter: (id > 1000000)
         Rows Removed by Filter: 1000000
 Planning Time: 0.046 ms
 Execution Time: 5578.338 ms
(9 rows)
以上例子由于返回了90%的,强制开启并行后,执行效率更低了。
2、并行聚合
KingbaseES 通过两个阶段的聚合来支持并行聚合。
- 每个参与查询计划 worker 执行一个聚合步骤, 为自身所负责的分组产生一个部分结果。这在计划中反映为一个 PartialAggregate节点。
- 部分结果被通过Gather 节点传输给 leader。最后, 领导者对所有 worker 的部分结果进行重聚合以得到最终的结果。 这在计划中反映为一个FinalizeAggregate节点。
具体见以下执行计划:
test=# explain analyze select max(id1) from t1 where id1>100000;
                                                                QUERY PLAN
------------------------------------------------------------------------------------------------------------------------------------------
 Finalize Aggregate  (cost=117450.53..117450.54 rows=1 width=4) (actual time=805.452..809.364 rows=1 loops=1)
   ->  Gather  (cost=117450.31..117450.52 rows=2 width=4) (actual time=805.337..809.355 rows=3 loops=1)
         Workers Planned: 2
         Workers Launched: 2
         ->  Partial Aggregate  (cost=116450.31..116450.32 rows=1 width=4) (actual time=799.425..799.425 rows=1 loops=3)
               ->  Parallel Seq Scan on t1  (cost=0.00..106139.24 rows=4124427 width=4) (actual time=5.677..543.455 rows=3300000 loops=3)
                     Filter: (id1 > 100000)
                     Rows Removed by Filter: 33333
 Planning Time: 0.115 ms
 Execution Time: 809.518 ms
(10 rows)
3、并行hashjoin
test=# explain analyze select count(*) from t1,t2 where id1=id2;
                                                                  QUERY PLAN
-----------------------------------------------------------------------------------------------------------------------------------------------
 Finalize Aggregate  (cost=113042.81..113042.82 rows=1 width=8) (actual time=1073.606..1075.476 rows=1 loops=1)
   ->  Gather  (cost=113042.59..113042.80 rows=2 width=8) (actual time=1073.235..1075.466 rows=3 loops=1)
         Workers Planned: 2
         Workers Launched: 2
         ->  Partial Aggregate  (cost=112042.59..112042.60 rows=1 width=8) (actual time=1066.525..1066.532 rows=1 loops=3)
               ->  Hash Join  (cost=584.79..112020.57 rows=8811 width=0) (actual time=7.975..1066.007 rows=6667 loops=3)
                     Hash Cond: (t1.id1 = t2.id2)
                     ->  Parallel Seq Scan on t1  (cost=0.00..95722.40 rows=4166740 width=4) (actual time=0.036..422.131 rows=3333333 loops=3)
                     ->  Hash  (cost=320.46..320.46 rows=21146 width=4) (actual time=7.622..7.623 rows=20000 loops=3)
                           Buckets: 32768  Batches: 1  Memory Usage: 960kB
                           ->  Seq Scan on t2  (cost=0.00..320.46 rows=21146 width=4) (actual time=0.029..3.258 rows=20000 loops=3)
 Planning Time: 0.140 ms
 Execution Time: 1075.664 ms
执行计划里可以看到,在做并行查询时,额外创建了2个worker进程,加上原来的gather进程,总共3个进程。Join的外表(t1)数据被平均分配了3份,通过并行scan分散了I/O操作,之后跟hash表数据分别做Join。这里需要注意的是hash表对于每个worker都是完整的一份数据,需要扫描t2 表3次(loops=3)。
以上例子中,hash table由于比较小,并没有采取并行扫描。如果hash table比较大,也可能采用并行hash操作。如下例:
test=# explain analyze select count(*) from t1,t2 where id1=id2;
                                                                   QUERY PLAN
------------------------------------------------------------------------------------------------------------------------------------------------
 Finalize Aggregate  (cost=116941.21..116941.22 rows=1 width=8) (actual time=1535.865..1537.732 rows=1 loops=1)
   ->  Gather  (cost=116941.00..116941.21 rows=2 width=8) (actual time=1534.903..1537.723 rows=3 loops=1)
         Workers Planned: 2
         Workers Launched: 2
         ->  Partial Aggregate  (cost=115941.00..115941.01 rows=1 width=8) (actual time=1528.120..1528.122 rows=1 loops=3)
               ->  Parallel Hash Join  (cost=3860.19..115722.34 rows=87462 width=0) (actual time=29.306..1523.523 rows=66667 loops=3)
                     Hash Cond: (t1.id1 = t2.id2)
                     ->  Parallel Seq Scan on t1  (cost=0.00..95722.40 rows=4166740 width=4) (actual time=0.089..447.474 rows=3333333 loops=3)
                     ->  Parallel Hash  (cost=2316.75..2316.75 rows=123475 width=4) (actual time=28.407..28.407 rows=66667 loops=3)
                           Buckets: 262144  Batches: 1  Memory Usage: 9920kB
                           ->  Parallel Seq Scan on t2  (cost=0.00..2316.75 rows=123475 width=4) (actual time=0.031..10.664 rows=66667 loops=3)
 Planning Time: 0.183 ms
 Execution Time: 1537.846 ms
(13 rows)
4、并行nestloop
test=# explain analyze select count(*) from t1,t2 where id1=id2;
                                                                    QUERY PLAN
---------------------------------------------------------------------------------------------------------------------------------------------------
 Finalize Aggregate  (cost=1409318.65..1409318.66 rows=1 width=8) (actual time=5809.673..5811.717 rows=1 loops=1)
   ->  Gather  (cost=1409318.44..1409318.65 rows=2 width=8) (actual time=5809.422..5811.701 rows=3 loops=1)
         Workers Planned: 2
         Workers Launched: 2
         ->  Partial Aggregate  (cost=1408318.44..1408318.45 rows=1 width=8) (actual time=5803.356..5803.357 rows=1 loops=3)
               ->  Nested Loop  (cost=0.29..1408297.60 rows=8333 width=0) (actual time=0.229..5802.704 rows=6667 loops=3)
                     ->  Parallel Seq Scan on t1  (cost=0.00..95721.08 rows=4166608 width=4) (actual time=0.099..471.209 rows=3333333 loops=3)
                     ->  Index Only Scan using ind_t2_id2 on t2  (cost=0.29..0.31 rows=1 width=4) (actual time=0.001..0.001 rows=0 loops=10000000)
                           Index Cond: (id2 = t1.id1)
                           Heap Fetches: 0
outer table 分为3份,每份与inner table(没有也不能进行分片)进行独立的连接,最后合并结果。
5、并行mergejoin
test=# explain analyze select count(*) from t1,t2 where id1=id2;
                                                                     QUERY PLAN
-----------------------------------------------------------------------------------------------------------------------------------------------------
 Finalize Aggregate  (cost=670764.90..670764.91 rows=1 width=8) (actual time=9288.707..9288.805 rows=1 loops=1)
   ->  Gather  (cost=670764.69..670764.90 rows=2 width=8) (actual time=9288.697..9288.800 rows=3 loops=1)
         Workers Planned: 2
         Workers Launched: 2
         ->  Partial Aggregate  (cost=669764.69..669764.70 rows=1 width=8) (actual time=8319.546..8319.547 rows=1 loops=3)
               ->  Merge Join  (cost=669520.85..669743.86 rows=8333 width=0) (actual time=8292.466..8319.171 rows=6667 loops=3)
                     Merge Cond: (t1.id1 = t2.id2)
                     ->  Sort  (cost=667780.84..678197.36 rows=4166608 width=4) (actual time=8281.889..8305.812 rows=6668 loops=3)
                           Sort Key: t1.id1
                           Sort Method: external merge  Disk: 51840kB
                           Worker 0:  Sort Method: external merge  Disk: 41408kB
                           Worker 1:  Sort Method: external merge  Disk: 43984kB
                           ->  Parallel Seq Scan on t1  (cost=0.00..95721.08 rows=4166608 width=4) (actual time=0.228..550.298 rows=3333333 loops=3)
                     ->  Sort  (cost=1737.77..1787.77 rows=20000 width=4) (actual time=8.703..9.907 rows=20000 loops=3)
                           Sort Key: t2.id2
                           Sort Method: quicksort  Memory: 1706kB
                           Worker 0:  Sort Method: quicksort  Memory: 1706kB
                           Worker 1:  Sort Method: quicksort  Memory: 1706kB
                           ->  Seq Scan on t2  (cost=0.00..309.00 rows=20000 width=4) (actual time=0.036..3.660 rows=20000 loops=3)
 Planning Time: 0.158 ms
 Execution Time: 9298.753 ms
t1 是大表,scan and sort 都采用了并行;t2 是小表,只有sort 操作采用并行。
6、并行append
test=# explain select * from t1 where id>9999000 union select * from t2 where id>9999900;
                                     QUERY PLAN
-------------------------------------------------------------------------------------
 HashAggregate  (cost=232797.86..232817.86 rows=2000 width=36)
   Group Key: t1.id, t1.data
   ->  Gather  (cost=1000.00..232787.86 rows=2000 width=36)
         Workers Planned: 2
         ->  Parallel Append  (cost=0.00..231587.86 rows=2000 width=36)
               ->  Parallel Seq Scan on t1  (cost=0.00..115778.93 rows=417 width=19)
                     Filter: (id > 9999000)
               ->  Parallel Seq Scan on t2  (cost=0.00..115778.93 rows=417 width=19)
                     Filter: (id > 9999900)
用于union all 的场景。
五、并行使用总结
KingbaseES 当前支持的并行场景主要是以下3种:
- parallel sequential scan
- parallel join
- parallel aggregation
- DDL :create index , create table as select
不支持:
- insert into xxx select ......
鉴于安全考虑,以下4种场景不支持并行:
- 公共表表达式(CTE)的扫描
- 临时表的扫描
- 外部表的扫描(除非外部数据包装器有一个IsForeignScanParallelSafeAPI)
- 对InitPlan或SubPlan的访问
使用并行查询,还有以下限制:
- 必须保证是严格的read only模式,不能改变database的状态
- 查询执行过程中,不能被挂起
- 隔离级别不能是SERIALIZABLE
- 不能调用PARALLEL UNSAFE函数

 浙公网安备 33010602011771号