折线图
实现步骤
1> ECharts 最基本的代码结构
<!DOCTYPE html>
<html lang="en">
<head>
    <meta charset="UTF-8">
    <meta http-equiv="X-UA-Compatible" content="IE=edge">
    <meta name="viewport" content="width=device-width, initial-scale=1.0">
    <title>Document</title>
    <script src="./lib/echarts.min.js"></script>
</head>
<body>
    <div style="width:600px;height:400px"></div>
    <script>
var box= echarts.init(document.querySelector("div"))
        var option={

            }
        box.setOption(option)
    </script>
</body>
</html>
2>准备 x 轴的数据
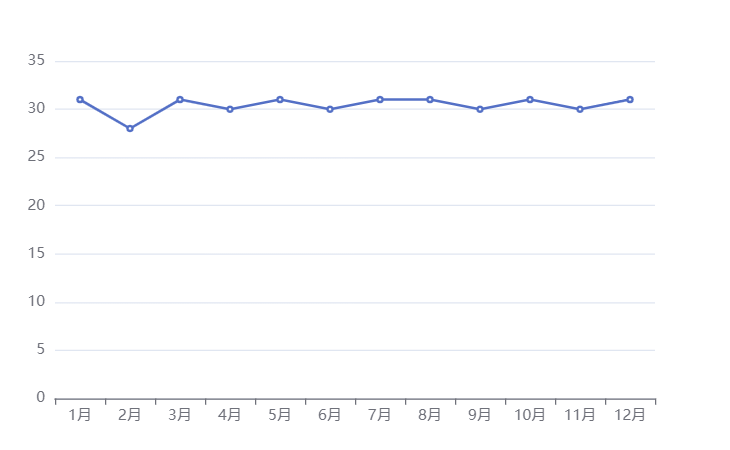
var xData = ['1月', '2月', '3月', '4月', '5月', '6月', '7月', '8月', '9月',
'10月', '11月', '12月']
3>准备 y 轴的数据
var yData = [31, 28, 31, 30, 31, 30, 31, 31, 30, 31, 30,
31]
4>准备 option , 将 series 中的 type 的值设置为: line
 var option={
            xAxis:{
                type:'category',
                data:xData
            },
            yAxis:{
                type:'value'
            },
            series:[
                {
                    type:'line',
                    data:yData
                }
            ]
        }