基于回归算法做销售预测
sklearn中很多回归方法,广义线性回归在linear_model库下,例如:线性回归、\(Lasso\)、岭回归等。
还有其他非线性回归方法,例如:\(SVM\)、集成方法、贝叶斯回归、\(K\) 近邻回归、决策树回归等。
如何在
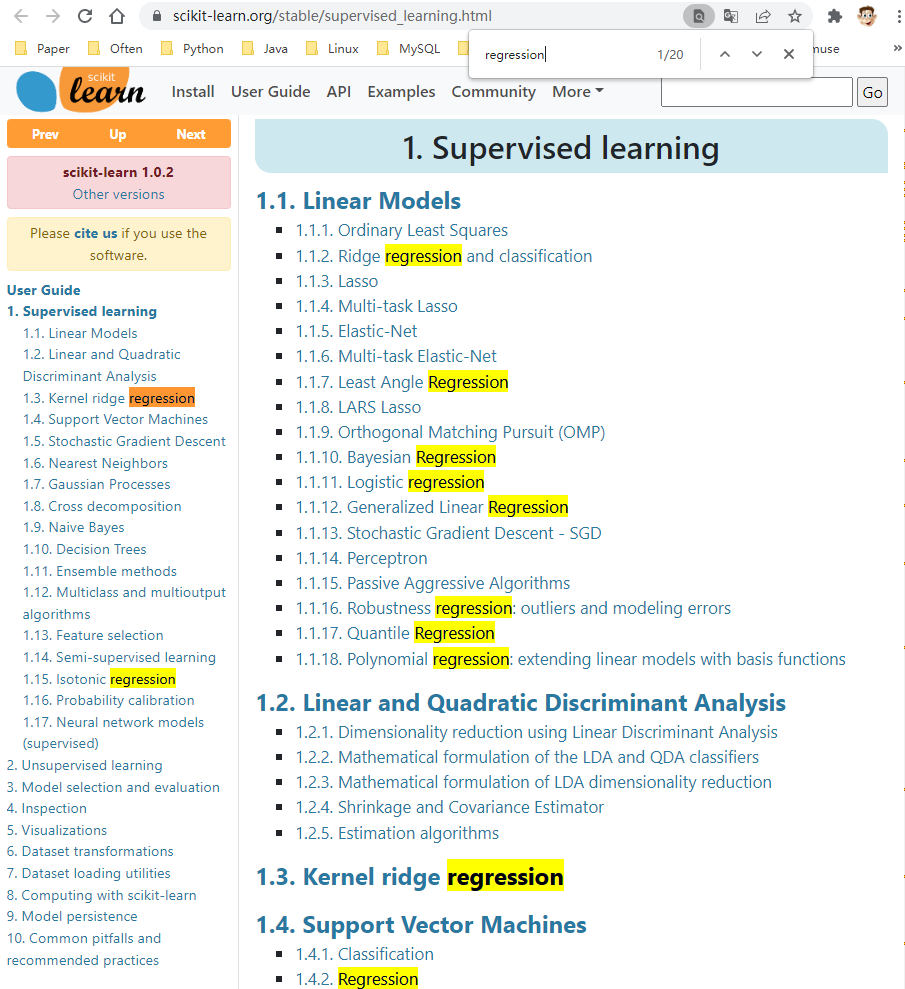
sklearn中找到所有回归算法?由于没有一个统一的回归库,无法直接从单一库导出所有回归算法。以下是找到所有回归算法的步骤:
① 在 \(Chrome\) 搜索 https://scikit-learn.org/stable/supervised_learning.html
② \(Ctrl+F\),在弹窗输入“ \(regression\)”,包含 \(regression\) 会高亮。
1. 回归自变量之间的共线性问题
应用回归模型时,注意自变量间的共线性问题。
2. 相关系数、判定系数、回归系数
回归方程 \(y = 42.738x + 169.94\),其中 \(R^2 = 0.5252\)。对 \(x,y\) 做相关性分析,得到相关系数 \(R = 0.7246855\)。\(42.738\) 是回归系数,\(0.5252\) 是判定系数(r2_ score),\(0.7246855\) 是相关系数。
回归系数:自变量 \(x\) 对因变量 \(y\) 影响的大小。
判定系数:回归平方和与总离差平方和的比值,直白点说就是自变量引起的变动占总变动的百分比,用来评估模型拟合的好坏。
相关系数:也称解释系数,衡量变量之间的相关程度。本质是线性相关性的判断。
三者的关系:
- 判定系数是所有自变量对因变量联合影响程度。而非某个自变量的影响程度。如果 \(x_1,x_2\) 两个自变量,那么 \(R^2\) 代表两个自变量共同影响的结果。如果线性回归只有一个自变量,那么判定系数等于相关系数的平方。
- 回归系数与相关系数的关系:回归系数 \(>0\),相关系数取值为 \((0,1)\),说明二者正相关;回归系数 \(<0\),相关系数取值为 \((-1,0)\),说明二者负相关。
判定系数的高低没有统一标准,值越高,代表自变量对因变量的解释作用越大。普通数据达到 \(0.6\) 已经很高,\(0.6\) 意味相关系数在 \(0.8\) 以上;而对于时间序列数据,判定系数达到 \(0.9\) 很平常。
3. 判定系数和因果关系
在相关性分析中提到相关系与因果不是一回事。判定系数不等于因果。
- 一元线性回归方程中,判定系数是相关系数的平方,既然相关系数不是因果,其平方也不是因果。
- 判定系数是自变量引起的变动占总变动的百分比。两者有相同的变动趋势,不意味有因果关系。
4. 回归算法的选择
按自变量个数分:一元回归、多元回归。
按是否线性分:线性回归、非线性回归。
回归算法的选择,参考因素:
- 入门——简单线性回归。适用于有线性关系的场景。
- 如果自变量少或降维后自变量少,可以通过散点图发现自变量和因变量的相互关系。然后选择最佳回归方法。
- 如果自变量间有较强的共线性关系,可以使用岭回归。
- 如果数据噪音较多,推荐使用主成分回归。因为主成分用于降维,可去掉噪音。另外,主成分间相互正交,解决共线性问题。
- 如果高维变量下,使用正则化回归。如:\(Lasso、Ridge、ElasticNet\)。
- 如果注重模型的可解释性,线性回归、对数回归、多项式回归比核回归、支持向量机回归更适合。
- 如果确认了几个方法,但不知道如何取舍,使用集成或组合回归方法。
如果验证多个算法,从中选择一个最好的来拟合,可使用交叉检验做多个模型的效果对比,并通过 \(R-square、Adjusted\ R-square、AIC、BIC\) 指标来评估。
案例:大型促销活动前的销售预测
数据:\(506\) 条,\(13\) 个特征。
import numpy as np
import pandas as pd
from sklearn.linear_model import BayesianRidge, LinearRegression, ElasticNet    # 回归算法:贝叶斯回归、线性回归、弹性网络回归
from sklearn.svm import SVR                             # SVM中的回归算法
from xgboost import XGBRegressor                        # XGBoost回归算法
from sklearn.ensemble import GradientBoostingRegressor  # GBDT回归算法
from sklearn.model_selection import cross_val_score     # 交叉检验
from sklearn.preprocessing import StandardScaler        # 数据标准化
from sklearn.metrics import explained_variance_score, mean_absolute_error, mean_squared_error, r2_score  # 回归指标:可释方差值、绝对误差、均方误差、r2判定系数
import matplotlib.pyplot as plt     # 导入图形展示库

# 数据准备
raw_data = np.loadtxt('regression.txt')         # 读取数据文件
X_raw, y = raw_data[:, :-1], raw_data[:, -1]    # 分割自变量、因变量
model_ss = StandardScaler()
X = model_ss.fit_transform(X_raw)

# 拆分数据集
# num = int(X.shape[0]*0.7)
# X_train, X_test = X[:num, :], X[num:, :]    # 拆分训练集、测试集
# y_train, y_test = y[:num], y[num:]

# 训练回归模型
n_folds = 5  # 设置交叉检验的次数
model_br = BayesianRidge()      # 建立贝叶斯岭回归模型对象
model_xgbr = XGBRegressor()     # 建立XGBR对象
model_lr = LinearRegression()   # 建立普通线性回归模型对象
model_etc = ElasticNet()        # 建立弹性网络回归模型对象
model_svr = SVR()               # 建立支持向量机回归模型对象
model_gbr = GradientBoostingRegressor()     # 建立梯度提升回归模型对象
model_names = ['BayesianRidge', 'XGBR', 'LinearRegression', 'ElasticNet', 'SVR', 'GBR']     # 不同模型的名称列表
model_dic = [model_br, model_xgbr, model_lr, model_etc, model_svr, model_gbr]       # 不同回归模型对象的集合
cv_score_list = []      # 交叉检验结果列表
pre_y_list = []         # 各个回归模型预测的y值列表
for model in model_dic: # 读出每个回归模型对象
    scores = cross_val_score(model, X, y, cv=n_folds)   # 将每个回归模型导入交叉检验模型中做训练检验
    cv_score_list.append(scores)    # 将交叉检验结果存入结果列表
    pre_y_list.append(model.fit(X, y).predict(X))       # 将回归训练中得到的预测y存入列表

# 模型效果指标评估
n_samples, n_features = X.shape     # 总样本量,总特征数
model_metrics_name = [explained_variance_score, mean_absolute_error, mean_squared_error, r2_score]      # 回归评估指标对象集
model_metrics_list = []     # 回归评估指标列表
for i in range(6):          # 循环每个模型索引
    tmp_list = []           # 每个内循环的临时结果列表
    for m in model_metrics_name:    # 循环每个指标对象
        tmp_score = m(y, pre_y_list[i])     # 计算每个回归指标结果
        tmp_list.append(tmp_score)  # 将结果存入每个内循环的临时结果列表
    model_metrics_list.append(tmp_list)     # 将结果存入回归评估指标列表
df1 = pd.DataFrame(cv_score_list, index=model_names)    # 建立交叉检验的数据框
df2 = pd.DataFrame(model_metrics_list, index=model_names, columns=['ev', 'mae', 'mse', 'r2'])   # 建立回归指标的数据框
print ('samples: %d \t features: %d' % (n_samples, n_features))     # 打印输出样本量和特征数量
print (70 * '-')
print ('cross validation result:')      # 打印输出标题
print (df1)                             # 打印输出交叉检验的数据框
print (70 * '-')
print ('regression metrics:')           # 打印输出标题
print (df2)                             # 打印输出回归指标的数据框
print (70 * '-')
print ('short name \t full name')       # 打印输出缩写和全名标题
print ('ev \t explained_variance')
print ('mae \t mean_absolute_error')
print ('mse \t mean_squared_error')
print ('r2 \t r2')
print (70 * '-')

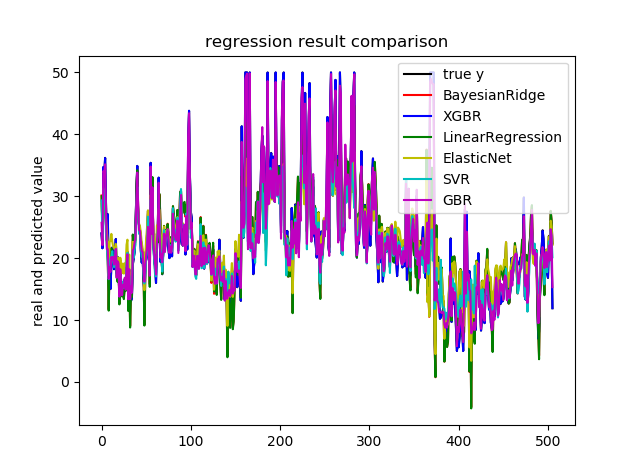
# 模型效果可视化
plt.figure()    # 创建画布
plt.plot(np.arange(X.shape[0]), y, color='k', label='true y')   # 画出原始值的曲线
color_list = ['r', 'b', 'g', 'y', 'c', 'm']         # 颜色列表[红、蓝、绿、黄、青、品红]
linestyle_list = ['-', '.', 'o', 'v', '*', '+']     # 样式列表
for i, pre_y in enumerate(pre_y_list):              # 读出通过回归模型预测得到的索引及结果
    plt.plot(np.arange(X.shape[0]), pre_y_list[i], color_list[i], label=model_names[i])     # 画出每条预测结果线
plt.title('regression result comparison')           # 标题
plt.legend(loc='upper right')                       # 图例位置
plt.ylabel('real and predicted value')              # y轴标题
plt.show()      # 展示图像

# 模型应用
print ('regression prediction')
new_point_set = [[1.05393, 0., 8.14, 0., 0.538, 5.935, 29.3, 4.4986, 4., 307., 21., 386.85, 6.58],
                 [0.7842, 0., 8.14, 0., 0.538, 5.99, 81.7, 4.2579, 4., 307., 21., 386.75, 14.67],
                 [0.80271, 0., 8.14, 0., 0.538, 5.456, 36.6, 3.7965, 4., 307., 21., 288.99, 11.69],
                 [0.7258, 0., 8.14, 0., 0.538, 5.727, 69.5, 3.7965, 4., 307., 21., 390.95, 11.28]]      # 要预测的新数据集
for i, new_point in enumerate(new_point_set):       # 循环读出每个要预测的数据点
    new_pre_y = model_xgbr.predict(np.array(new_point).reshape(1,-1))    # 使用GBR进行预测
    print ('predict for new point %d is:  %.2f' % (i + 1, new_pre_y))   # 打印输出每个数据点的预测信息
C:\software\anaconda3\python.exe C:/workspace/python/大型促销活动前的销售预测分析.py
samples: 506 	 features: 13
----------------------------------------------------------------------
cross validation result:
                         0         1         2         3         4
BayesianRidge     0.659287  0.727641  0.591216  0.088635 -0.152206
XGBR              0.707535  0.816677  0.814639  0.518890  0.290313
LinearRegression  0.638611  0.713344  0.586451  0.078425 -0.263125
ElasticNet        0.637525  0.644080  0.309638  0.221611 -0.086727
SVR               0.761631  0.515500  0.097640  0.337317 -0.365788
GBR               0.785340  0.856977  0.750193  0.571982  0.427370
----------------------------------------------------------------------
regression metrics:
                        ev       mae        mse        r2
BayesianRidge     0.740272  3.256576  21.926109  0.740272
XGBR              0.999991  0.018600   0.000742  0.999991
LinearRegression  0.740608  3.272945  21.897779  0.740608
ElasticNet        0.646134  3.744016  29.873179  0.646134
SVR               0.713399  2.798971  25.069765  0.703034
GBR               0.975126  1.151773   2.099835  0.975126
----------------------------------------------------------------------
short name 	 full name
ev 	 explained_variance
mae 	 mean_absolute_error
mse 	 mean_squared_error
r2 	 r2
----------------------------------------------------------------------
regression prediction
predict for new point 1 is:  20.13
predict for new point 2 is:  21.46
predict for new point 3 is:  21.46
predict for new point 4 is:  21.50

Process finished with exit code 0


 浙公网安备 33010602011771号