
linux trace point机制1---原理描述(linux5.1.6)
一、引入trace point的背景
当需要获取内核的debug信息时,通常你会通过以下printk的方式打印信息:
| void trace_func() { …… printk输出信息 …… } |
缺点:
- 内核中printk是统一控制的,各个模块的printk都会被打印,无法只打印需要关注的模块。
- 如果需要修改/新增打印信息,需要修改所有受影响的printk语句。这些printk分散在代码多处,每个地方都需要修改。
- 嵌入式系统中,如果printk信息量大,console(如果有)有大量的打印输出,用户无法在console输入命令,影响人机交互。
二、内核解决方案
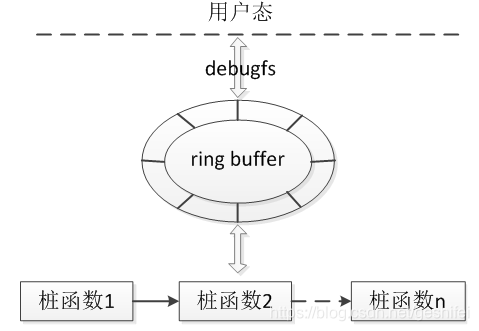
内核采用“插桩”的方法抓取log,“插桩”也称为trace point。每种trace point有一个name、一个enable开关、一系列桩函数、注册桩函数的函数、卸载桩函数的函数。“桩函数”功能类似于printk,不过“桩函数”并不会把信息打印到console,而是输出到内核的ring buffer(环形缓冲区),缓冲区中的信息通过debugfs对用户呈现。
逻辑架构如下:
接下来说明涉及到一些内核数据结构,代码参考:
| 数据结构 | 代码路径 |
| DEFINE_TRACE(name) DECLARE_TRACE(name, proto, args) | include/linux/tracepoint.h |
| struct tracepoint | include/linux/tracepoint-defs.h |
- trace point依次执行桩函数,每个桩函数实现不同的debug功能。内核通过register_trace_##name将桩函数添加到trace point中,通过unregister_trace_##name从trace point中移除。(注:##表示字符串连接)。
- 内核通过DEFINE_TRACE(name)定义struct tracepoint变量来描述trace point。
| struct tracepoint { const char *name; /* Tracepoint name */ struct static_key key; int (*regfunc)(void); void (*unregfunc)(void); struct tracepoint_func __rcu *funcs; }; |
@name trace point的名字,内核中通过hash表管理所有的trace point,找到对应的hash slot后,需要通过name来识别具体的trace point。
@key trace point状态,1表示disable,0表示enable。
@ regfunc 添加桩函数的函数
@unregfunc 卸载桩函数的函数
@ funcs trace point中所有的桩函数链表
3. 内核通过#define DECLARE_TRACE(name, proto, args)定义trace point用到的函数,定义的函数原型如下(从代码中摘取了几个,不止以下3个):
static inline void trace_##name(proto)
register_trace_##name(void (*probe)(data_proto), void *data)
unregister_trace_##name(void (*probe)(data_proto), void *data)
| 1 #define __DECLARE_TRACE(name, proto, args, cond, data_proto, data_args) 2 extern struct tracepoint __tracepoint_##name; 3 static inline void trace_##name(proto) 4 { 5 if (static_key_false(&__tracepoint_##name.key)) 6 __DO_TRACE(&__tracepoint_##name, 7 TP_PROTO(data_proto), 8 TP_ARGS(data_args), 9 TP_CONDITION(cond),,); 10 } 11 register_trace_##name(void (*probe)(data_proto), void *data) 12 { 13 return tracepoint_probe_register(&__tracepoint_##name, 14 (void *)probe, data); 15 } 16 unregister_trace_##name(void (*probe)(data_proto), void *data) 17 { 18 return tracepoint_probe_unregister(&__tracepoint_##name,(void *)probe, data); 19 } |
第2行声明一个外部trace point变量。红色部分定义了一些trace point用到的公共函数。
第5行判断trace point是否disable,如果没有disable,那么调用__DO_TRACE遍历执行trace point中的桩函数(通过“函数指针”来实现执行桩函数)。
trace point提供了统一的框架,用void *指向任何函数,所以各个trace point取出桩函数指针后,需要转换成自己的函数指针类型, TP_PROTO(data_proto)传递函数指针类型用于转换,具体的转换在:
| 1 #define __DO_TRACE(tp, proto, args, cond, rcuidle) 2 do { 3 struct tracepoint_func *it_func_ptr; 4 void *it_func; 5 void *__data; 6 …… 7 it_func_ptr = rcu_dereference_raw((tp)->funcs); 8 if (it_func_ptr) { 9 do { 10 it_func = (it_func_ptr)->func; 11 __data = (it_func_ptr)->data; 12 ((void(*)(proto))(it_func))(args); 13 } while ((++it_func_ptr)->func); 14 } 15 …… 16 }while(0) |
4. 桩函数的proto的传递的例
| 1 DEFINE_EVENT_CONDITION(f2fs__submit_page_bio, f2fs_submit_page_write, 2 TP_PROTO(struct page *page, struct f2fs_io_info *fio), 3 TP_ARGS(page, fio), 4 TP_CONDITION(page->mapping) 5 ); |
第2行声明了桩函数原型。
| 1 #define DEFINE_EVENT_CONDITION(template, name, proto, args, cond) 2 DEFINE_EVENT(template, name, PARAMS(proto), PARAMS(args)) |
| 1 #define DEFINE_EVENT(template, name, proto, args) 2 DECLARE_TRACE(name, PARAMS(proto), PARAMS(args)) |
| 1 #define DECLARE_TRACE(name, proto, args) 2 __DECLARE_TRACE(name, PARAMS(proto), PARAMS(args), 3 cpu_online(raw_smp_processor_id()), 4 PARAMS(void *__data, proto), 5 PARAMS(__data, args)) |
至此执行到__DECLARE_TRACE宏,参考前面说明,提到了何时转换成桩函数指针类型。
从上面可以看出trace point的机制很简单,就是把用于debug的函数指针组织在一个struct trace point变量中,然后依次执行各个函数指针。不过为了避免各个模块重复写代码,内核用了比较复杂的宏而已。
另外我们也可以发现,使用trace point必须要通过register_trace_##name将桩函数(也就是我们需要的debug函数)添加到trace point中,这个工作只能通过moudule或者修改内核代码实现,对于开发者来说,操作比较麻烦。ftrace开发者们意识到了这点,所以提供了trace event功能,开发者不需要自己去注册桩函数了,易用性较好,后面文章会谈到trace event是如何实现的以及如何使用。

 浙公网安备 33010602011771号