
-XX:MaxDirectMemorySize
1. 关于MaxDirectMemorySize的设置
2. JVM参数之MaxDirectMemorySize
1、Java_JVM参数-XX:MaxDirectMemorySize 与 两种 ByteBuffer: heap,direct ByteBuffer(参考:https://www.cnblogs.com/laoqing/p/10380536.html)
ByteBuffer有两种:
heap ByteBuffer -> -XX:Xmx
1.1、一种是heap ByteBuffer,该类对象分配在JVM的堆内存里面,直接由Java虚拟机负责垃圾回收;
direct ByteBuffer -> -XX:MaxDirectMemorySize
1.2、一种是direct ByteBuffer是通过jni在虚拟机外内存中分配的。通过jmap无法查看该快内存的使用情况。只能通过top来看它的内存使用情况。
1.2.1、JVM堆内存大小可以通过-Xmx来设置,同样的direct ByteBuffer可以通过-XX:MaxDirectMemorySize来设置,此参数的含义是当Direct ByteBuffer分配的堆外内存到达指定大小后,即触发Full GC。注意该值是有上限的,默认是64M,最大为sun.misc.VM.maxDirectMemory(),在程序中中可以获得-XX:MaxDirectMemorySize的设置的值。
1.2.2、没有配置MaxDirectMemorySize的,因此MaxDirectMemorySize的大小即等于-Xmx
1.2.3、Direct Memory的回收机制,Direct Memory是受GC控制的
1.2.4、对于使用Direct Memory较多的场景,需要注意下MaxDirectMemorySize的设置,避免-Xmx + Direct Memory超出物理内存大小的现象
2、用JDK8的一定要配置:-Xms -Xmx -XX:MaxDirectMemorySize,【Xmx +(加) MaxDirectMemorySize】的值不能超过docker的最大内存,不然docker内存占满了会被oomkill掉;
没配置参数导致的问题以及处理参考:http://hellojava.info/?tag=maxdirectmemorysize (物理内存耗尽、CMS GC碎片造成RT慢的两个Case)
分析:https://my.oschina.net/go4it/blog/3029481
3、dmesg排查消失的进程:
3.1、适用场景:
如果发现自己的java进程悄无声息的消失了,几乎没有留下任何线索,那么dmesg一发,很有可能有你想要的。
3.2、具体操作
sudo dmesg|grep -i kill | less 或者 dmesg | grep kill
去找关键字oom_killer,找到的结果类似如下:
[6710782.021013] java invoked oom-killer: gfp_mask=0xd0, order=0, oom_adj=0, oom_scoe_adj=0
[6710782.070639] [] ? oom_kill_process+0x68/0x140
[6710782.257588] Task in /LXC011175068174 killed as a result of limit of /LXC011175068174
[6710784.698347] Memory cgroup out of memory: Kill process 215701 (java) score 854 or sacrifice child
[6710784.707978] Killed process 215701, UID 679, (java) total-vm:11017300kB, anon-rss:7152432kB, file-rss:1232kB
以上表明,对应的java进程被系统的OOM Killer给干掉了,得分为854.
解释一下OOM killer(Out-Of-Memory killer),该机制会监控机器的内存资源消耗。当机器内存耗尽前,该机制会扫描所有的进程(按照一定规则计算,内存占用,时间等),挑选出得分最高的进程,然后杀死,从而保护机器。
dmesg日志时间转换公式:
log实际时间=格林威治1970-01-01+(当前时间秒数-系统启动至今的秒数+dmesg打印的log时间)秒数:
date -d “1970-01-01 UTC echo "$(date +%s)-$(cat /proc/uptime|cut -f 1 -d' ')+12288812.926194"|bc seconds”
剩下的,就是看看为什么内存这么大,触发了OOM-Killer了。
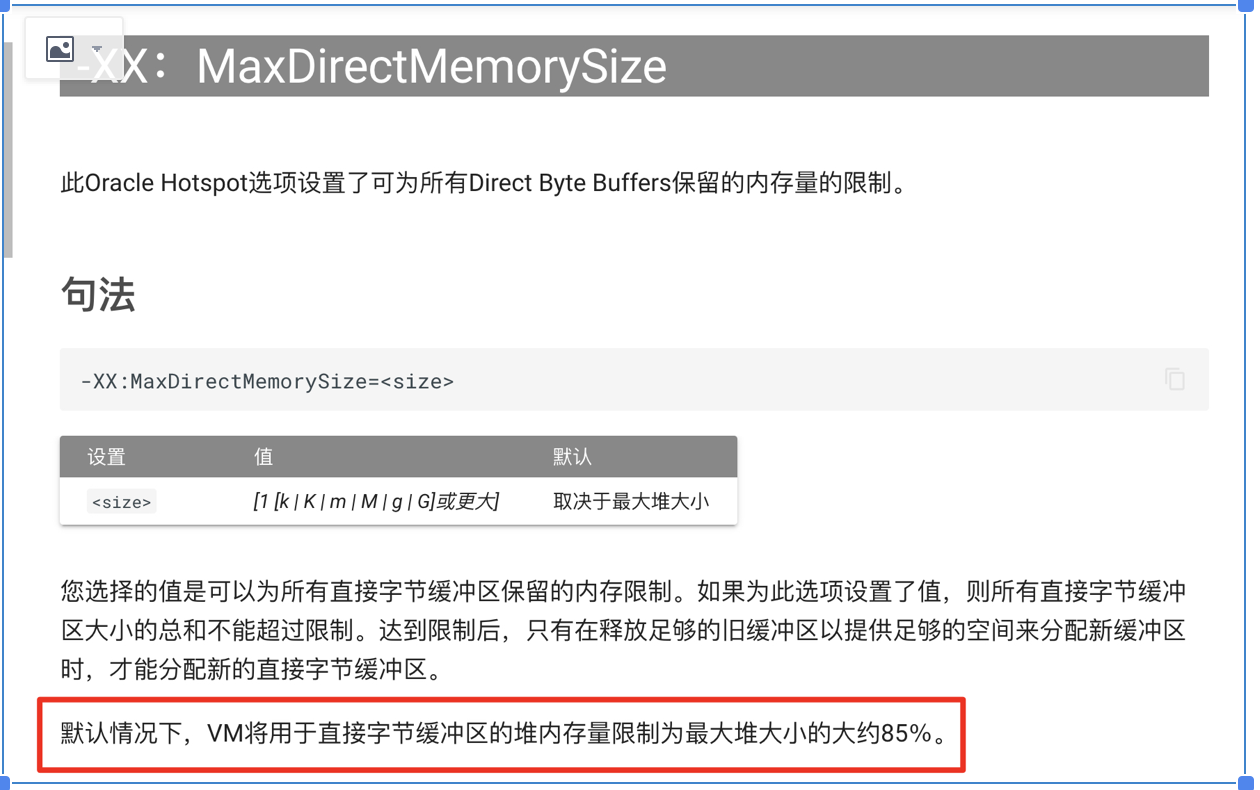
4、默认情况下,VM将用于直接字节缓冲区的堆内存量限制为最大堆大小的大约85%
http://lovestblog.cn/blog/2015/05/12/direct-buffer/
附:几种内存溢出处理办法:cnblogs.com/leasonWang/p/11146030.html
先说结论:NIO的DirectBuffer的大小,和元空间没有关系。不能因为DirectBuffer和metaspace都是在native内存中分配的就将其混为一谈。两个走的完全是不相关的逻辑。
以OpenJDK 8的ByteBuffer为例,本质上分配内存的逻辑为:
DirectByteBuffer(int cap) {                   // package-private
    super(-1, 0, cap, cap);
    boolean pa = VM.isDirectMemoryPageAligned();
    int ps = Bits.pageSize();
    long size = Math.max(1L, (long) cap + (pa ? ps : 0));
    Bits.reserveMemory(size, cap);

    long base = 0;
    try {
        base = unsafe.allocateMemory(size);
    } catch (OutOfMemoryError x) {
        Bits.unreserveMemory(size, cap);
        throw x;
    }
    unsafe.setMemory(base, size, (byte) 0);
    if (pa && (base % ps != 0)) {
        // Round up to page boundary
        address = base + ps - (base & (ps - 1));
    } else {
        address = base;
    }
    cleaner = Cleaner.create(this, new DirectByteBuffer.Deallocator(base, size, cap));
    att = null;
}
核心还是用Unsafe的allocateMemory来分配的内存,而Unsafe的分配逻辑是:
UNSAFE_ENTRY(jlong, Unsafe_AllocateMemory(JNIEnv *env, jobject unsafe, jlong size))
  UnsafeWrapper("Unsafe_AllocateMemory");
  size_t sz = (size_t)size;
  if (sz != (julong)size || size < 0) {
    THROW_0(vmSymbols::java_lang_IllegalArgumentException());
  }
  if (sz == 0) {
    return 0;
  }
  sz = round_to(sz, HeapWordSize);
  void* x = os::malloc(sz, mtInternal);
  if (x == NULL) {
    THROW_0(vmSymbols::java_lang_OutOfMemoryError());
  }
  //Copy::fill_to_words((HeapWord*)x, sz / HeapWordSize);
  return addr_to_java(x);
UNSAFE_END
最核心的os::malloc的逻辑是:
void* os::malloc(size_t size, MEMFLAGS memflags, const NativeCallStack& stack) {
  NOT_PRODUCT(inc_stat_counter(&num_mallocs, 1));
  NOT_PRODUCT(inc_stat_counter(&alloc_bytes, size));

#ifdef ASSERT
  // checking for the WatcherThread and crash_protection first
  // since os::malloc can be called when the libjvm.{dll,so} is
  // first loaded and we don't have a thread yet.
  // try to find the thread after we see that the watcher thread
  // exists and has crash protection.
  WatcherThread *wt = WatcherThread::watcher_thread();
  if (wt != NULL && wt->has_crash_protection()) {
    Thread* thread = ThreadLocalStorage::get_thread_slow();
    if (thread == wt) {
      assert(!wt->has_crash_protection(),
          "Can't malloc with crash protection from WatcherThread");
    }
  }
#endif

  if (size == 0) {
    // return a valid pointer if size is zero
    // if NULL is returned the calling functions assume out of memory.
    size = 1;
  }

  // NMT support
  NMT_TrackingLevel level = MemTracker::tracking_level();
  size_t            nmt_header_size = MemTracker::malloc_header_size(level);

#ifndef ASSERT
  const size_t alloc_size = size + nmt_header_size;
#else
  const size_t alloc_size = GuardedMemory::get_total_size(size + nmt_header_size);
  if (size + nmt_header_size > alloc_size) { // Check for rollover.
    return NULL;
  }
#endif

  NOT_PRODUCT(if (MallocVerifyInterval > 0) check_heap());

  u_char* ptr;
  if (MallocMaxTestWords > 0) {
    ptr = testMalloc(alloc_size);
  } else {
    ptr = (u_char*)::malloc(alloc_size);
  }

#ifdef ASSERT
  if (ptr == NULL) {
    return NULL;
  }
  // Wrap memory with guard
  GuardedMemory guarded(ptr, size + nmt_header_size);
  ptr = guarded.