Android systrace命令行工具
命令行工具systrace(System Trace)跟踪的是系统级的内容,如CPU各核心调度,SurfaceFlinger、VSync(垂直同步)、BufferQueue。
通过收集系统事件和App逻辑中插入的自定义事件的组合数据,在排查性能问题时 (例如UI卡顿或功耗过高)就会显得十分有用。
关于如何使用原生API和UE4宏插入自定义事件,详见:Android Studio Profiler(CPU : System Trace)自定义事件
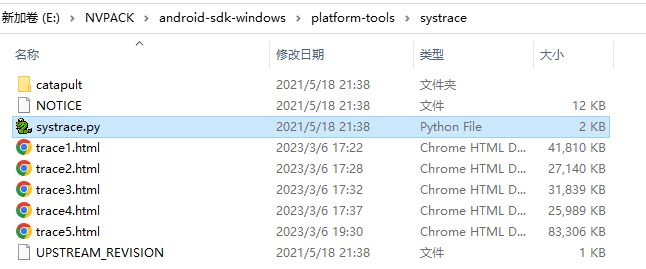
android-sdk-windows自带systrace(需用python2来运行)
systrace工具在android-sdk-windows的如下目录中
查看帮助
E:\NVPACK\android-sdk-windows\platform-tools\systrace>python systrace.py --help
Usage: systrace.py [options] [category1 [category2 ...]]

Example: systrace.py -b 32768 -t 15 gfx input view sched freq

Options:
  -h, --help            show this help message and exit
  -o FILE               write trace output to FILE
  -j, --json            write a JSON file
  --link-assets         (deprecated)
  --asset-dir=ASSET_DIR
                        (deprecated)
  -e DEVICE_SERIAL_NUMBER, --serial=DEVICE_SERIAL_NUMBER
                        adb device serial number
  --target=TARGET       choose tracing target (android or linux)
  --timeout=TIMEOUT     timeout for start and stop tracing (seconds)
  --collection-timeout=COLLECTION_TIMEOUT
                        timeout for data collection (seconds)
  -t N, --time=N        trace for N seconds
  -b N, --buf-size=N    use a trace buffer size  of N KB
  -l, --list-categories
                        list the available categories and exit

  Atrace options:
    --atrace-categories=ATRACE_CATEGORIES
                        Select atrace categories with a comma-delimited list,
                        e.g. --atrace-categories=cat1,cat2,cat3
    -k KFUNCS, --ktrace=KFUNCS
                        specify a comma-separated list of kernel functions to
                        trace
    --no-compress       Tell the device not to send the trace data in
                        compressed form.
    -a APP_NAME, --app=APP_NAME
                        enable application-level tracing for comma-separated
                        list of app cmdlines
    --from-file=FROM_FILE
                        read the trace from a file (compressed) rather than
                        running a live trace

  Atrace process dump options:
    --process-dump      Capture periodic per-process memory dumps.
    --process-dump-interval=PROCESS_DUMP_INTERVAL_MS
                        Interval between memory dumps in milliseconds.
    --process-dump-full=PROCESS_DUMP_FULL_CONFIG
                        Capture full memory dumps for some processes. Value:
                        all, apps or comma-separated process names.
    --process-dump-mmaps
                        Capture VM regions and memory-mapped files. It
                        increases dump size dramatically, hence only has
                        effect if --process-dump-full is a whitelist.

  Ftrace options:
    --ftrace-categories=FTRACE_CATEGORIES
                        Select ftrace categories with a comma-delimited list,
                        e.g. --ftrace-categories=cat1,cat2,cat3

  WALT trace options:
    --walt              Use the WALT tracing agent. WALT is a device for
                        measuring latency of physical sensors on phones and
                        computers. See https://github.com/google/walt
-o : 指示输出文件的路径和名字
-t : 抓取时间(最新版本可以不用指定, 按 Enter 即可结束)
-b : 指定 buffer 大小 (一般情况下,默认的 Buffer 是够用的,如果你要抓很长的 Trae , 那么建议调大 Buffer )
-a : 指定 app 包名 (如果要 Debug 自定义的 Trace 点, 记得要加这个)
查看手机支持的TAG
以下为小米10,Android10系统的数据:
C:\Users\kekec>adb shell atrace --list_categories
         gfx - Graphics
       input - Input
        view - View System
     webview - WebView
          wm - Window Manager
          am - Activity Manager
          sm - Sync Manager
       audio - Audio
       video - Video
      camera - Camera
         hal - Hardware Modules
         res - Resource Loading
      dalvik - Dalvik VM
          rs - RenderScript
      bionic - Bionic C Library
       power - Power Management
          pm - Package Manager
          ss - System Server
    database - Database
     network - Network
         adb - ADB
    vibrator - Vibrator
        aidl - AIDL calls
       nnapi - NNAPI
         rro - Runtime Resource Overlay
         pdx - PDX services
       sched - CPU Scheduling
        freq - CPU Frequency
        idle - CPU Idle
        disk - Disk I/O
        sync - Synchronization
  memreclaim - Kernel Memory Reclaim
  binder_driver - Binder Kernel driver
  binder_lock - Binder global lock trace
      memory - Memory
         gfx - Graphics (HAL)
         ion - ION allocation (HAL)
注:TAG 选的少的话,Trace 文件的体积也会相应的变小,但是抓取的内容也会相应变少。
执行命令进行profile
E:\NVPACK\android-sdk-windows\platform-tools\systrace>C:\Python27\python.exe systrace.py -a com.tencent.mf.mytest1 --time=10 -o trace1.html sched freq idle am wm gfx view sync binder_driver hal input aidl
Agent cgroup_data not started.
Warning: Only 2 of 3 tracing agents started.
Starting tracing (10 seconds)
Tracing completed. Collecting output...
Outputting Systrace results...
Tracing complete, writing results

Wrote trace HTML file: file://E:\NVPACK\android-sdk-windows\platform-tools\systrace\trace1.html
注:python2需要提前安装pywin32库(python -m pip install pywin32),否则会报如下错误
Traceback (most recent call last):
  File "systrace.py", line 48, in <module>
    from systrace import run_systrace
  File "E:\NVPACK\android-sdk-windows\platform-tools\systrace\catapult\systrace\systrace\run_systrace.py", line 37, in <module>
    from devil import devil_env
  File "E:\NVPACK\android-sdk-windows\platform-tools\systrace\catapult\systrace\systrace\..\..\devil\devil\devil_env.py", line 33, in <module>
    import dependency_manager  # pylint: disable=import-error
  File "E:\NVPACK\android-sdk-windows\platform-tools\systrace\catapult\dependency_manager\dependency_manager\__init__.py", line 30, in <module>
    from .archive_info import ArchiveInfo
  File "E:\NVPACK\android-sdk-windows\platform-tools\systrace\catapult\dependency_manager\dependency_manager\archive_info.py", line 9, in <module>
    from dependency_manager import exceptions
  File "E:\NVPACK\android-sdk-windows\platform-tools\systrace\catapult\dependency_manager\dependency_manager\exceptions.py", line 5, in <module>
    from py_utils import cloud_storage
  File "E:\NVPACK\android-sdk-windows\platform-tools\systrace\catapult\common\py_utils\py_utils\cloud_storage.py", line 23, in <module>
    from py_utils import lock
  File "E:\NVPACK\android-sdk-windows\platform-tools\systrace\catapult\common\py_utils\py_utils\lock.py", line 22, in <module>
    import win32con
ImportError: No module named win32con
查看profile文件
用perfetto网页工具打开trace1.html文件:
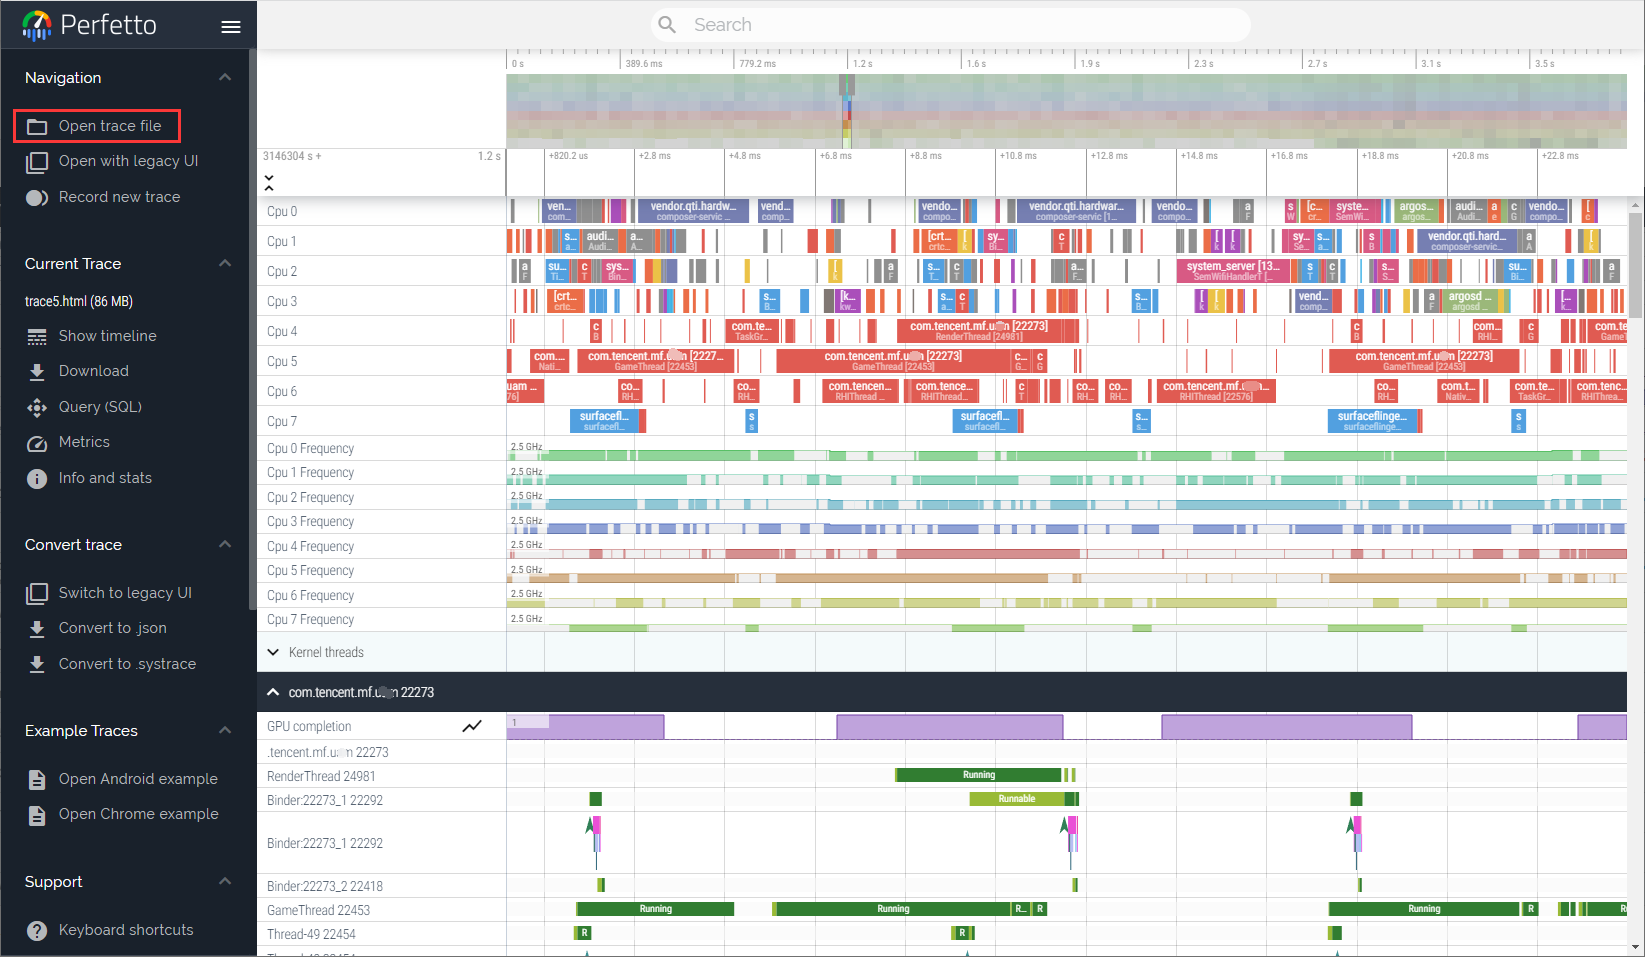
注:也可以把trace1.html文件拖进perfetto网页工具中
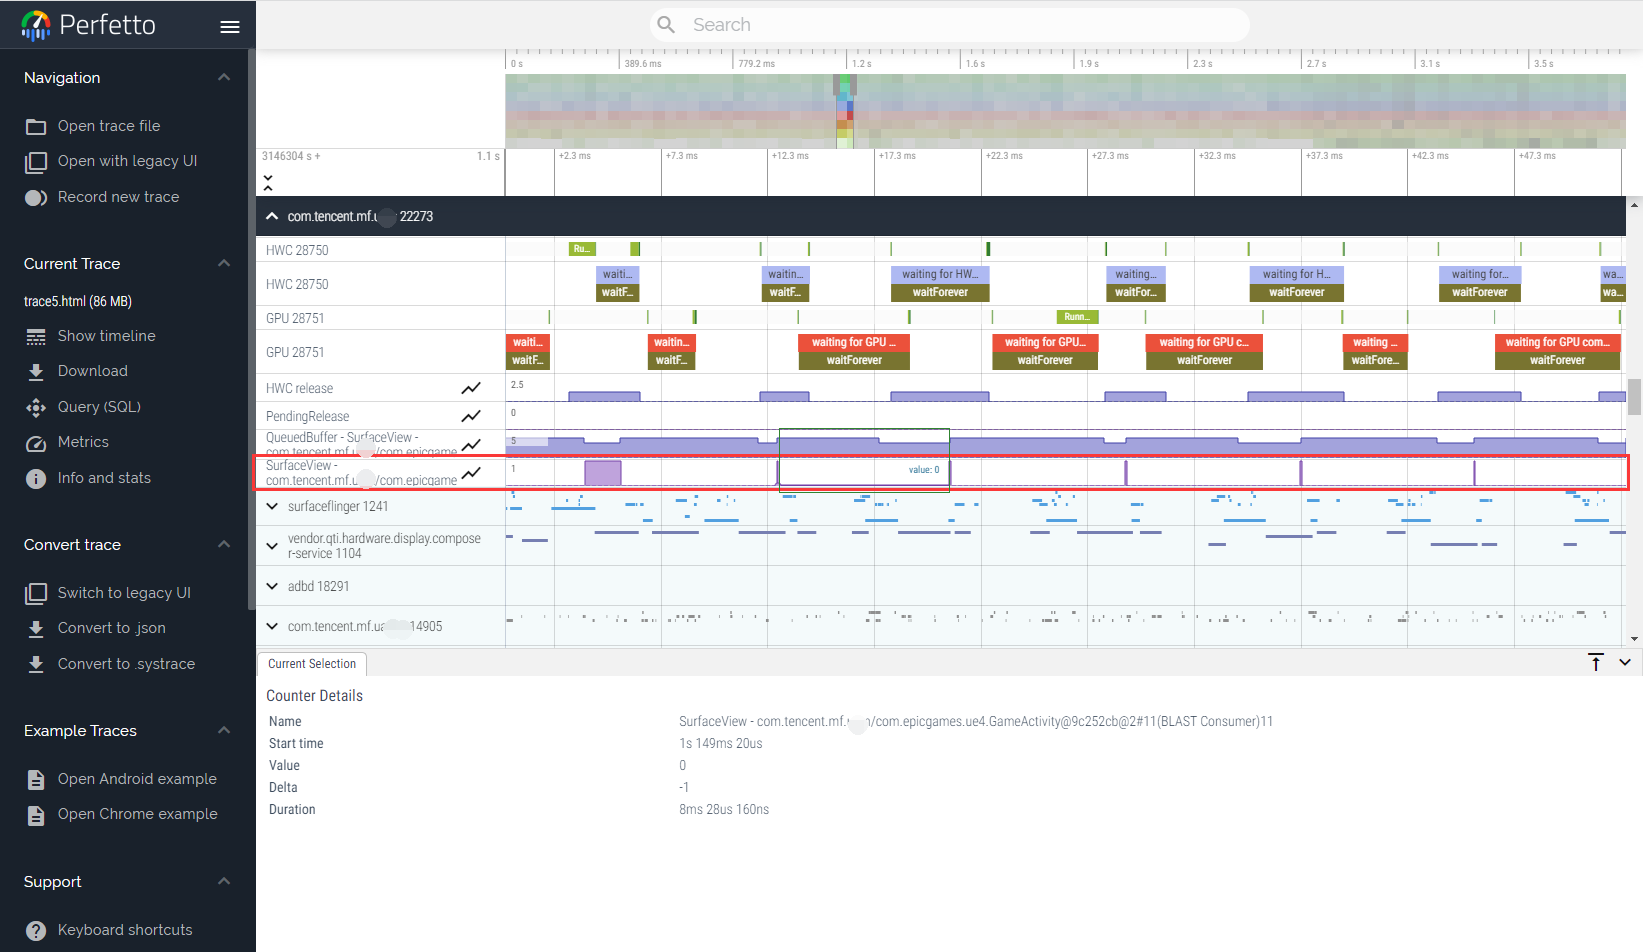
查看某个应用的SurfaceView的垂直同步(Vsync)信息:
python3版systrace
查看帮助
E:\UAGamePerformance\systrace_py3>C:\Python36-32\python.exe .\catapult\systrace\systrace\run_systrace.py --help
Usage: run_systrace.py [options] [category1 [category2 ...]]

Example: run_systrace.py -b 32768 -t 15 gfx input view sched freq

Options:
  -h, --help            show this help message and exit
  -o FILE               write trace output to FILE
  -j, --json            write a JSON file
  --link-assets         (deprecated)
  --asset-dir=ASSET_DIR
                        (deprecated)
  -e DEVICE_SERIAL_NUMBER, --serial=DEVICE_SERIAL_NUMBER
                        adb device serial number
  --target=TARGET       choose tracing target (android or linux)
  --timeout=TIMEOUT     timeout for start and stop tracing (seconds)
  --collection-timeout=COLLECTION_TIMEOUT
                        timeout for data collection (seconds)
  -t N, --time=N        trace for N seconds
  -b N, --buf-size=N    use a trace buffer size  of N KB
  -l, --list-categories
                        list the available categories and exit

  Atrace options:
    --atrace-categories=ATRACE_CATEGORIES
                        Select atrace categories with a comma-delimited list,
                        e.g. --atrace-categories=cat1,cat2,cat3
    -k KFUNCS, --ktrace=KFUNCS
                        specify a comma-separated list of kernel functions to
                        trace
    --no-compress       Tell the device not to send the trace data in
                        compressed form.
    -a APP_NAME, --app=APP_NAME
                        enable application-level tracing for comma-separated
                        list of app cmdlines
    --from-file=FROM_FILE
                        read the trace from a file (compressed) rather than
                        running a live trace

  Atrace process dump options:
    --process-dump      Capture periodic per-process memory dumps.
    --process-dump-interval=PROCESS_DUMP_INTERVAL_MS
                        Interval between memory dumps in milliseconds.
    --process-dump-full=PROCESS_DUMP_FULL_CONFIG
                        Capture full memory dumps for some processes. Value:
                        all, apps or comma-separated process names.
    --process-dump-mmaps
                        Capture VM regions and memory-mapped files. It
                        increases dump size dramatically, hence only has
                        effect if --process-dump-full is a whitelist.

  Ftrace options:
    --ftrace-categories=FTRACE_CATEGORIES
                        Select ftrace categories with a comma-delimited list,
                        e.g. --ftrace-categories=cat1,cat2,cat3

  WALT trace options:
    --walt              Use the WALT tracing agent. WALT is a device for
                        measuring latency of physical sensors on phones and
                        computers. See https://github.com/google/walt
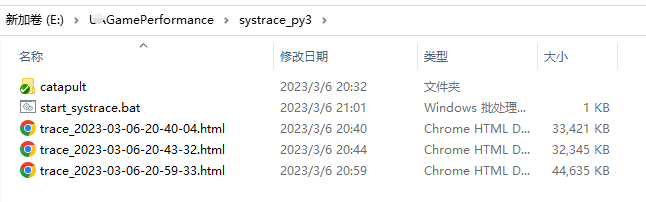
catapult的git库:https://github.com/catapult-project/catapult
start_systrace.bat中的内容如下:
set python_path=C:\Python36-32
set time0=%time: =0%
set hour=%time0:~0,2%
set output_name=%date:~0,4%-%date:~5,2%-%date:~8,2%-%hour%-%time:~3,2%-%time:~6,2%

rem 为com.tencent.mf.mytest1开启trace profile,在某些手机上需要
adb shell "setprop debug.atrace.app_number 1"
adb shell "setprop debug.atrace.app_0 com.tencent.mf.mytest1"
C:\Python36-32\python.exe %~dp0catapult\systrace\systrace\run_systrace.py -a com.tencent.mf.mytest1 --time=10 -o %~dp0\trace_%output_name%.html sched freq idle am wm gfx view sync binder_driver hal input aidl
pause
操作
模式切换
Select mode:单击已选定区能将所有相同的块高亮选中;
Pan mode:拖动平移视图(按住Shift并左键拖动鼠标)
Zoom mode:通过上/下滚动鼠标来实现放大/缩小功能;(按住Ctrl键并拖动鼠标)
快捷键操作
| # | 作用 |
|---|---|
| w | 放大,[+shift]速度更快 |
| s | 缩小,[+shift]速度更快 |
| a | 左移,[+shift]速度更快 |
| d | 右移,[+shift]速度更快 |
参考
Android Systrace 基础知识 -- Systrace 简介


 浙公网安备 33010602011771号