
Python for Data Science - Delving into non-parametric methods using pandas and scipy
Chapter 5 - Basic Math and Statistics
Segment 6 - Delving into non-parametric methods using pandas and scipy
import numpy as np
import pandas as pd

import matplotlib.pyplot as plt
import seaborn as sb
from pylab import rcParams

import scipy
from scipy.stats import spearmanr
%matplotlib inline
rcParams['figure.figsize'] = 14, 7
plt.style.use('seaborn-whitegrid')
The Spearman Rank Correlation
address = '~/Data/mtcars.csv'

cars = pd.read_csv(address)
cars.columns = ['car_names','mpg','cyl','disp', 'hp', 'drat', 'wt', 'qsec', 'vs', 'am', 'gear', 'carb']
cars.head()
| car_names | mpg | cyl | disp | hp | drat | wt | qsec | vs | am | gear | carb | |
|---|---|---|---|---|---|---|---|---|---|---|---|---|
| 0 | Mazda RX4 | 21.0 | 6 | 160.0 | 110 | 3.90 | 2.620 | 16.46 | 0 | 1 | 4 | 4 |
| 1 | Mazda RX4 Wag | 21.0 | 6 | 160.0 | 110 | 3.90 | 2.875 | 17.02 | 0 | 1 | 4 | 4 |
| 2 | Datsun 710 | 22.8 | 4 | 108.0 | 93 | 3.85 | 2.320 | 18.61 | 1 | 1 | 4 | 1 |
| 3 | Hornet 4 Drive | 21.4 | 6 | 258.0 | 110 | 3.08 | 3.215 | 19.44 | 1 | 0 | 3 | 1 |
| 4 | Hornet Sportabout | 18.7 | 8 | 360.0 | 175 | 3.15 | 3.440 | 17.02 | 0 | 0 | 3 | 2 |
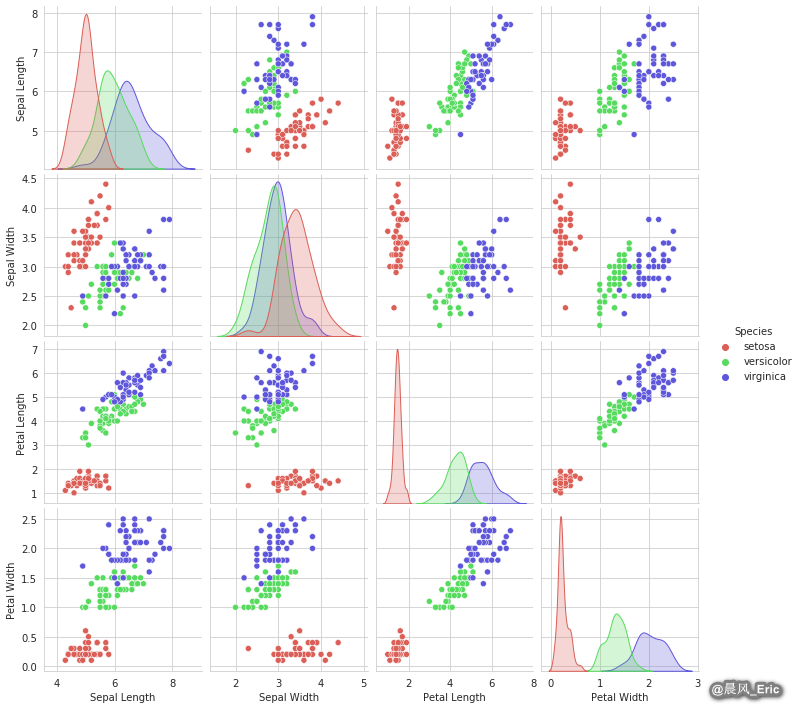
sb.pairplot(cars)
<seaborn.axisgrid.PairGrid at 0x7f1891238e80>
X = cars[['cyl','vs','am','gear']]
sb.pairplot(X)
<seaborn.axisgrid.PairGrid at 0x7f188b9b8ba8>
cyl = cars['cyl']
vs = cars['vs']
am = cars['am']
gear = cars['gear']

spearmanr_coefficient, p_value = spearmanr(cyl,vs)

print('Spearman Rank Correlation Coefficient %0.3f' % (spearmanr_coefficient))
Spearman Rank Correlation Coefficient -0.814
spearmanr_coefficient, p_value = spearmanr(cyl,am)

print('Spearman Rank Correlation Coefficient %0.3f' % (spearmanr_coefficient))
Spearman Rank Correlation Coefficient -0.522
spearmanr_coefficient, p_value = spearmanr(cyl,gear)

print('Spearman Rank Correlation Coefficient %0.3f' % (spearmanr_coefficient))
Spearman Rank Correlation Coefficient -0.564
Chi-square test for independence
table = pd.crosstab(cyl, am)

from scipy.stats import chi2_contingency
chi2, p, dof, expected = chi2_contingency(table.values)
print('Chi-square statistic %0.3f p_value %0.3f' % (chi2,p))
Chi-square statistic 8.741 p_value 0.013
table = pd.crosstab(cyl, vs)

from scipy.stats import chi2_contingency
chi2, p, dof, expected = chi2_contingency(table.values)
print('Chi-square statistic %0.3f p_value %0.3f' % (chi2,p))
Chi-square statistic 21.340 p_value 0.000
table = pd.crosstab(cyl, gear)

from scipy.stats import chi2_contingency
chi2, p, dof, expected = chi2_contingency(table.values)
print('Chi-square statistic %0.3f p_value %0.3f' % (chi2,p))
Chi-square statistic 18.036 p_value 0.001
相信未来 - 该面对的绝不逃避,该执著的永不怨悔,该舍弃的不再留念,该珍惜的好好把握。

 浙公网安备 33010602011771号