目标跟踪的评价指标
https://www.cnblogs.com/P3nguin/p/10570053.html
Precision plot: percentages of frames whose estimated locations lie in a given threshold distance to ground-truth centers.
追踪算法估计的目标位置(bounding box)的中心点与人工标注(ground-truth)的目标的中心点,这两者的距离小于给定阈值的视频帧的百分比。不同的阈值,得到的百分比不一样,因此可以获得一条曲线。一般阈值设定为20个像素点。
该评估方法的缺点:无法反映目标物体大小与尺度的变化。
比如一个视频有101帧,追踪算法预测的bounding box中心点与ground-truth中心点距离小于20像素有60帧,其余40帧两者距离均大于20个像素,则当阈值为20像素时,精度为0.6。
Success Plot: Let rt denote the area of tracked bounding box and ra denote the ground truth. An Overlap Score (OS) can be defined by S = |rt∩ra| |rt∪ra| where ∩ and ∩ are the intersection and union of two regions, and |·| counts the number of pixels in the corresponding area. Afterwards, a frame whose OS is larger than a threshold is termed as a successful frame, and the ratios of successful frames at the thresholds ranged from 0 to 1 are plotted in success plots.
首先定义重合率得分(overlap score,OS),追踪算法得到的bounding box(记为a),与ground-truth给的box(记为b),重合率定义为:OS = |a∩b|/|a∪b|,|·|表示区域的像素数目。当某一帧的OS大于设定的阈值时,则该帧被视为成功的(Success),总的成功的帧占所有帧的百分比即为成功率(Success rate)。OS的取值范围为0~1,因此可以绘制出一条曲线。一般阈值设定为0.5。
以上两种常见的评估方式一般都是用ground-truth中目标的位置初始化第一帧,然后运行跟踪算法得到平均精度和成功率。这种方法被称为one-pass evaluation (OPE)。这种方法有2个缺点。一是一个跟踪算法可能对第一帧给定的初始位置比较敏感,在不同位置或者帧初始会造成比较大的影响。二是大多数算法遇到跟踪失败后没有重新初始化的机制。
针对上述两个问题,又提出以下几种评估方法。
鲁棒性评估
通过从时间(temporally,从不同帧起始)和空间(spatially,不同的bounding box)上打乱,然后进行评估。可以分为:temporal robustness evaluation (TRE) 和 spatial robustness evaluation (SRE)。
Temporal robustness evaluation: Each tracking algorithm is evaluated numerous times from different starting frames across an image sequence. In each test, an algorithm is evaluated from a particular starting frame, with the initialization of the corresponding ground-truth object state, until the end of an image sequence. The tracking results of all the tests are averaged to generate the TRE score.
在一个图片/视频序列中,每个跟踪算法从不同的帧作为起始进行追踪(比如分别从第一帧开始进行跟踪,从第十帧开始进行跟踪,从第二十帧开始进行跟踪等),初始化采用的bounding box即为对应帧标注的ground-truth。最后对这些结果取平均值,得到TRE score。
Spatial robustness evaluation: To evaluate whether a tracking method is sensitive to initialization errors, we generate the object states by slightly shifting or scaling the ground-truth bounding box of a target object. In this work, we use eight spatial shifts (four center shifts and four corner shifts), and four scale variations (see Fig. 2). The amount for shift is 10 percent of the target size, and the scale ratio varies from 80 to 120 percent of the ground truth at the increment of 10 percent. The SRE score is the average of these 12 evaluations.
由于有些算法对初始化时给定的bounding box比较敏感,而目前测评用的ground-truth都是人工标注的,因此可能会对某些跟踪算法产生影响。因此为了评估这些跟踪算法是否对初始化敏感,作者通过将ground-truth轻微的平移和尺度的扩大与缩小来产生bounding box。平移的大小为目标物体大小的10%,尺度变化范围为ground-truth的80%到120%,每10%依次增加。最后取这些结果的平均值作为SRE score。
https://www.pianshen.com/article/40111762784/
目标识别的评价指标主要有ROC曲线,missrate(MR,其实就是FALSE Positive)、FPPI、FPPW等。单图像跟踪的评价指标主要有两个,一个是pixel error,一般是算中心距离,另一个是overlap rate,区域重叠率,用重叠区域除以两个矩形所占的总面积Aoverlap /(A1+A2-Aoverlap),常常用pixel error绘制帧误差曲线,用重叠率绘制误差曲线。除此之外,还有针对多目标图像跟踪的评价指标。在VOT中,目标跟踪的评价指标又多了EOA和EOF图,这篇博客都会介绍。
OTB
Online Object Tracking Benckmark,其中主要使用两类评价指标,一类是平均像素误差Average Pixel Error(APE),二类是平均重叠率Average Overlap Rate(AOR)
平均像素误差
顾名思义,平均像素误差就是根据预测目标中心位置与真实位置的像素距离作为误差值,该值越大,说明误差越大。最终结果区帧平均。
平均重叠率
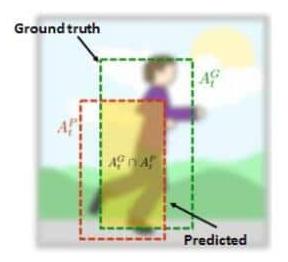
下面这张图应该可以说明问题,平均重叠率O是以面积来衡量的

O=At⋂AgtAt⋃Agt
时间鲁棒性
像素误差和重叠率都可以做成成功率图(Success Plot)—— Precision plot、Success Plot,这个大家在Paper里都已经见过了,还有一种成功率图,就是鲁棒性成功率图,又分为时间鲁棒性(TRE)和空间鲁棒性(SRE),不测试鲁棒性,那么就叫做一遍成功率(OPE)
OTB对时间鲁棒性的测试是通过将视频序列在时间轴上平均找出20个点作为起点,终点还是原来的最后一帧,这样通过对20段视频序列运行算法,绘制平均的重叠率图或者像素误差图,这样就完成了时间鲁棒性的测试。
空间鲁棒性
与时间鲁棒性一样,一段视频在第一帧,以真实位置稍作偏移,就是说测试初始化位置有偏差的目标序列。这样测试十二段(八个方向,四个尺度),具体方法参照OTB-2013的Paper。这样十二段序列的评价成功率曲线,就是鲁棒性的曲线。
VOT
VOT自2013年发展到现在,评价体系比较成熟,也越来越受欢迎。其中主要有EAO指标和EFO指标
EAO指标
EAO是Expect Average Overlaprate的缩写
顾名思义的,精度的衡量方式是平均重叠率
鲁棒性使用跟踪算法跟丢目标的次数来衡量
通过一种方式,在一张图中同时反映精度和鲁棒性,这就是EAO图
EFO指标
Equivalent Filter Operations
EFO是用来衡量速度的指标,以往我们谈速度,都需要谈硬件,再说fps,但是通过EFO指标可以减少硬件差异带来的影响。
首先测试该机器在600×600图像上,对每个像素进行30×30滤波的时间。
然后将跟踪算法耗时除以该机器上进行以上滤波操作的时间,这样得到的值就是EFO值,最大程度的减少了硬件的影响。


