Prometheus对接VictoriaMetrics
转载自博客:https://blog.csdn.net/alex_yangchuansheng/article/details/107852927
4. 实践
确定好了方案之后,下面来进行动手实践。
部署 VictoriaMetrics
首先部署一个单实例的 VictoriaMetrics,完整的 yaml 如下:
kind: PersistentVolumeClaim
apiVersion: v1
metadata:
  name: victoriametrics
  namespace: kube-system
spec:
  accessModes:
    - ReadWriteOnce
  resources:
    requests:
      storage: 100Gi
---
apiVersion: apps/v1
kind: StatefulSet
metadata:
  labels:
    app: victoriametrics
  name: victoriametrics
  namespace: kube-system
spec:
  serviceName: pvictoriametrics
  selector:
    matchLabels:
      app: victoriametrics
  replicas: 1
  template:
    metadata:
      labels:
        app: victoriametrics
    spec:
      nodeSelector:
        blog: "true"
      containers:
      - args:
        - --storageDataPath=/storage
        - --httpListenAddr=:8428
        - --retentionPeriod=1
        image: victoriametrics/victoria-metrics
        imagePullPolicy: IfNotPresent
        name: victoriametrics
        ports:
        - containerPort: 8428
          protocol: TCP
        readinessProbe:
          httpGet:
            path: /health
            port: 8428
          initialDelaySeconds: 30
          timeoutSeconds: 30
        livenessProbe:
          httpGet:
            path: /health
            port: 8428
          initialDelaySeconds: 120
          timeoutSeconds: 30
        resources:
          limits:
            cpu: 2000m
            memory: 2000Mi
          requests:
            cpu: 2000m
            memory: 2000Mi
        volumeMounts:
        - mountPath: /storage
          name: storage-volume
      restartPolicy: Always
      priorityClassName: system-cluster-critical
      volumes:
      - name: storage-volume
        persistentVolumeClaim:
          claimName: victoriametrics
---
apiVersion: v1
kind: Service
metadata:
  labels:
    app: victoriametrics
  name: victoriametrics
  namespace: kube-system
spec:
  ports:
  - name: http
    port: 8428
    protocol: TCP
    targetPort: 8428
  selector:
    app: victoriametrics
  type: ClusterIP
有几个启动参数需要注意:
storageDataPath : 数据目录的路径。VictoriaMetrics 将所有数据存储在此目录中。
retentionPeriod : 数据的保留期限(以月为单位)。旧数据将自动删除。默认期限为1个月。
httpListenAddr : 用于监听 HTTP 请求的 TCP 地址。默认情况下,它在所有网络接口上监听端口 8428。
给 namespace 打标签
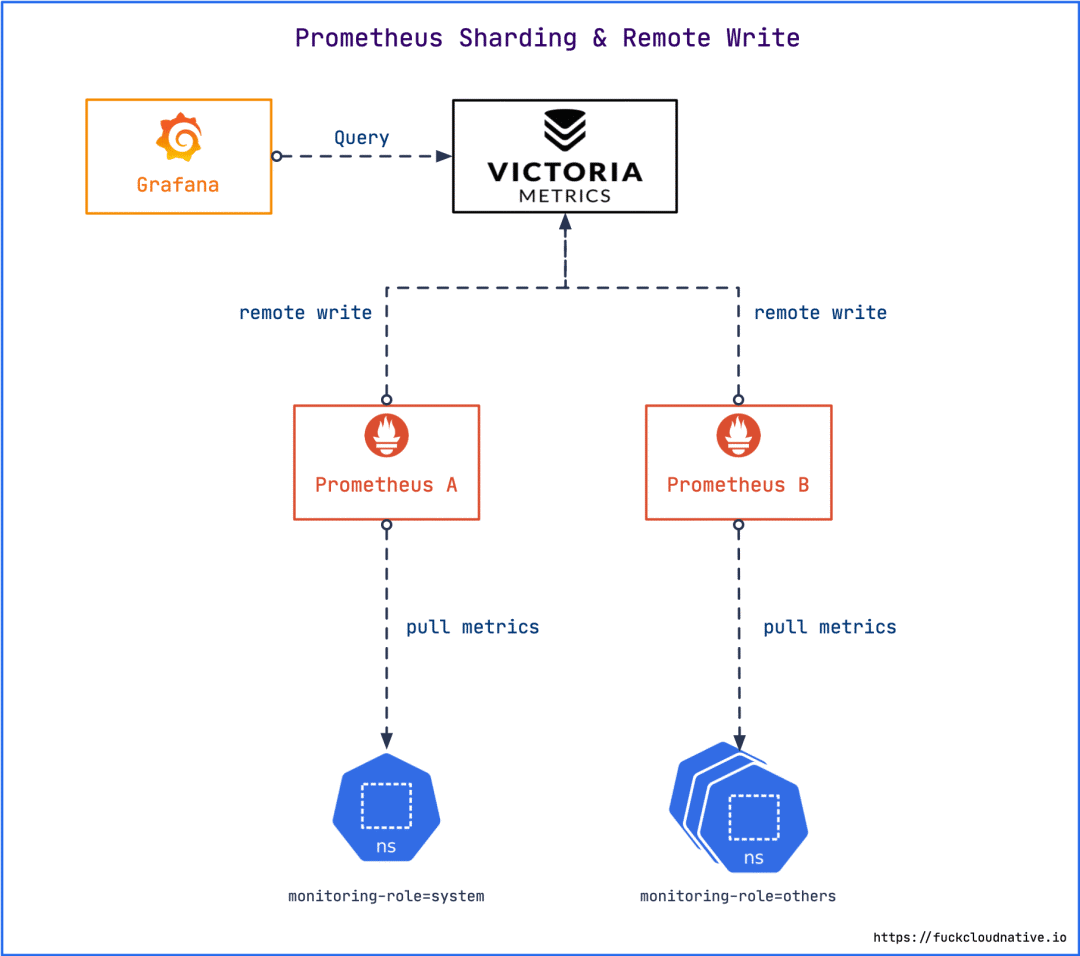
为了限定抓取 target 的 namespace,我们需要给 namespace 打上标签,使每个 Prometheus 实例只抓取特定 namespace 的指标。根据上文的方案,需要给 kube-system 打上标签 monitoring-role=system:
$ kubectl label ns kube-system monitoring-role=system
给其他的 namespace 打上标签 monitoring-role=others。例如:
$ kubectl label ns monitoring monitoring-role=others
$ kubectl label ns default monitoring-role=other
拆分 Prometheus
下一步是拆分 Prometheus 实例,根据上面的方案需要拆分成两个实例,一个用来监控 kube-system namespace,另一个用来监控其他 namespace:
# prometheus-prometheus-system.yaml
apiVersion: monitoring.coreos.com/v1
kind: Prometheus
metadata:
  labels:
    prometheus: system
  name: system
  namespace: monitoring
spec:
  remoteWrite:
    - url: http://victoriametrics.kube-system.svc.cluster.local:8428/api/v1/write
      queueConfig:
        maxSamplesPerSend: 10000
  retention: 2h
  alerting:
    alertmanagers:
    - name: alertmanager-main
      namespace: monitoring
      port: web
  image: quay.io/prometheus/prometheus:v2.17.2
  nodeSelector:
    beta.kubernetes.io/os: linux
  podMonitorNamespaceSelector:
    matchLabels:
      monitoring-role: system
  podMonitorSelector: {}
  replicas: 1
  resources:
    requests:
      memory: 400Mi
    limits:
      memory: 2Gi
  ruleSelector:
    matchLabels:
      prometheus: system
      role: alert-rules
  securityContext:
    fsGroup: 2000
    runAsNonRoot: true
    runAsUser: 1000
  serviceAccountName: prometheus-k8s
  serviceMonitorNamespaceSelector:
    matchLabels:
      monitoring-role: system
  serviceMonitorSelector: {}
  version: v2.17.2
---
apiVersion: monitoring.coreos.com/v1
kind: Prometheus
metadata:
  labels:
    prometheus: others
  name: others
  namespace: monitoring
spec:
  remoteWrite:
    - url: http://victoriametrics.kube-system.svc.cluster.local:8428/api/v1/write
      queueConfig:
        maxSamplesPerSend: 10000
  retention: 2h
  alerting:
    alertmanagers:
    - name: alertmanager-main
      namespace: monitoring
      port: web
  image: quay.io/prometheus/prometheus:v2.17.2
  nodeSelector:
    beta.kubernetes.io/os: linux
  podMonitorNamespaceSelector:
    matchLabels:
      monitoring-role: others
  podMonitorSelector: {}
  replicas: 1
  resources:
    requests:
      memory: 400Mi
    limits:
      memory: 2Gi
  ruleSelector:
    matchLabels:
      prometheus: others
      role: alert-rules
  securityContext:
    fsGroup: 2000
    runAsNonRoot: true
    runAsUser: 1000
  serviceAccountName: prometheus-k8s
  serviceMonitorNamespaceSelector:
    matchLabels:
      monitoring-role: others
  serviceMonitorSelector: {}
  additionalScrapeConfigs:
    name: additional-scrape-configs
    key: prometheus-additional.yaml
  version: v2.17.2
需要注意的配置:
通过 remoteWrite 指定 remote write 写入的远程存储。
通过 ruleSelector 指定 PrometheusRule。
限制内存使用上限为 2Gi,可根据实际情况自行调整。
通过 retention 指定数据在本地磁盘的保存时间为 2 小时。因为指定了远程存储,本地不需要保存那么长时间,尽量缩短。
Prometheus 的自定义配置可以通过 additionalScrapeConfigs 在 others 实例中指定,当然你也可以继续拆分,放到其他实例中。
修改 Grafana 数据源
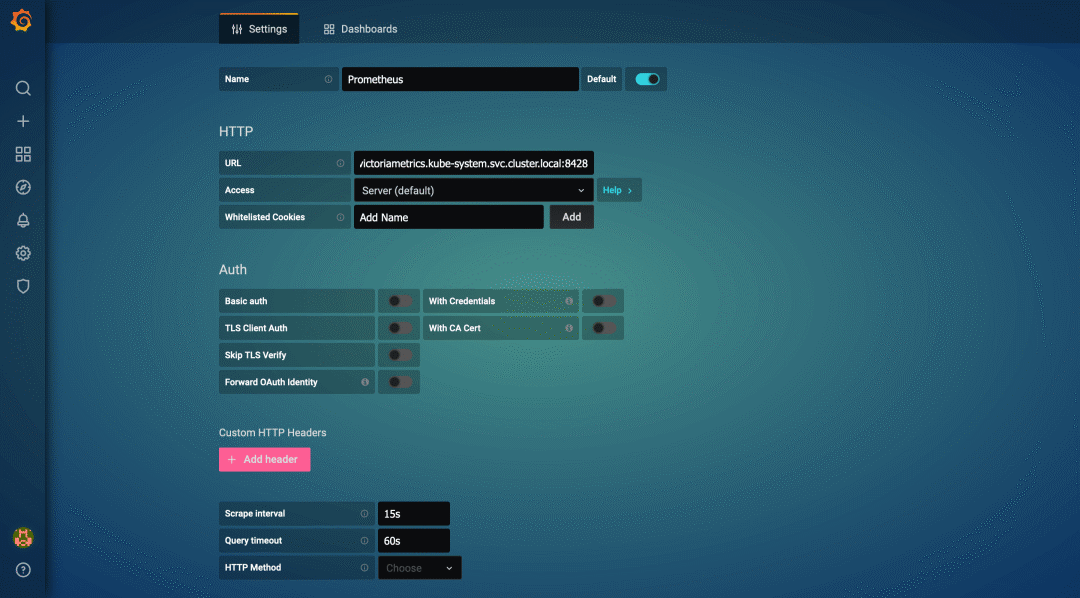
Prometheus 拆分成功之后,最后还要修改 Grafana 的数据源为 VictoriaMetrics 的地址,这样就可以在 Grafana 中查看全局视图,也能聚合查询。
打开 Grafana 的设置页面,将数据源修改为 http://victoriametrics.kube-system.svc.cluster.local:8428:
脚注
[1]
VictoriaMetrics: https://github.com/VictoriaMetrics/VictoriaMetrics
[2]
VictoriaMetrics: https://github.com/VictoriaMetrics/VictoriaMetrics
[3]
prometheus-rules-system.yaml: https://gist.github.com/yangchuansheng/4310ae9f41513899dc5f0176cdf804b1
[4]
prometheus-rules-others.yaml: https://gist.github.com/yangchuansheng/102595fc50436cf4a2ce18744467718c
posted on 2024-07-24 22:14 luzhouxiaoshuai 阅读(109) 评论(0) 编辑 收藏 举报