

echarts组件自适应实现
父组件
<template>
  <div style="display: flex; justify-content: center">
    <LineChart
      :style="{
        top: '10px',
        left: '120px',
        margin: '0px 90px 0px -150px',
      }"
      ref="chart"
      :dates="chartData.dates"
      :ai-case-count="chartData.aiCaseCount"
      :adopted-count="chartData.adoptedCount"
      :containerWidth="a"
      :containerHeight="b"
    />
  </div>
</template>

  <script>
import LineChart from "../echart/common/chart.vue";

export default {
  components: { LineChart },
  data() {
    return {
      a: "100%",
      b: "100%",
      chartData: {
        dates: ["2023-01"],
        aiCaseCount: [120],
        adoptedCount: [80],
      },
    };
  },
  created() {
    this.handleResize();
    this.aa();
  },
  mounted() {
    window.addEventListener("resize", this.handleResize);
  },

  beforeDestroy() {
    window.removeEventListener("resize", this.handleResize);
  },
  methods: {
    handleResize() {
      this.a = document.body.clientWidth / 1.3 + "px";
      this.b = document.body.clientHeight / 1.3 + "px";
    },
    aa() {
      setTimeout(() => {
        this.chartData = {
          dates: [
            "2023-01",
            "2023-02",
            "2023-03",
            "2023-04",
            "2023-02",
            "2023-03",
            "2023-04",
            "2023-02",
            "2023-03",
            "2023-04",
          ],
          aiCaseCount: [120, 150, 210, 180, 150, 210, 180, 150, 210, 180],
          adoptedCount: [80, 10, 150, 110, 110, 120, 30, 50, 150, 130],
        };
      }, 10);
    },
  },
};
</script>
子组件
<!-- LineChart.vue -->
<template>
  <div class="chart-container">
    <div
      ref="chart"
      :style="{ width: containerWidth, height: containerHeight }"
    ></div>
  </div>
</template>

  <script>
import echarts from "echarts";
import { debounce } from "lodash";

export default {
  props: {
    dates: { type: Array, required: true },
    aiCaseCount: { type: Array, required: true },
    adoptedCount: { type: Array, required: true },
    containerWidth: { type: String, default: "1200px" },
    containerHeight: { type: String, default: "500px" },
  },

  data() {
    return {
      chartInstance: null,
    };
  },

  watch: {
    $props: {
      handler: debounce(function () {
        this.updateChart();
      }, 300),
      deep: true,
      immediate: true,
    },
  },

  mounted() {
    this.initChart();
    window.addEventListener("resize", this.handleResize);
  },

  beforeDestroy() {
    window.removeEventListener("resize", this.handleResize);
    this.chartInstance?.dispose();
  },

  methods: {
    initChart() {
      this.chartInstance = echarts.init(this.$refs.chart);
      this.updateChart();
    },

    updateChart() {
      const option = {
        backgroundColor: "#fff",
        title: {
          top: 20,
          text: "AI用例采纳情况",
          //   subtext: "数据更新于" + new Date().toLocaleDateString(),
          left: "center",
          textStyle: {
            margin: "100px",
            color: "#2c3e50",
            fontSize: 18,
            fontWeight: "bold",
          },
        },
        tooltip: {
          trigger: "axis",
          axisPointer: { type: "cross" },
        },
        legend: {
          data: ["AI用例生成数量", "采纳数量"],
          bottom: 20,
          textStyle: { color: "#666" },
        },
        grid: {
          top: 100,
          left: "3%",
          right: "4%",
          bottom: "15%",
          containLabel: true,
        },
        xAxis: {
          type: "category",
          data: this.dates,
          axisLabel: { color: "#666" },
        },
        yAxis: {
          type: "value",
          name: "单位:条",
          nameTextStyle: { color: "#666" },
        },
        series: [
          {
            areaStyle: { color: "#f5efa3" },
            name: "AI用例生成数量",
            type: "line",
            radius: [0, "50%"],
            smooth: true,
            data: this.aiCaseCount,
            itemStyle: { color: "#f5efa3" },
          },
          {
            areaStyle: { color: "#2ee4b7" },
            name: "采纳数量",
            type: "line",
            radius: [0, "50%"],
            smooth: true,
            data: this.adoptedCount,
            itemStyle: { color: "#2ee4b7" },
          },
        ],
      };
      this.chartInstance.setOption(option);
    },

    handleResize: debounce(function () {
      this.chartInstance?.resize();
    }, 300),
  },
};
</script>

  <style scoped>
.chart-container {
  position: relative;
  width: v-bind("containerWidth");
  height: v-bind("containerHeight");
}
</style>
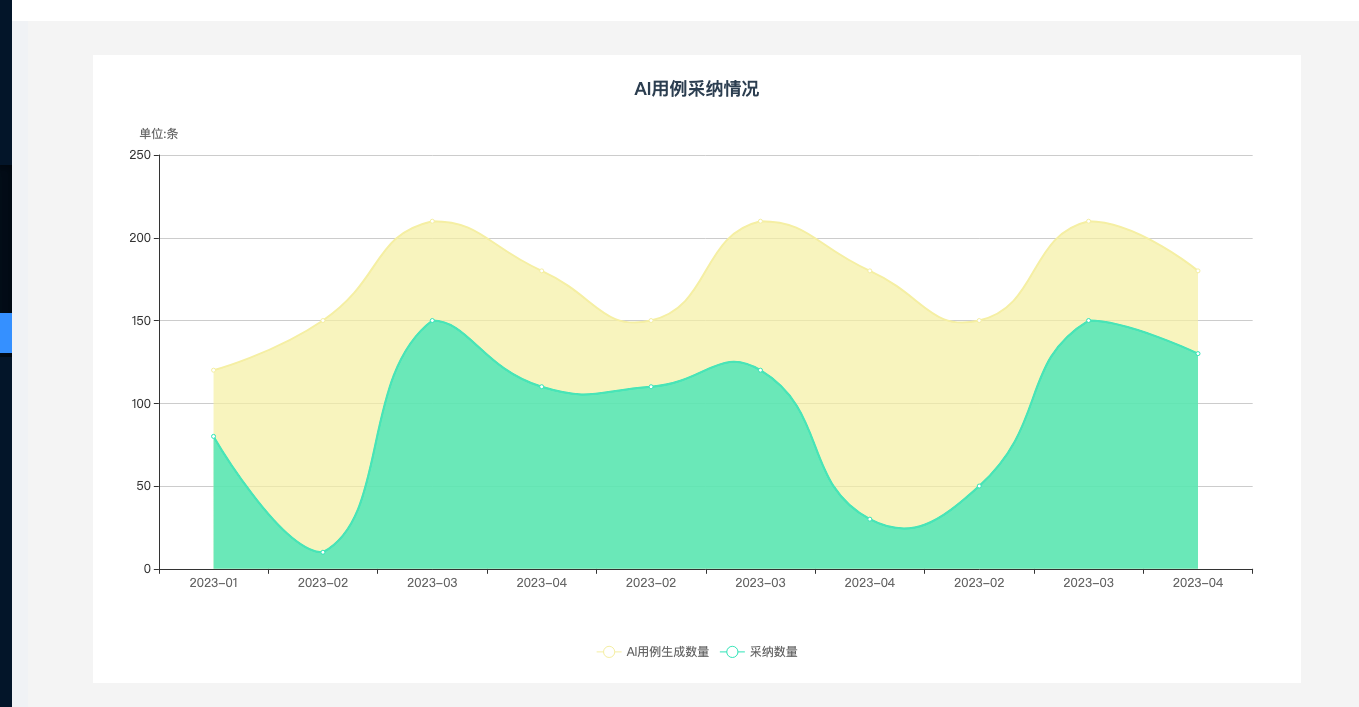
实现效果
可以自适应大小
附件:
官网: https://echarts.apache.org/examples/zh/index.html#chart-type-line
版本: "echarts": "^4.9.0",
分类:
前端 / echarts


【推荐】国内首个AI IDE,深度理解中文开发场景,立即下载体验Trae
【推荐】编程新体验,更懂你的AI,立即体验豆包MarsCode编程助手
【推荐】抖音旗下AI助手豆包,你的智能百科全书,全免费不限次数
【推荐】轻量又高性能的 SSH 工具 IShell:AI 加持,快人一步
· 分享一个免费、快速、无限量使用的满血 DeepSeek R1 模型,支持深度思考和联网搜索!
· 使用C#创建一个MCP客户端
· 基于 Docker 搭建 FRP 内网穿透开源项目(很简单哒)
· ollama系列1:轻松3步本地部署deepseek,普通电脑可用
· 按钮权限的设计及实现
2023-03-06 vue上传excel获取表格数据(亲测ok)
2018-03-06 并发和并行和压测 、对带宽的理解解释