

折线图
import pyecharts
from pyecharts.charts import Bar,Line
from pyecharts import options as opts
def line_base():
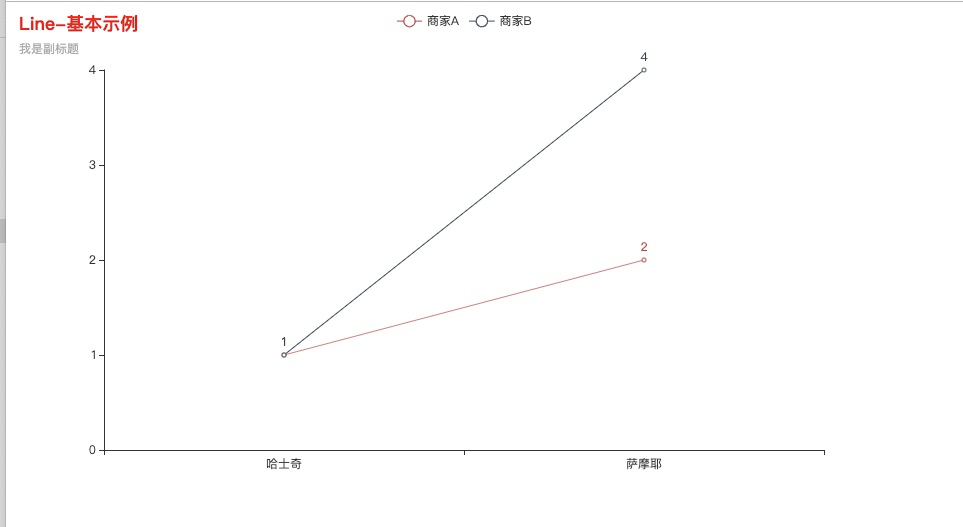
c = (
Line()
.add_xaxis(['哈士奇', '萨摩耶'])
.add_yaxis("商家A", [1,2,3])
.add_yaxis("商家B", [1,4,7])
.set_global_opts(title_opts=opts.TitleOpts(title="Line-基本示例",subtitle="我是副标题",title_textstyle_opts=opts.TextStyleOpts(color="red"))
))
return c
line_base().render()
效果:
报告放置位置设置
line_base().render("/Users/lucax/Desktop/test实验室/render2.html")
