echarts多表联动初步
在大数据的学习过程中,后台数据分析、输出很重要,但最终是将其表现在图表上,使用echarts进行数据可视化
官网上给出的数据可视化是饼图和折线图的联动,饼图和其他图的联动基本大同小异
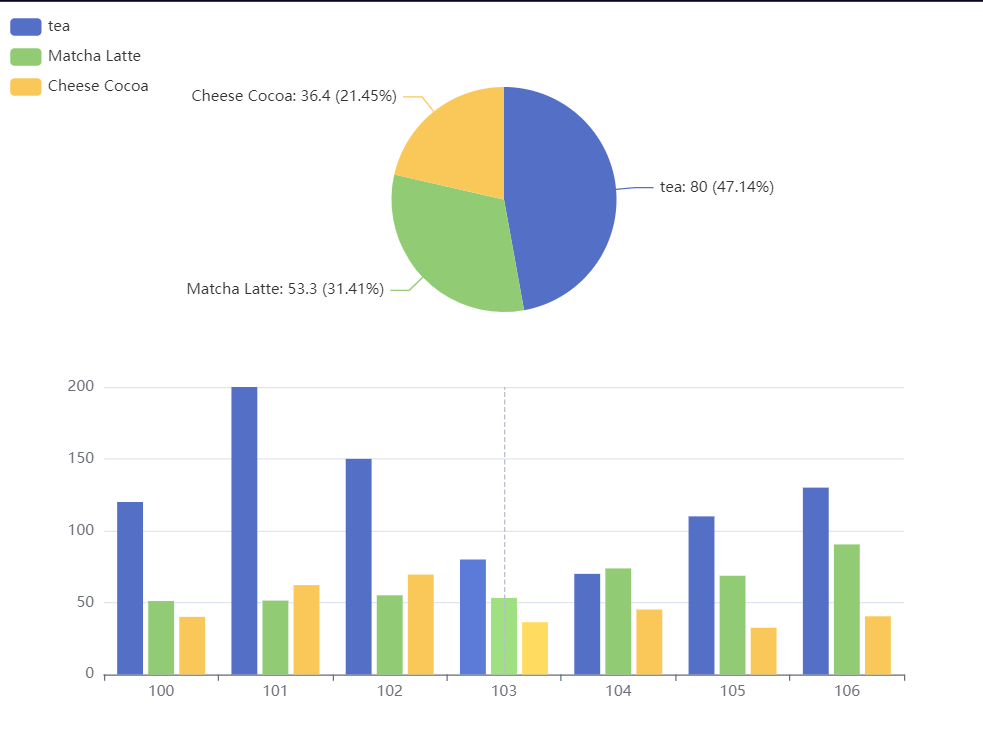
这是我根据官网写的饼图和柱状图联动
<!DOCTYPE html>
<html lang="en">
<head>
    <meta charset="UTF-8">
    <meta http-equiv="X-UA-Compatible" content="IE=edge">
    <meta name="viewport" content="width=device-width, initial-scale=1.0">
    <script src="JS/echart.js"></script>
    <title>Document</title>
</head>
<body>
    <div id="main" style="width:800px;height:600px;"></div>
</body>
<script>
    var chartDom = document.getElementById('main');
    var myChart = echarts.init(chartDom);
    var option;

    setTimeout(function(){
        option = {
<!--关键点①-->
            tooltip: {
                trigger: 'axis',
                showContent:false
            },
            legend: {
                orient: 'vertical',
                left: 'left'
            },
            dataset:{
                source:[
                    ['date', '100', '101', '102', '103', '104', '105', '106'],
                    ['tea', 120, 200, 150, 80, 70, 110, 130],
                    ['Matcha Latte', 51.1, 51.4, 55.1, 53.3, 73.8, 68.7,90.5],
                    ['Cheese Cocoa', 40.1, 62.2, 69.5, 36.4, 45.2, 32.5,40.5],
                ]
            },
            xAxis:{type:'category'},
            yAxis:{fridIndex:0},
            grid:{top:'50%'},
            series:[
                {
                    type:'bar',
                    smooth: true,
                    seriesLayoutBy: 'row',
                    emphasis: { focus: 'series' }
                },
                {
                    type: 'bar',
                    smooth: true,
                    seriesLayoutBy: 'row',
                    emphasis: { focus: 'series' }
                },
                {
                    type: 'bar',
                    smooth: true,
                    seriesLayoutBy: 'row',
                    emphasis: { focus: 'series' }
                },
                {
                    type:'pie',
                    id:'pie',
                    radius:'30%',
                    center:['50%','25%'],
                    emphasis:{
                        focus:'self'
                    },
                    label:{
                        formatter:'{b}:{@100} ({d}%)'
                    },
                    encode:{
                        itemName:'date',
                        value:'100',
                        tooltip:'100'
                    }
                }
            ]
        };
<!--关键点②-->
        myChart.on('updateAxisPointer',function(event){
            const xAxisInfo = event.axesInfo[0];
            if (xAxisInfo) {
                const dimension = xAxisInfo.value + 1;
                myChart.setOption({
                    series: {
                        id: 'pie',
                        label: {
                            formatter: '{b}: {@[' + dimension + ']} ({d}%)'
                        },
                        encode: {
                            value: dimension,
                            tooltip: dimension
                        }
                    }
                });
            }
        });
        myChart.setOption(option);
    });

</script>
</html>
实现效果:


【推荐】国内首个AI IDE,深度理解中文开发场景,立即下载体验Trae
【推荐】编程新体验,更懂你的AI,立即体验豆包MarsCode编程助手
【推荐】抖音旗下AI助手豆包,你的智能百科全书,全免费不限次数
【推荐】轻量又高性能的 SSH 工具 IShell:AI 加持,快人一步
· 【自荐】一款简洁、开源的在线白板工具 Drawnix
· 没有Manus邀请码?试试免邀请码的MGX或者开源的OpenManus吧
· 无需6万激活码!GitHub神秘组织3小时极速复刻Manus,手把手教你使用OpenManus搭建本
· C#/.NET/.NET Core优秀项目和框架2025年2月简报
· DeepSeek在M芯片Mac上本地化部署