快速定位堆内存溢出OOM——Jprofile
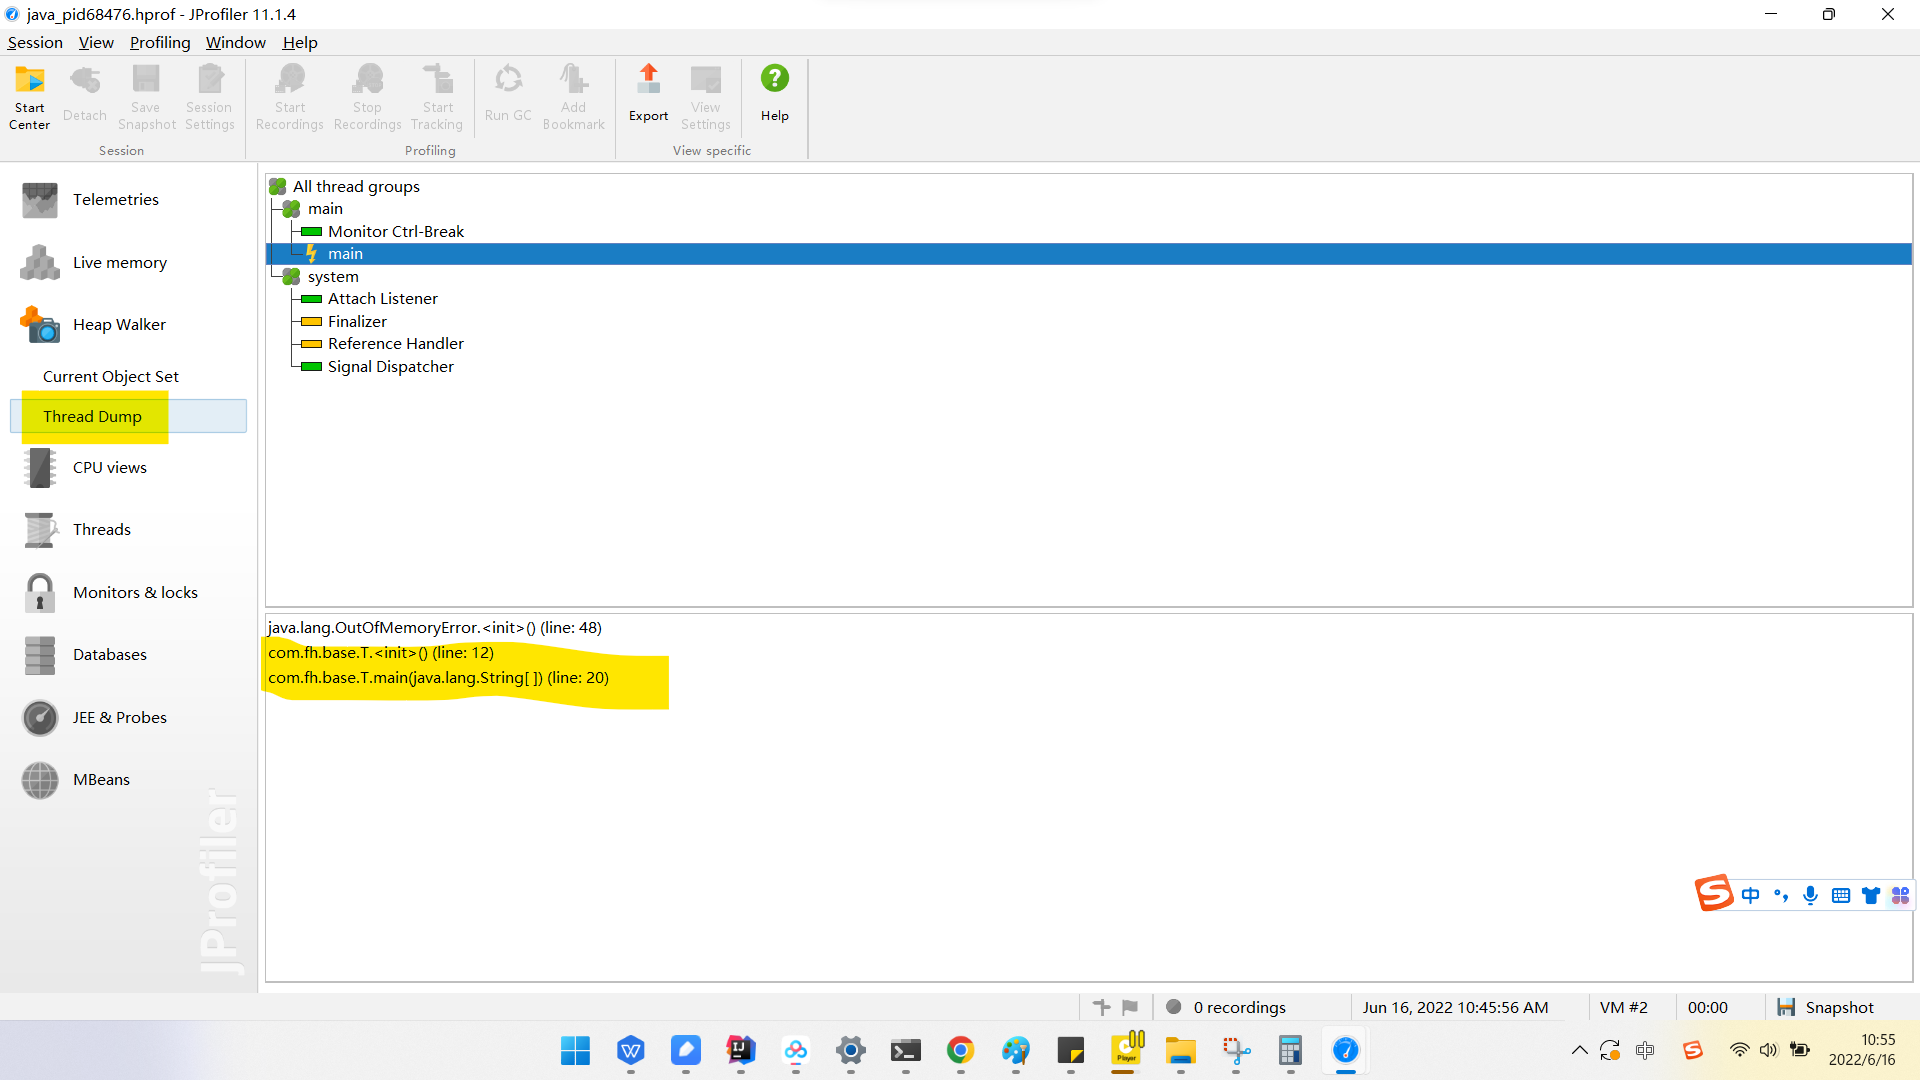
堆内存快照Jprofile
- 分析Dump内存文件,快速定位内存泄漏
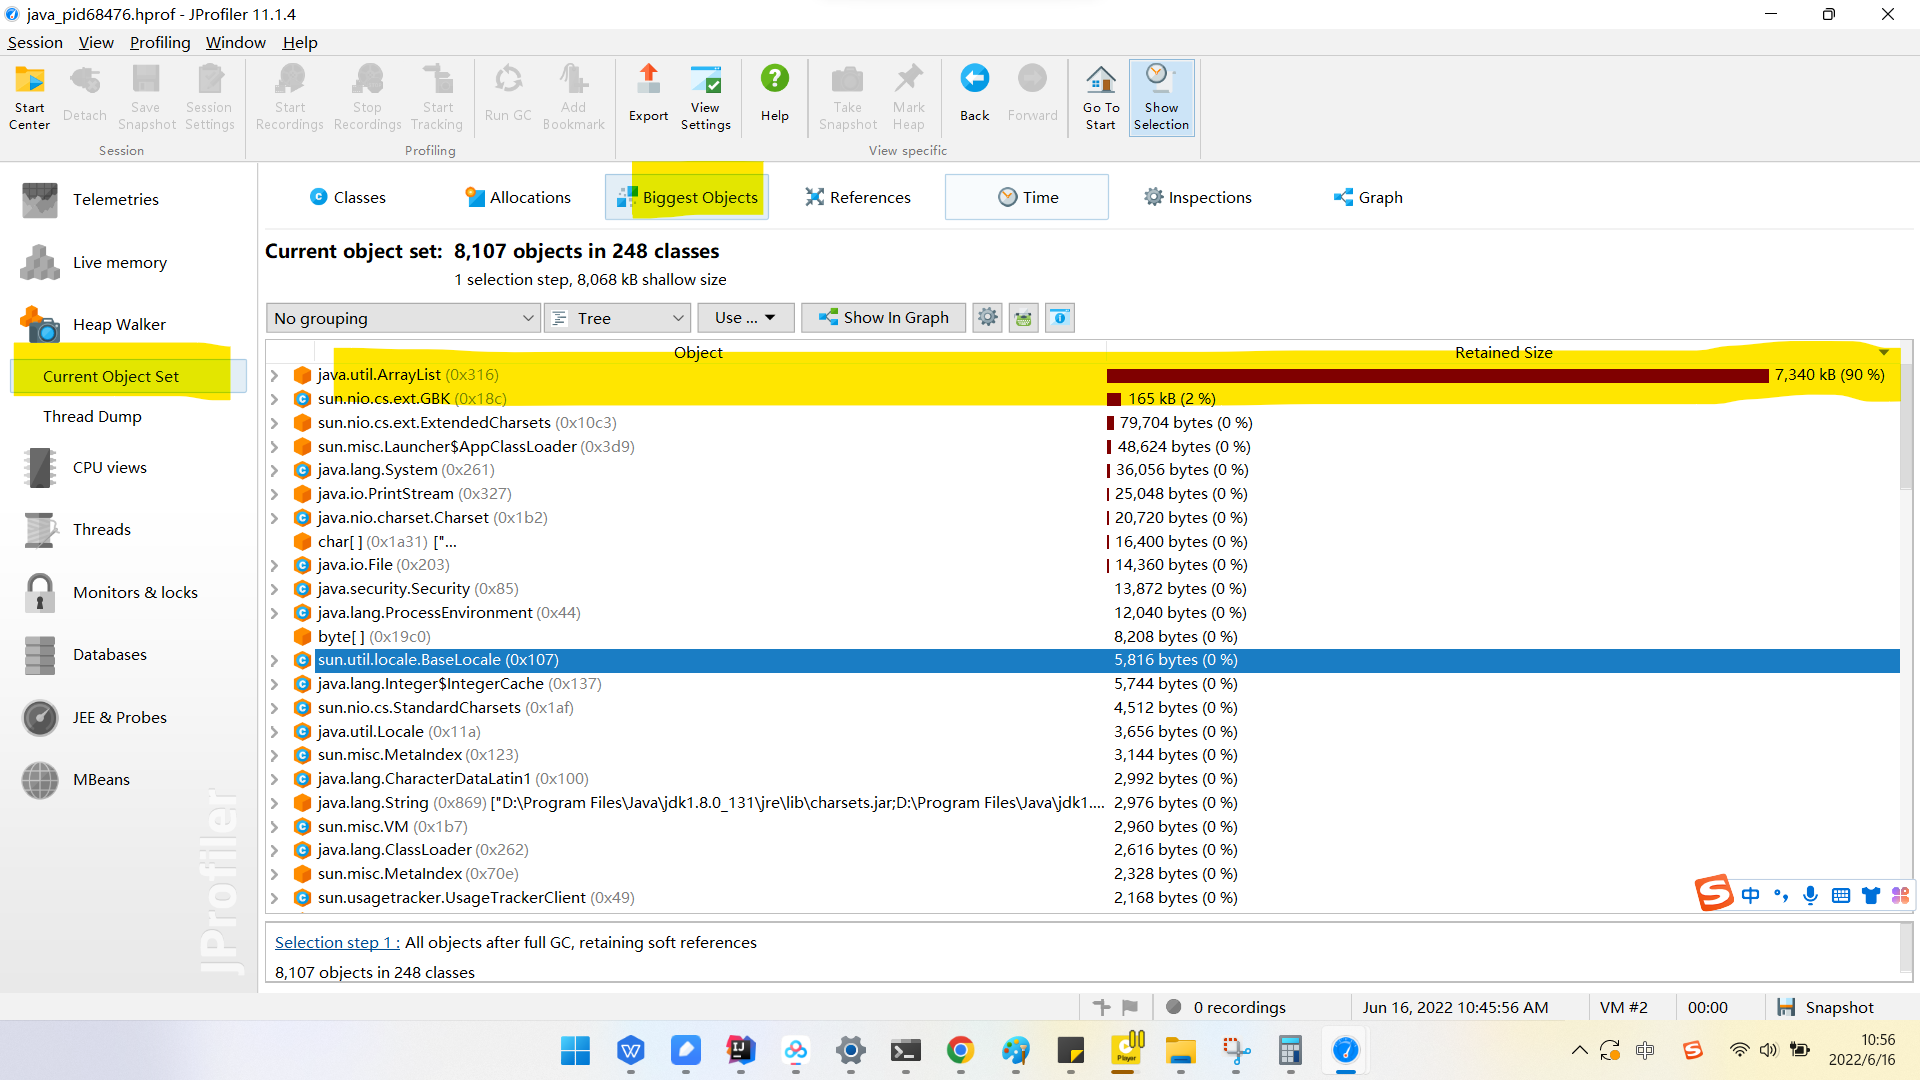
- 获得堆中的数据
- 获得大的对象
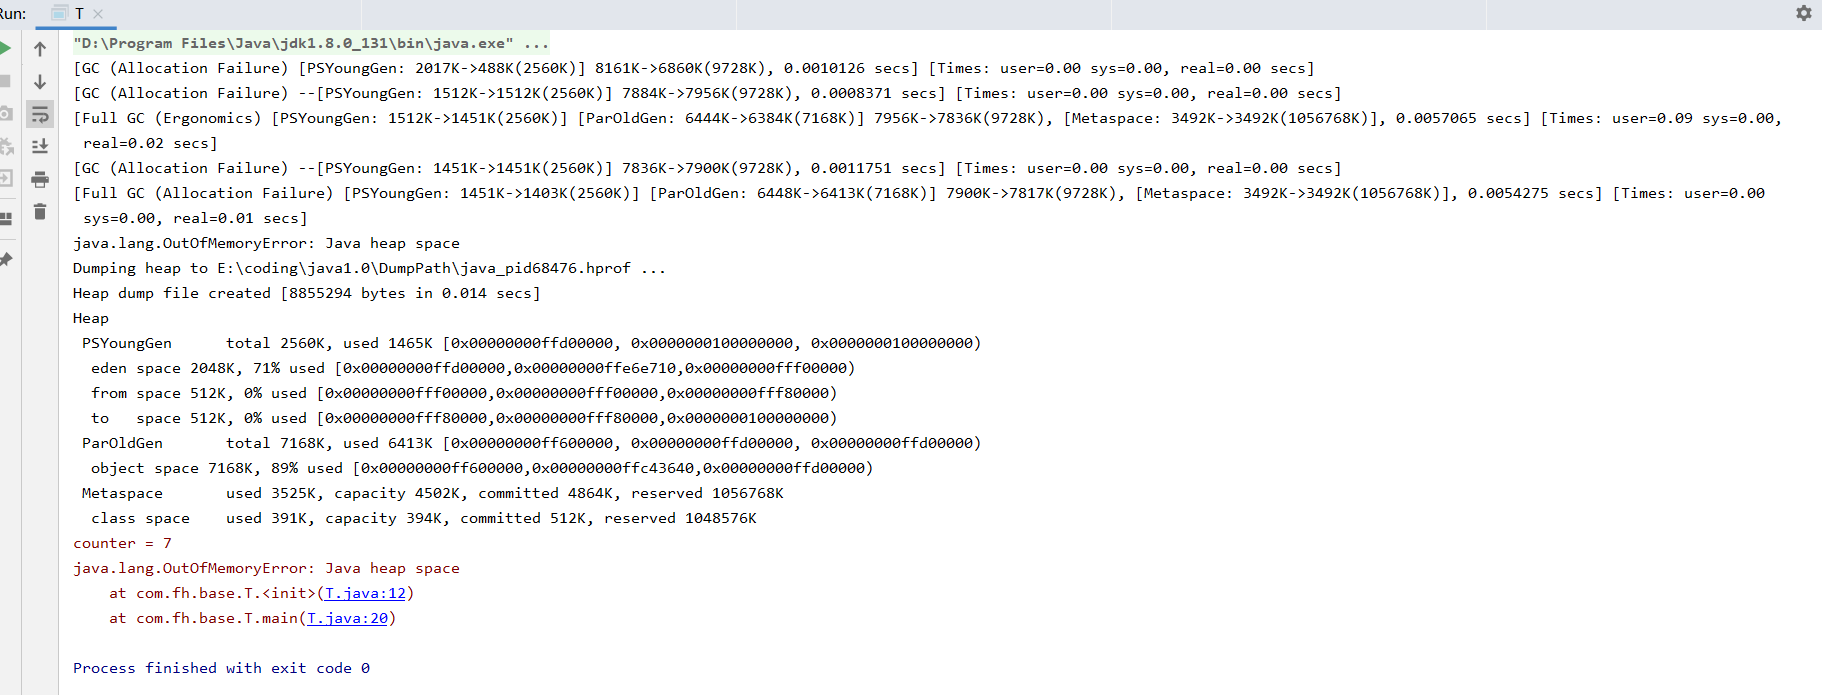
/**
 * 设定虚拟机参数
 * -Xms10M -Xmx10M -XX:+PrintGCDetails -XX:+HeapDumpOnOutOfMemoryError -XX:HeapDumpPath=E:\coding\java1.0\DumpPath
 */
public class T {
    byte[] b = new byte[1 * 1024 * 1024];

    public static void main(String[] args) {

        List<T> list = new ArrayList<T>();
        int counter = 0;
        try {
            while (true) {
                list.add(new T());
                counter++;
            }
        } catch (Throwable e) {
            System.err.println("counter = " + counter);
            e.printStackTrace();
        }
    }
}

 浙公网安备 33010602011771号