echarts生成mysql表词云
访问数据库的数据绘制词云
数据可视化echarts+mysql+python+flask
下面是后端代码:
|
1
2
3
4
5
6
7
8
9
10
11
12
13
14
15
16
17
18
19
20
21
22
23
24
25
26
27
28
29
30
31
32
33
|
from flask import Flask,render_templateimport jsonimport pymysqlapp = Flask(__name__)@app.route('/')def hello_world():return render_template('index1.html')@app.route('/test', methods=['POST'])def mytest():con = pymysql.connect(host='localhost',user='root',passwd='cbj123',db='bigdata',port=3306,charset='utf8')cur = con.cursor()sql = 'select * from hero'cur.execute(sql)see = cur.fetchall()word = []count = []jsonData = {}for data in see:word.append(data[0])count.append(data[1])jsonData['word'] = wordjsonData['count'] = countj = json.dumps(jsonData)cur.close()con.close()return (j)if __name__ == '__main__':app.run(debug=True) |
下面是前端代码:
|
1
2
3
4
5
6
7
8
9
10
11
12
13
14
15
16
17
18
19
20
21
22
23
24
25
26
27
28
29
30
31
32
33
34
35
36
37
38
39
40
41
42
43
44
45
46
47
48
49
50
51
52
53
54
55
56
57
58
59
60
61
62
63
64
65
66
67
68
69
70
71
72
73
74
75
76
77
78
79
80
81
82
83
84
85
|
<!DOCTYPE html><html lang="en"><head><meta charset="UTF-8"><title>Title</title><!-- 引入 echarts.js --><script src="http://libs.baidu.com/jquery/1.7.2/jquery.min.js"></script><!-- 引入jquery.js --><script src="https://cdn.bootcss.com/echarts/4.1.0.rc2/echarts.min.js"></script><script src="../static/echarts-wordcloud.min.js"></script></head><body><div id="main" style="width:100%;height: 800px;border: 1px solid black"></div><script type="text/javascript">var myChart = echarts.init(document.getElementById('main'));var app={word1:[],count1:[]};$(document).ready(function () {getData();console.log(app.word1);console.log(app.count1);});function getData() {$.ajax({url: '/test',data: {},type: 'POST',async: false,dataType: 'json',success: function (data) {app.word1 = data.word;app.count1 = data.count;}});}getData();var aa=[];for(var i = 0;i<app.word1.length;i++){aa.push({name:app.word1[i],value: app.count1[i]})}option = {title: {text: '词云',x: 'center',textStyle: {fontSize: 23}},backgroundColor: '#F7F7F7',tooltip: {show: true},series: [{type: 'wordCloud',textPadding: 0,textStyle: {normal: {color: function() {return 'rgb(' + [Math.round(Math.random() * 160),Math.round(Math.random() * 160),Math.round(Math.random() * 160)].join(',') + ')';}}},data: aa}]};myChart.setOption(option);</script></body></html> |
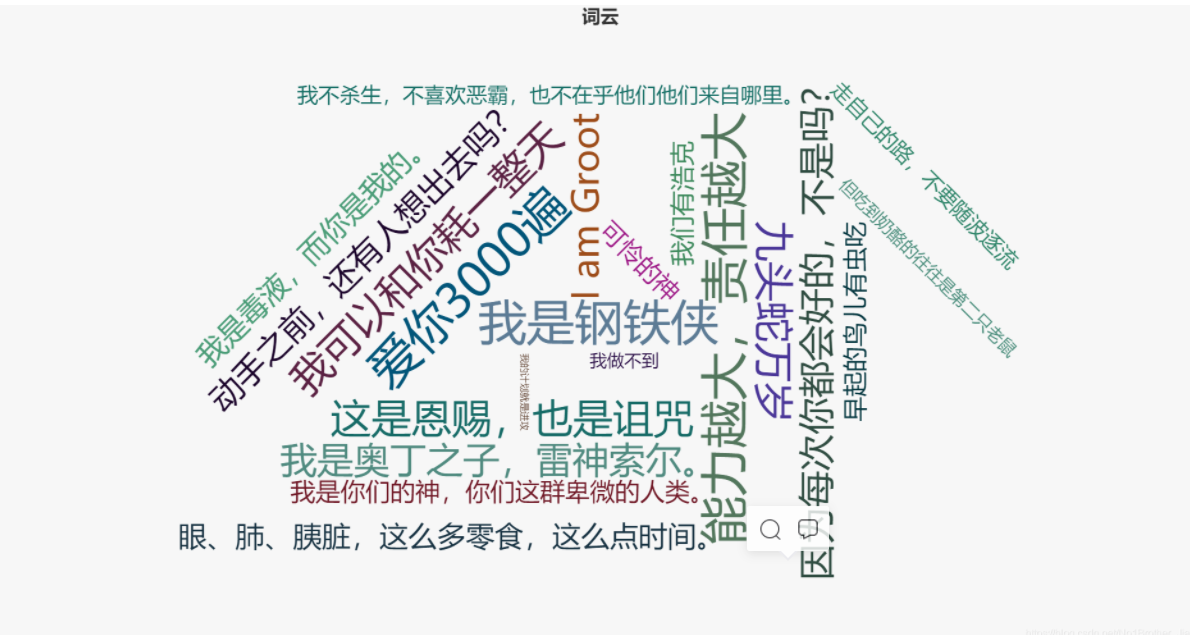
效果如下:
转载于:https://blog.csdn.net/No1Brother_Jian/article/details/90754499
