echarts 技巧自己的一些记录
1、不要输出 window["echarts"].init(chart) ,会卡死。
let chart = document.getElementById("chart_id");//chartid为自定义charts的id
if (chart != null) {
  let myChart = window["echarts"].init(chart);
  //console.log("myChart = ", myChart)//千万别输出,会卡死
}
2、angularjs中绑定echarts,建议使用ng-repeat绑定数组,否则动态切换echarts会没有效果。
<div id="chart_my" style="min-height: 300px;" class="sam-Echarts" ng-if="vm.charts!=null" ng-repeat="option in vm.charts" sam-Echarts="option">
</div>
// 为echarts自定义的directives -- samEcharts
export default class directive implements ng.IDirective {
    static $instance = (): ng.IDirective => {
        return new directive();
    };
    constructor() {
    }
    scope = {
        samEcharts: "=",
        samMychart: "="
    };
    restrict = 'AE';
    replace = true;
    link(scope: ng.IScope, element: ng.IRootElementService, attrs: any, ctrl: any) {
        if (scope.samEcharts) {
            var myChart = window["echarts"].init(element[0]);
            myChart.setOption(scope.samEcharts);
            window.addEventListener("resize", x => {
                myChart.resize();
            });
            scope.$on("onShrinkNav", x => {
                myChart.resize();
            });
            if (scope.samMychart) {
                scope.samMychart = myChart;
            }
        }
    };
}
class Controller {
    constructor() {
    }
}
3、富文本,a|表示自定义的标签,|{b}|{c}表示文本内容,貌似c为name,b为value,a为series?
label: {
    normal: {
        formatter: '{a|{c}}\n{b|{b}}\n{hr|}\n\n\n',
        rich: {
            a: {
                fontSize: 18,
                lineHeight: 25,
                align: 'left'
            },
            b: {
                align: 'left',
                fontSize: 12,
                lineHeight: 12,
                color: "#999999"
            },
            hr: { //下划线
                borderColor: 'auto',
                width: '105%',
                borderWidth: 1,
                height: 0,
                margin: [10, 0]
            }
        }
    }
}
4、图表内部可拖动:dataZoom的type=inside则内部可拖动,为slider则外部有滚动条
// 拖动
dataZoom: [
  {
     type: 'inside',
     // throttle: '50',
     minValueSpan: 5,
     maxValueSpan: 5,
     start: 50,
     end: 100
  }
]
// 底部拖动条
dataZoom: xData.length > 6 ? [{
    type: 'slider',
    show: true,
    xAxisIndex: [0],
    bottom: 55,
    left: 30,
    right: 30,
    backgroundColor: "#f4f4f4",  //组件的背景颜色
    fillerColor: "#CEF0FE",  //选中范围的填充颜色。
    dataBackground: {
        lineStyle: {
            show: false,
            opacity: 0
        },
        areaStyle: {
            show: false,
            opacity: 0
        }
    },
    textStyle: {
        color: "transparent"
    },
    borderColor: "#fff",
    handleIcon: 'path://M306.1,413c0,2.2-1.8,4-4,4h-59.8c-2.2,0-4-1.8-4-4V200.8c0-2.2,1.8-4,4-4h59.8c2.2,0,4,1.8,4,4V413z',
    handleSize: '300%',
    // handleSize: 0,
    handleStyle: { color: "#CEF0FE" },
    height: "8px",
    // start: ydata.length < 10 ? 0 : Math.floor((ydata.length - 10) * 100 / ydata.length),
    start: (xData.length - 6) * 100 / xData.length,
    end: 100 //初始化滚动条
}] : false,
// 另外附加一个如果自定义了左右切换控件,可以自定义拖动位置
            let chart = document.getElementById("chart_id");//chartid为自定义charts的id
            if (chart != null) {
                let myChart = window["echarts"].init(chart);
                // //获得图表数据数组下标
                // let startValue = myChart.getModel().option.dataZoom[0].startValue;
                // let endValue = myChart.getModel().option.dataZoom[0].endValue;
                // //获得起止位置百分比
                // var startPercent = myChart.getModel().option.dataZoom[0].start;
                let endPercent = myChart.getModel().option.dataZoom[0].end;
                // console.log("myChart = ", startPercent, endPercent, startValue, endValue);
                let option = this.charts[0];
                if (endPercent == 100) {
                    option.dataZoom[0].start = 0;
                    option.dataZoom[0].end = 49;//定义为50的话貌似有点偏差
                }
                else {
                    option.dataZoom[0].start = 50;
                    option.dataZoom[0].end = 100;
                }
                myChart.setOption(option, true);
            }
5、x轴文字显示不全的3种解决思路 https://blog.csdn.net/kebi007/article/details/68488694
6、文字换行 https://www.cnblogs.com/zjjDaily/p/8022944.html
7、自定义legendName 图形样式,基本的就看官网吧,博主用的echart版本是2.*,但调试时却不能像官网那样直接用没有圆形的横线代表折线,下图是官网实例 ↓↓↓
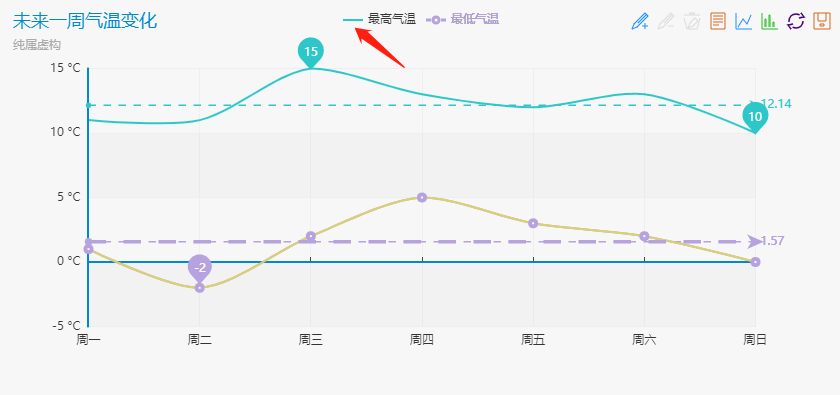
在series中添加属性 symbol:'none' 即可。但在官网3.0和最近新出的4.0版本却也都不行,难道是因为主题???耗了大半天时间最终只好投降使用svg文字,然后设定自己的itemWidth和itemHeight。
icon: "path://M0 13v6c0 0.552 0.448 1 1 1h30c0.552 0 1-0.448 1-1v-6c0-0.552-0.448-1-1-1h-30c-0.552 0-1 0.448-1 1z"
效果如下 ↓↓↓

8、双Y轴左右两侧对齐轴线。参考:https://www.jianshu.com/p/5123433d36f8
思路是设定最大值max和间隔区间 interval,因为interval包含小数时会被强行自适应导致不对齐,所以要将max设定为能被分割的条数整除,当然从图表样式来说这个也应该设定的比正常最大max再稍大一些,要是按照最大max则必然有一个节点是顶到max值的,所以博主给max加了相应区间范围。
// 小编分了5段,所以设定能被5整除:

    if (_max % 5 != 0) {
        _max += 5 - (_max % 5);
    }
    _max = this.setMax(_max);

// setMax,设定比实际max再大半个度:

    setMax(max) {
        if (max > 5 && max < 10) {
            max = 10;
        }
        else if (max < 100 && max >= 10) {
            max += 5;
        }
        else if (max < 1000 && max >= 100) {
            max += 50;
        }
        else if (max < 10000 && max >= 1000) {
            max += 500;
        }
        else if (max < 100000 && max >= 10000) {
            max += 5000;
        }
        else if (max >= 100000) {
            max += 50000;
        }
        return max;
    }
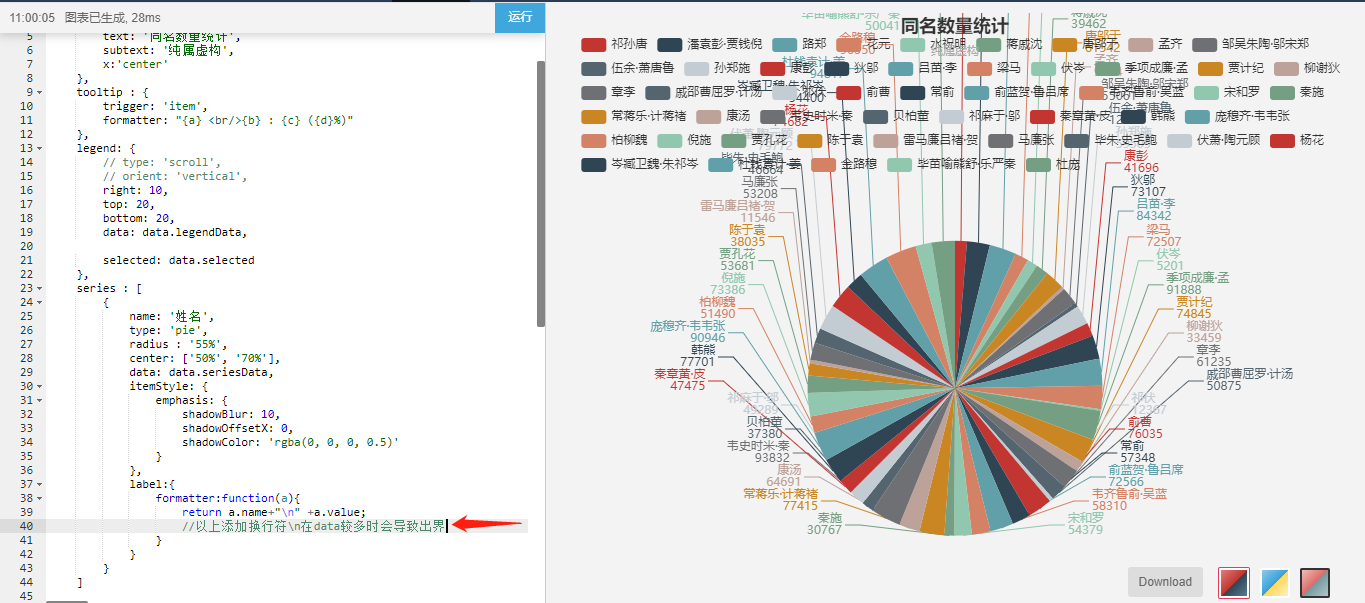
9、饼图(或环图)设置 label.formatter 在data个数较多时不推荐设置换行,否则会出界并与 legend 交叉。如下图↓↓↓
10、设置字体大小不推荐使用字符串px,应使用数字number,否则会导致图表两侧与页边距产生错误差。
textStyle: {
    color: "#A0A5B0",
    fontSize: 10,
    fontFamily: "PingFangSC-Regular"
}

 浙公网安备 33010602011771号