
JVM性能调优常见工具
jps用来查看进程
jstack用来查看进程内的栈,或者dump
jhat查看dump的信息
jstat查看各代的GC信息等
以上都被visualVM所整合了,可以用可视化工具visualVM来分析
jps
jps主要用来输出JVM中运行的进程状态信息。语法格式如下:
jps [options] [hostid]

hostid为Ip,不输入则默认是localhost

options
-q 不输出类名、Jar名和传入main方法的参数

-m 输出传入main方法的参数

-l 输出main类或Jar的全限名

-v 输出传入JVM的参数
E:\JAVA\bin>jps -l -m
25776 Main
2120
13948 org.jetbrains.jps.cmdline.Launcher E:/IntelliJ IDEA 2021.2.1/lib/jna.jar;E:/IntelliJ IDEA 2021.2.1/lib/jna-platform.jar;E:/IntelliJ IDEA 2021.2.1/lib/util.jar;E:/IntelliJ IDEA 2021.2.1/plugins/java/lib/javac2.jar;E:/IntelliJ IDEA 2021.2.1/plugins/java/lib/jps-builders-6.jar;E:/IntelliJ IDEA 2021.2.1/lib/slf4j.jar;E:/IntelliJ IDEA 2021.2.1/plugins/java/lib/aether-dependency-resolver.jar;E:/IntelliJ IDEA 2021.2.1/lib/annotations.jar;E:/IntelliJ IDEA 2021.2.1/plugins/java/lib/maven-resolver-transport-file-1.3.3.jar;E:/IntelliJ IDEA 2021.2.1/lib/protobuf-java-3.15.8.jar;E:/IntelliJ IDEA 2021.2.1/plugins/java/lib/jps-builders.jar;E:/IntelliJ IDEA 2021.2.1/lib/idea_rt.jar;E:/IntelliJ IDEA 2021.2.1/lib/3rd-party.jar;E:/IntelliJ IDEA 2021.2.1/lib/platform-api.jar;E:/IntelliJ IDEA 2021.2.1/lib/jps-model.jar;E:/IntelliJ IDEA 2021.2.1/plugins/java/lib/jps-javac-extension-1.jar;E:/IntelliJ IDEA 2021.2.1/plugins/java/lib/maven-resolver-transport-http-1.3.3.jar;E:/IntelliJ IDEA 2021.2.1/plugins/java/lib/maven-resolver-conn
26364 jdk.jcmd/sun.tools.jps.Jps -l -m
jstack
jstack主要用来查看某个Java进程内的线程堆栈信息。语法格式如下:
jstack [option] pid
jstack [option] executable core
jstack [option] [server-id@]remote-hostname-or-ip

-l long listings,会打印出额外的锁信息,在发生死锁时可以用jstack -l pid来观察锁持有情况
-m mixed mode,不仅会输出Java堆栈信息,还会输出C/C++堆栈信息(比如Native方法)
尝试
E:\JAVA\bin>jps
17712 Main
15336 Jps
2120
24396 Launcher

E:\JAVA\bin>jstack 17712
2023-05-29 15:36:26
Full thread dump Java HotSpot(TM) 64-Bit Server VM (25.331-b09 mixed mode):

"Service Thread" #19 daemon prio=9 os_prio=0 tid=0x000001b8f6939800 nid=0x6398 runnable [0x0000000000000000]
   java.lang.Thread.State: RUNNABLE

"C1 CompilerThread11" #18 daemon prio=9 os_prio=2 tid=0x000001b8f6825000 nid=0x2dd0 waiting on condition [0x0000000000000000]
   java.lang.Thread.State: RUNNABLE

"C1 CompilerThread10" #17 daemon prio=9 os_prio=2 tid=0x000001b8f6822800 nid=0xf54 waiting on condition [0x0000000000000000]
   java.lang.Thread.State: RUNNABLE

"C1 CompilerThread9" #16 daemon prio=9 os_prio=2 tid=0x000001b8f6826800 nid=0x5e3c waiting on condition [0x0000000000000000]
   java.lang.Thread.State: RUNNABLE

"C1 CompilerThread8" #15 daemon prio=9 os_prio=2 tid=0x000001b8f6824000 nid=0x67f0 waiting on condition [0x0000000000000000]
   java.lang.Thread.State: RUNNABLE

"C2 CompilerThread7" #14 daemon prio=9 os_prio=2 tid=0x000001b8f6828000 nid=0x5ca0 waiting on condition [0x0000000000000000]
   java.lang.Thread.State: RUNNABLE

"C2 CompilerThread6" #13 daemon prio=9 os_prio=2 tid=0x000001b8f6822000 nid=0x645c waiting on condition [0x0000000000000000]
   java.lang.Thread.State: RUNNABLE

"C2 CompilerThread5" #12 daemon prio=9 os_prio=2 tid=0x000001b8f6823800 nid=0x6720 waiting on condition [0x0000000000000000]
   java.lang.Thread.State: RUNNABLE

"C2 CompilerThread4" #11 daemon prio=9 os_prio=2 tid=0x000001b8f6821000 nid=0x6bc waiting on condition [0x0000000000000000]
   java.lang.Thread.State: RUNNABLE

"C2 CompilerThread3" #10 daemon prio=9 os_prio=2 tid=0x000001b8f67fb000 nid=0x60fc waiting on condition [0x0000000000000000]
   java.lang.Thread.State: RUNNABLE

"C2 CompilerThread2" #9 daemon prio=9 os_prio=2 tid=0x000001b8f67f7800 nid=0x62dc waiting on condition [0x0000000000000000]
   java.lang.Thread.State: RUNNABLE

"C2 CompilerThread1" #8 daemon prio=9 os_prio=2 tid=0x000001b8f67f6800 nid=0x4dc waiting on condition [0x0000000000000000]
   java.lang.Thread.State: RUNNABLE

"C2 CompilerThread0" #7 daemon prio=9 os_prio=2 tid=0x000001b8f67f0800 nid=0x2b84 waiting on condition [0x0000000000000000]
   java.lang.Thread.State: RUNNABLE

"Monitor Ctrl-Break" #6 daemon prio=5 os_prio=0 tid=0x000001b8f67ee800 nid=0x5ee4 runnable [0x0000009fe02fe000]
   java.lang.Thread.State: RUNNABLE
        at java.net.SocketInputStream.socketRead0(Native Method)
        at java.net.SocketInputStream.socketRead(SocketInputStream.java:116)
        at java.net.SocketInputStream.read(SocketInputStream.java:171)
        at java.net.SocketInputStream.read(SocketInputStream.java:141)
        at sun.nio.cs.StreamDecoder.readBytes(StreamDecoder.java:284)
        at sun.nio.cs.StreamDecoder.implRead(StreamDecoder.java:326)
        at sun.nio.cs.StreamDecoder.read(StreamDecoder.java:178)
        - locked <0x000000076b98f6e8> (a java.io.InputStreamReader)
        at java.io.InputStreamReader.read(InputStreamReader.java:184)
        at java.io.BufferedReader.fill(BufferedReader.java:161)
        at java.io.BufferedReader.readLine(BufferedReader.java:324)
        - locked <0x000000076b98f6e8> (a java.io.InputStreamReader)
        at java.io.BufferedReader.readLine(BufferedReader.java:389)
        at com.intellij.rt.execution.application.AppMainV2$1.run(AppMainV2.java:49)

"Attach Listener" #5 daemon prio=5 os_prio=2 tid=0x000001b8f67a8000 nid=0x5b8c waiting on condition [0x0000000000000000]
   java.lang.Thread.State: RUNNABLE

"Signal Dispatcher" #4 daemon prio=9 os_prio=2 tid=0x000001b8f67a7800 nid=0x62cc runnable [0x0000000000000000]
   java.lang.Thread.State: RUNNABLE

"Finalizer" #3 daemon prio=8 os_prio=1 tid=0x000001b8f6740800 nid=0x5128 in Object.wait() [0x0000009fdfffe000]
   java.lang.Thread.State: WAITING (on object monitor)
        at java.lang.Object.wait(Native Method)
        - waiting on <0x000000076b808ee8> (a java.lang.ref.ReferenceQueue$Lock)
        at java.lang.ref.ReferenceQueue.remove(ReferenceQueue.java:150)
        - locked <0x000000076b808ee8> (a java.lang.ref.ReferenceQueue$Lock)
        at java.lang.ref.ReferenceQueue.remove(ReferenceQueue.java:171)
        at java.lang.ref.Finalizer$FinalizerThread.run(Finalizer.java:216)

"Reference Handler" #2 daemon prio=10 os_prio=2 tid=0x000001b8f3a18800 nid=0x366c in Object.wait() [0x0000009fdfefe000]
   java.lang.Thread.State: WAITING (on object monitor)
        at java.lang.Object.wait(Native Method)
        - waiting on <0x000000076b806c00> (a java.lang.ref.Reference$Lock)
        at java.lang.Object.wait(Object.java:502)
        at java.lang.ref.Reference.tryHandlePending(Reference.java:191)
        - locked <0x000000076b806c00> (a java.lang.ref.Reference$Lock)
        at java.lang.ref.Reference$ReferenceHandler.run(Reference.java:153)

"main" #1 prio=5 os_prio=0 tid=0x000001b8d8c6c800 nid=0x1a4c waiting on condition [0x0000009fdefff000]
   java.lang.Thread.State: TIMED_WAITING (sleeping)
        at java.lang.Thread.sleep(Native Method)
        at Main.main(Main.java:15)

"VM Thread" os_prio=2 tid=0x000001b8f3a0c000 nid=0x500c runnable

"GC task thread#0 (ParallelGC)" os_prio=0 tid=0x000001b8d8c83800 nid=0x6278 runnable

"GC task thread#1 (ParallelGC)" os_prio=0 tid=0x000001b8d8c85000 nid=0x870 runnable

"GC task thread#2 (ParallelGC)" os_prio=0 tid=0x000001b8d8c87000 nid=0x5fd0 runnable

"GC task thread#3 (ParallelGC)" os_prio=0 tid=0x000001b8d8c88800 nid=0x3f54 runnable

"GC task thread#4 (ParallelGC)" os_prio=0 tid=0x000001b8d8c8a800 nid=0x3528 runnable

"GC task thread#5 (ParallelGC)" os_prio=0 tid=0x000001b8d8c8b800 nid=0x519c runnable

"GC task thread#6 (ParallelGC)" os_prio=0 tid=0x000001b8d8c8e800 nid=0x5aac runnable

"GC task thread#7 (ParallelGC)" os_prio=0 tid=0x000001b8d8c8f800 nid=0x2614 runnable

"GC task thread#8 (ParallelGC)" os_prio=0 tid=0x000001b8d8c91000 nid=0x59b0 runnable

"GC task thread#9 (ParallelGC)" os_prio=0 tid=0x000001b8d8c92000 nid=0x4e2c runnable

"GC task thread#10 (ParallelGC)" os_prio=0 tid=0x000001b8d8c94000 nid=0x6694 runnable

"GC task thread#11 (ParallelGC)" os_prio=0 tid=0x000001b8d8c97000 nid=0x2dd4 runnable

"GC task thread#12 (ParallelGC)" os_prio=0 tid=0x000001b8d8c98000 nid=0x3e8c runnable

"VM Periodic Task Thread" os_prio=2 tid=0x000001b8f6968800 nid=0x5db0 waiting on condition

JNI global references: 12
可以看到main线程中
"main" #1 prio=5 os_prio=0 tid=0x000001b8d8c6c800 nid=0x1a4c waiting on condition [0x0000009fdefff000]
   java.lang.Thread.State: TIMED_WAITING (sleeping)
        at java.lang.Thread.sleep(Native Method)
        at Main.main(Main.java:15)
jmap(Memory Map)和 jhat(Java Heap Analysis Tool)
jmap导出堆内存,然后使用jhat来进行分析,jmap语法格式如下:
jmap [option] pid
jmap [option] executable core
jmap [option] [server-id@]remote-hostname-or-ip
打印进程的类加载器和类加载器加载的持久代对象信息,输出:类加载器名称、对象是否存活(不可靠)、对象地址、父类加载器、已加载的类大小等信息
如果运行在64位JVM上,可能需要指定-J-d64命令选项参数。
jmap -permstat pid
    jmap -clstats <pid>
        to connect to running process and print class loader statistics
    jmap -finalizerinfo <pid>
        to connect to running process and print information on objects awaiting finalization
    jmap -histo[:[<histo-options>]] <pid>
        to connect to running process and print histogram of java object heap
    jmap -dump:<dump-options> <pid>
        to connect to running process and dump java heap
    jmap -? -h --help
        to print this help message
  dump-options:
      live         dump only live objects (takes precedence if both "live" and "all" are specified)
      all          dump all objects in the heap (default if one of "live" or "all" is not specified)
      format=b     binary format
      file=<file>  dump heap to <file>
      gz=<number>  If specified, the heap dump is written in gzipped format using the given compression level.
                   1 (recommended) is the fastest, 9 the strongest compression.

    Example: jmap -dump:live,format=b,file=heap.bin <pid>

    histo-options:
      live         count only live objects (takes precedence if both "live" and "all" are specified)
      all          count all objects in the heap (default if one of "live" or "all" is not specified)
      file=<file>  dump data to <file>
      parallel=<number>  parallel threads number for heap iteration:
                                  parallel=0 default behavior, use predefined number of threads
                                  parallel=1 disable parallel heap iteration
                                  parallel=<N> use N threads for parallel heap iteration

    Example: jmap -histo:live,file=/tmp/histo.data <pid>
Jmap -clstats <pid>
连接到正在运行的进程并打印类装入器统计信息
Jmap -finalizerinfo <pid>
连接到正在运行的进程并打印等待结束的对象的信息
Jmap -histo[:[< history -options>]] <pid>
连接到正在运行的进程并打印Java对象堆的直方图
Jmap -dump:<dump-options> <pid>
连接到正在运行的进程和转储Java堆
jmap - ? - h——帮助
打印此帮助消息
查看堆区不同年龄代的内存使用
E:\jdk1.8\bin>jmap -heap 4916
Attaching to process ID 4916, please wait...
Debugger attached successfully.
Server compiler detected.
JVM version is 25.331-b09

using thread-local object allocation.
Parallel GC with 13 thread(s)

Heap Configuration:
   MinHeapFreeRatio         = 0
   MaxHeapFreeRatio         = 100
   MaxHeapSize              = 4253024256 (4056.0MB)
   NewSize                  = 88604672 (84.5MB)
   MaxNewSize               = 1417674752 (1352.0MB)
   OldSize                  = 177733632 (169.5MB)
   NewRatio                 = 2
   SurvivorRatio            = 8
   MetaspaceSize            = 21807104 (20.796875MB)
   CompressedClassSpaceSize = 1073741824 (1024.0MB)
   MaxMetaspaceSize         = 17592186044415 MB
   G1HeapRegionSize         = 0 (0.0MB)

Heap Usage:
PS Young Generation
Eden Space:
   capacity = 66584576 (63.5MB)
   used     = 23099128 (22.02904510498047MB)
   free     = 43485448 (41.47095489501953MB)
   34.69140961414247% used
From Space:
   capacity = 11010048 (10.5MB)
   used     = 0 (0.0MB)
   free     = 11010048 (10.5MB)
   0.0% used
To Space:
   capacity = 11010048 (10.5MB)
   used     = 0 (0.0MB)
   free     = 11010048 (10.5MB)
   0.0% used
PS Old Generation
   capacity = 67633152 (64.5MB)
   used     = 985312 (0.939666748046875MB)
   free     = 66647840 (63.560333251953125MB)
   1.4568476713905039% used

5574 interned Strings occupying 461104 bytes.
先试着dump出来
E:\JAVA\bin>jmap -dump:format=b,file=d:\\temp\dump.dat 4916
Heap dump file created
使用MAT、VisualVM等工具可以查看
这里用jhat查看
E:\JAVA\bin>jhat -port 10000 d:\\temp\dump.dat
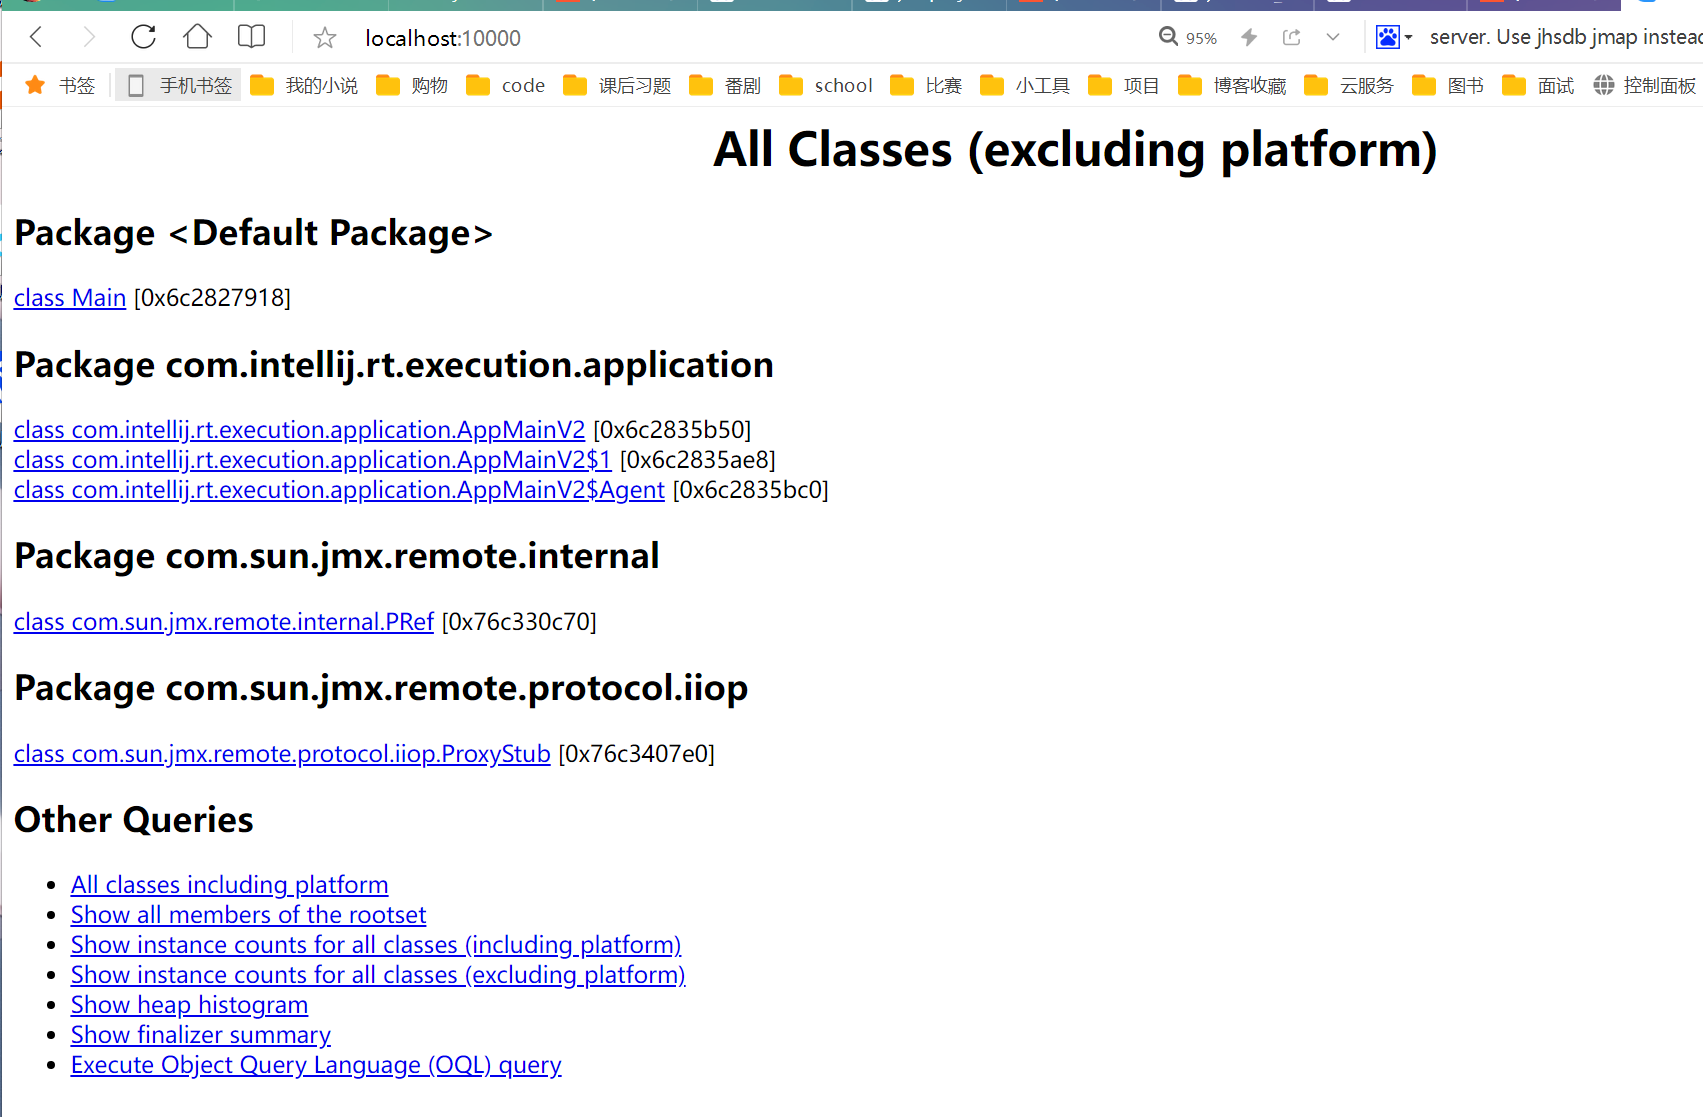
看的其实还是比较抽象的
jvisualVM
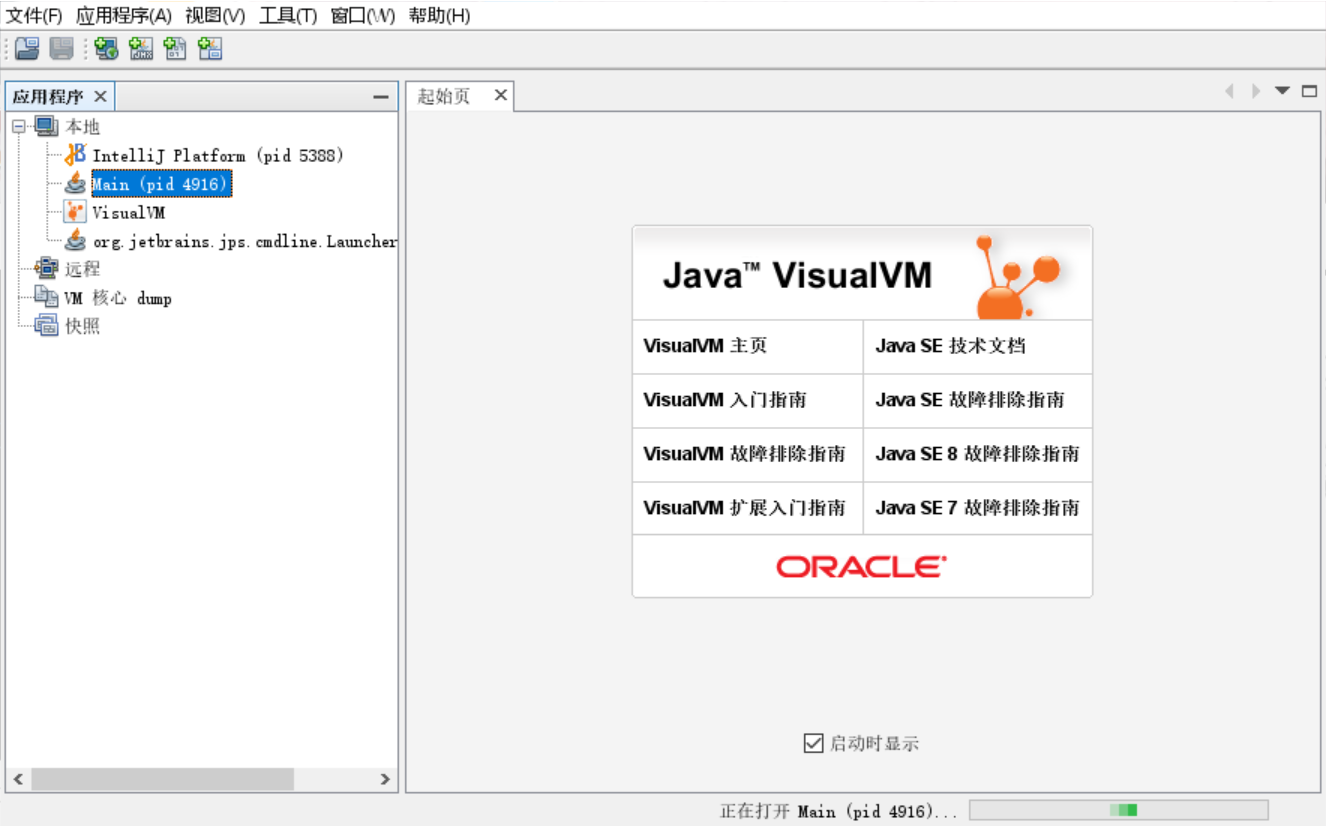
看起来舒服多了
jstat
查看分区内存和GC情况
E:\jdk1.8\bin>jstat ?
-<option> required
Usage: jstat -help|-options
       jstat -<option> [-t] [-h<lines>] <vmid> [<interval> [<count>]]

Definitions:
  <option>      An option reported by the -options option
  <vmid>        Virtual Machine Identifier. A vmid takes the following form:
                     <lvmid>[@<hostname>[:<port>]]
                Where <lvmid> is the local vm identifier for the target
                Java virtual machine, typically a process id; <hostname> is
                the name of the host running the target Java virtual machine;
                and <port> is the port number for the rmiregistry on the
                target host. See the jvmstat documentation for a more complete
                description of the Virtual Machine Identifier.
  <lines>       Number of samples between header lines.
  <interval>    Sampling interval. The following forms are allowed:
                    <n>["ms"|"s"]
                Where <n> is an integer and the suffix specifies the units as
                milliseconds("ms") or seconds("s"). The default units are "ms".
  <count>       Number of samples to take before terminating.
  -J<flag>      Pass <flag> directly to the runtime system.
采样间隔250ms,采样数10
E:\JAVA\bin>jstat -gc 4916 250 10
    S0C         S1C         S0U         S1U          EC           EU           OC           OU          MC         MU       CCSC      CCSU     YGC     YGCT     FGC    FGCT     CGC    CGCT       GCT
    10752.0     10752.0         0.0         0.0      65024.0      25281.2      68608.0       3145.8    21504.0    20929.0    2048.0    1803.2      3     0.006     3     0.061     -         -     0.066
    10752.0     10752.0         0.0         0.0      65024.0      25281.2      68608.0       3145.8    21504.0    20929.0    2048.0    1803.2      3     0.006     3     0.061     -         -     0.066
    10752.0     10752.0         0.0         0.0      65024.0      25281.2      68608.0       3145.8    21504.0    20929.0    2048.0    1803.2      3     0.006     3     0.061     -         -     0.066
    10752.0     10752.0         0.0         0.0      65024.0      25281.2      68608.0       3145.8    21504.0    20929.0    2048.0    1803.2      3     0.006     3     0.061     -         -     0.066
    10752.0     10752.0         0.0         0.0      65024.0      25281.2      68608.0       3145.8    21504.0    20929.0    2048.0    1803.2      3     0.006     3     0.061     -         -     0.066
    10752.0     10752.0         0.0         0.0      65024.0      25281.2      68608.0       3145.8    21504.0    20929.0    2048.0    1803.2      3     0.006     3     0.061     -         -     0.066
    10752.0     10752.0         0.0         0.0      65024.0      25281.2      68608.0       3145.8    21504.0    20929.0    2048.0    1803.2      3     0.006     3     0.061     -         -     0.066
    10752.0     10752.0         0.0         0.0      65024.0      25281.2      68608.0       3145.8    21504.0    20929.0    2048.0    1803.2      3     0.006     3     0.061     -         -     0.066
    10752.0     10752.0         0.0         0.0      65024.0      25281.2      68608.0       3145.8    21504.0    20929.0    2048.0    1803.2      3     0.006     3     0.061     -         -     0.066
    10752.0     10752.0         0.0         0.0      65024.0      25281.2      68608.0       3145.8    21504.0    20929.0    2048.0    1803.2      3     0.006     3     0.061     -         -     0.066
S0C、S1C、S0U、S1U:Survivor 0/1区容量(Capacity)和使用量(Used)
EC、EU:Eden区容量和使用量
OC、OU:年老代容量和使用量
PC、PU:永久代容量和使用量
YGC、YGT:年轻代GC次数和GC耗时
FGC、FGCT:Full GC次数和Full GC耗时
GCT:GC总耗时
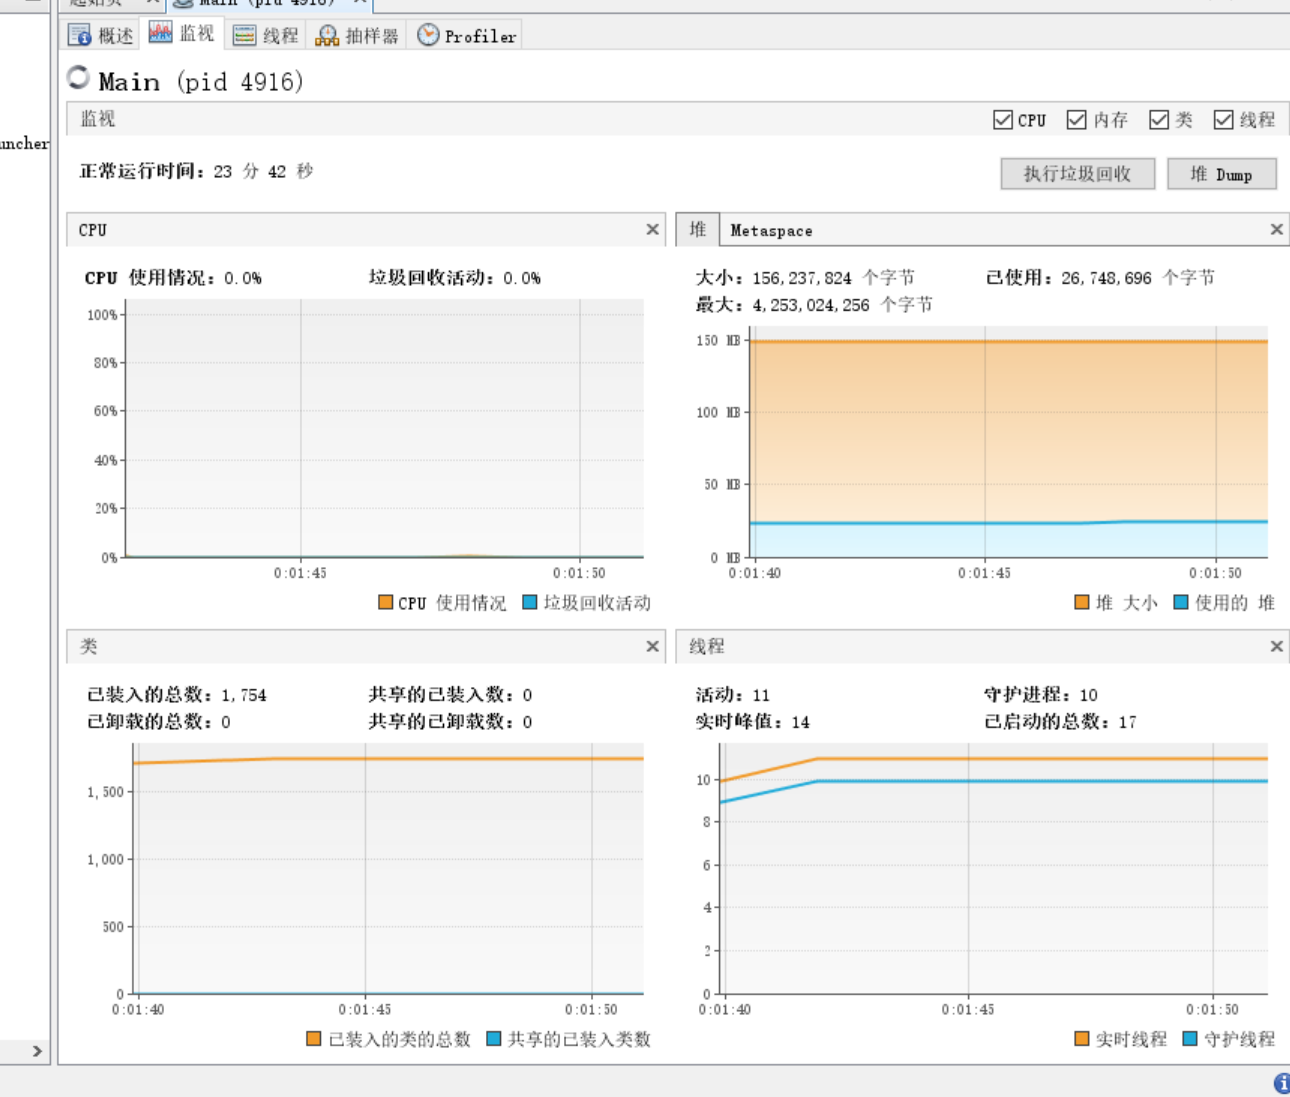
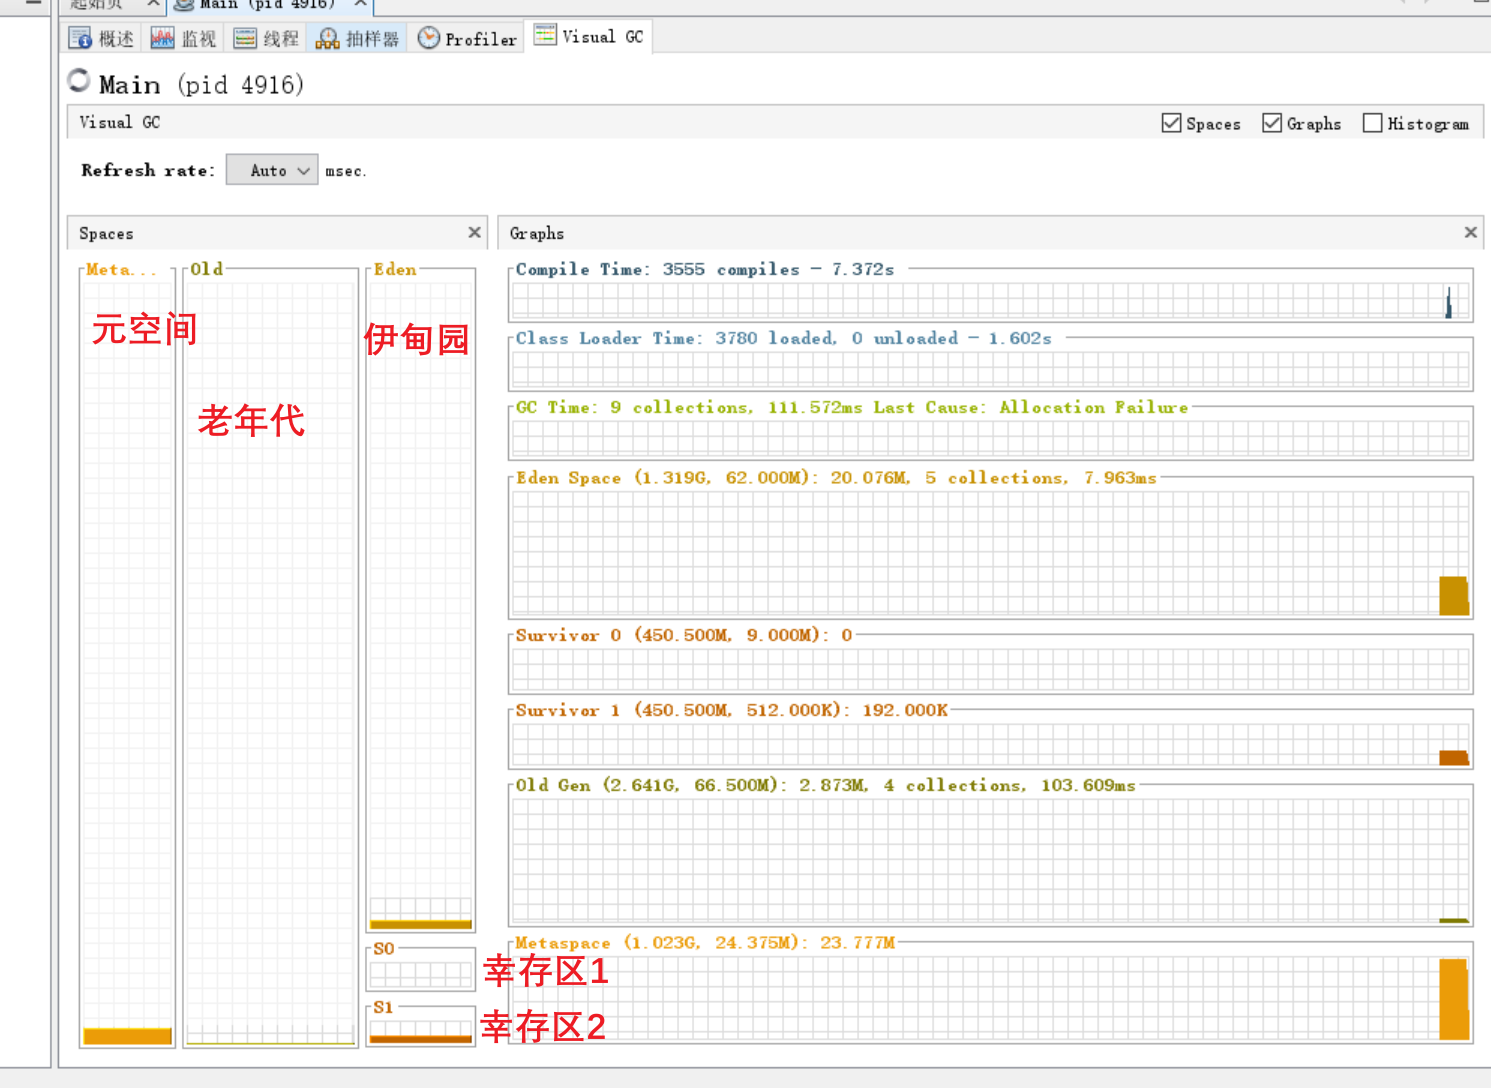
jvisualVM使用jstat的功能
也可以用visualVM看,需要安装插件
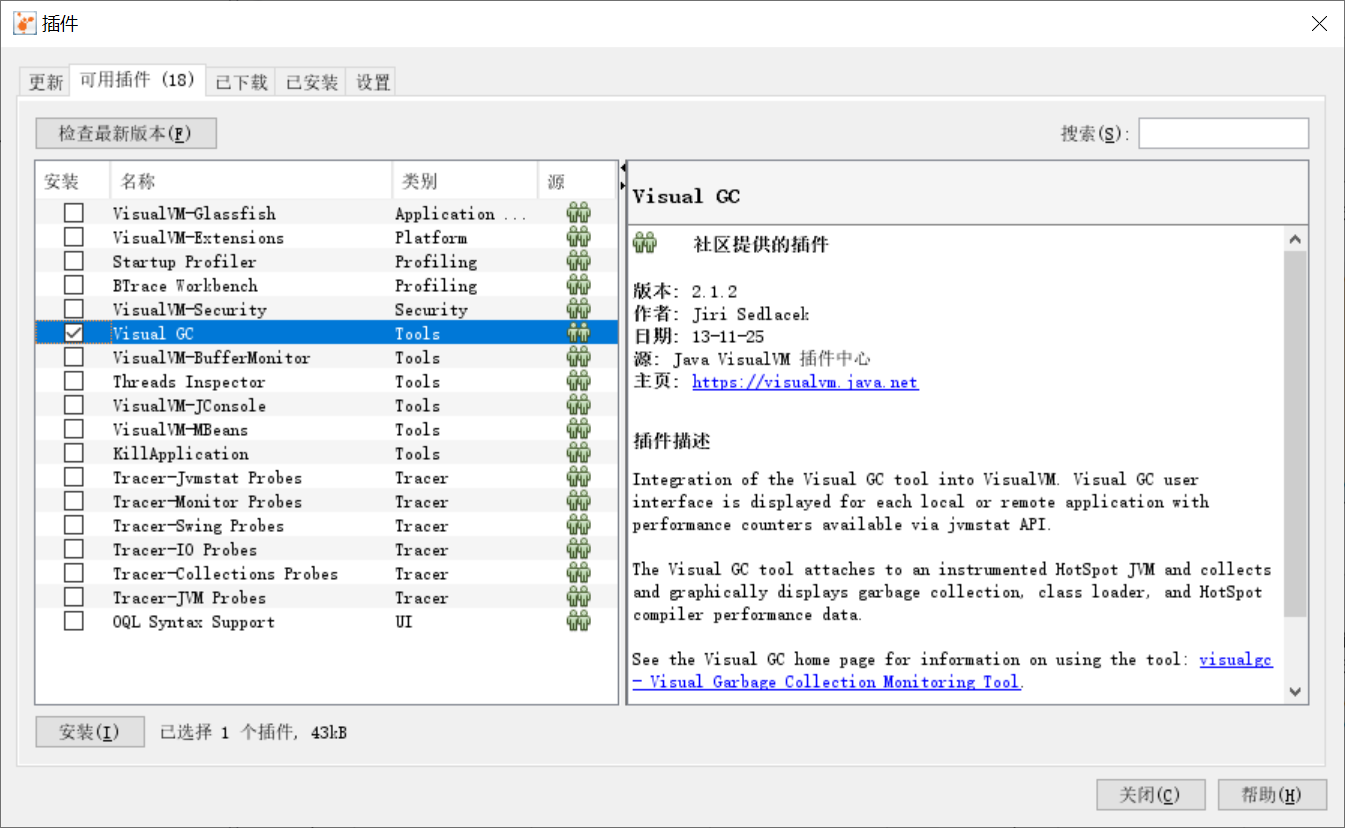
因为网络不好,没法走代理,访问visualvm插件中心下载
https://visualvm.github.io/pluginscenters.html
安装后重启
这个软件赢麻了,干嘛用命令行折磨自己
 posted on

 浙公网安备 33010602011771号