利用MapGuide Open Source的ToolTip做专题图
能否利用MapGuide 制作专题图进行商业分析一直是众多开发者关注的焦点之一。现在MapGuide自身的功能已经支持按区域创建色块分析专题图了,比如分析中国地图以省为单位的人口密度情况,人口密度大的省份用深红色表示,人口稀少的省份用明黄色表示,这样就可以创建出人口分布专题图,这个功能无论是在Map 3D还是在MapGuide OpenSource或Enterprise版中都是很简单的,MapGuide的例子程序Theme即可完成。那么MapGuide能否支持基于地块的饼状图或者柱状图呢?比如要按照省份统计每个省的人口年龄层次状况,那我需要在点每个省时,用饼状图或者柱状图表示未成年人、中青年人和老年人各占多少比例,现在MapGuide还不能直接在地图上生成这样的专题图。但现在也不是没有办法。 :)
也许有人还记得我许久以前的一篇文章给MapGuide Open Source的ToolTip加点料, 这篇文章讲述了如果在MapGuide ToolTip中加入图片,后来无意中看到了Google的Chart API,觉得在这上面肯定可以做些文章。后来一忙就忘了。不过所幸,后来Jackie Ng做了这个工作了,贴出来给大家共享一下。原文在http://themapguyde.blogspot.com/2009/07/expressive-power-of-mapguide-tooltips.html,国内用户可能访问不了。我转一下过来。
Google offers a free API that lets you generate dynamic charts and graphs all from a simple url. This graph below is one such example (right click and view the page source if you want)
This chart is basically a HTML img tag with the following url:
http://chart.apis.google.com/chart?cht=p3&chd=t:60,40&chs=250x100&chl=HelloWorld
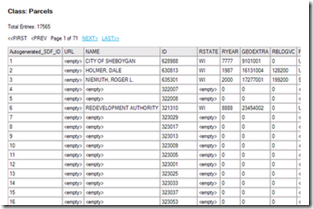
If you study the url carefully, you'll see that there is a parameter asking for the values to be charted, and another parameter asking for the labels for these charted values. Now consider the Parcels layer of the Sheboygan sample dataset:

Suppose we want to represent the values of RYEAR, GEOEXTRA and RBLDGVC in a pie chart (I know this probably makes no sense from a reporting perspective, it's just for the sake of argument)
The tooltip expression for the Parcels layer would be something like:
我简单做了一下,你可以贴过去试试。
Concat ( Concat ( Concat ( Concat ( Concat ( Concat ( Concat ( '<img src = http://chart.apis.google.com/chart?chs=250x100&chd=t:', RYEAR ), ',' ), GEOEXTRA ), ',' ), RBLDGVC ), '&cht=p3&chl= ' ), ' RYEAR|GEOEXTRA |RBLDGV />' )
When we now put our mouse over a Parcel, this is what we get:
怎么样,效果还算可以吧,虽然需要鼠标指上去才显示,但总比没有强些 :)
这只是个引子,注意到ToolTip中只是个HTML,其实只要你有想象力,可以放任何html代码进去,呵呵。 有时间试试看吧。


