
作业八
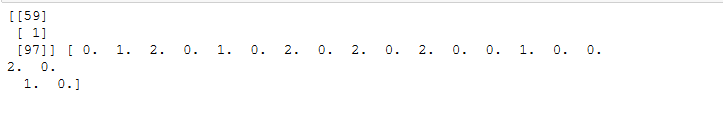
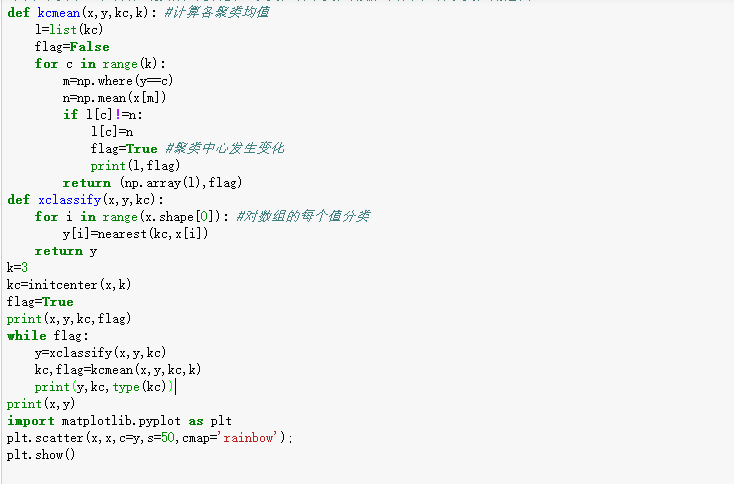
1.用python实现K均值算法


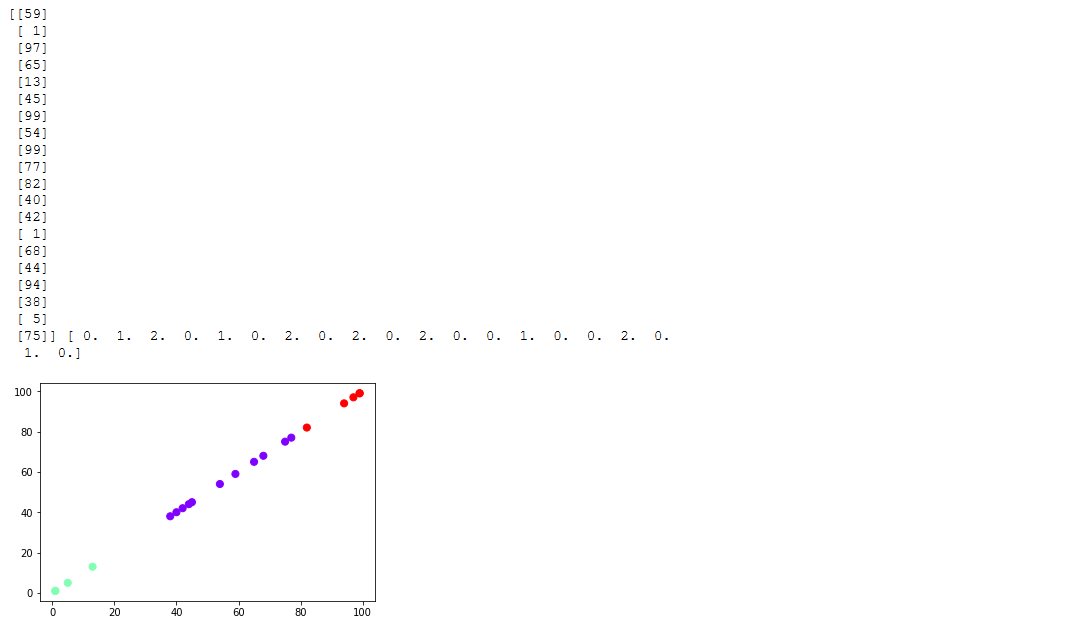
2.鸢尾花花瓣长度数据做聚类并用散点图显示。
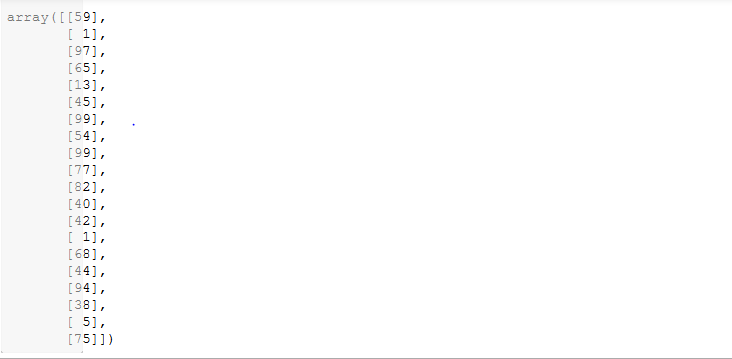
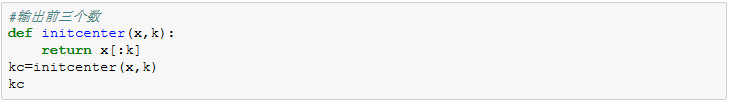
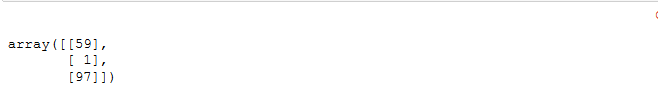
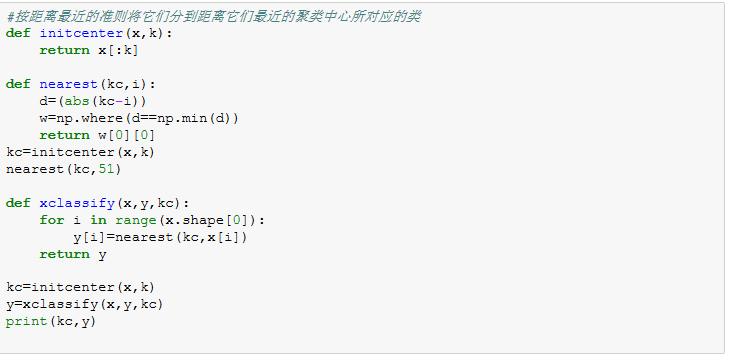
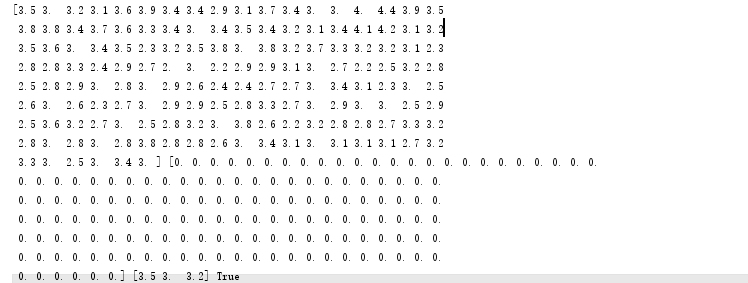
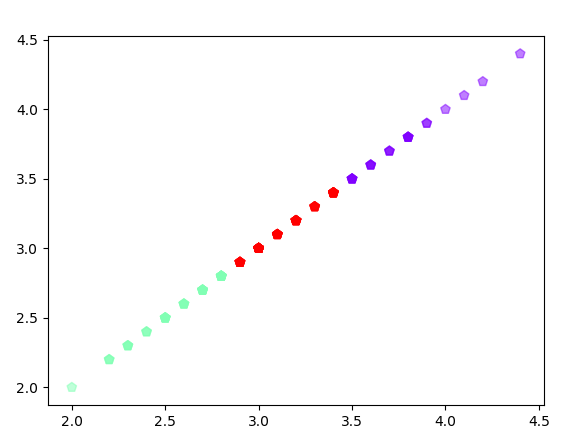
import numpy as np
from sklearn.datasets import load_iris

iris = load_iris()
x = iris.data[:, 1]
y = np.zeros(150)


def initcent(x, k):  # 初始聚类中心数组
    return x[0:k].reshape(k)


def nearest(kc, i):  # 数组中的值,与聚类中心最小距离所在类别的索引号
    d = (abs(kc - i))
    w = np.where(d == np.min(d))
    return w[0][0]


def kcmean(x, y, kc, k):  # 计算各聚类新均值
    l = list(kc)
    flag = False
    for c in range(k):
        m = np.where(y == c)
        n = np.mean(x[m])
        if l[c] != n:
            l[c] = n
            flag = True  # 聚类中心发生变化
    return (np.array(l), flag)


def xclassify(x, y, kc):
    for i in range(x.shape[0]):  # 对数组的每个值分类
        y[i] = nearest(kc, x[i])
    return y


k = 3
kc = initcent(x, k)
flag = True
print(x, y, kc, flag)
while flag:
    y = xclassify(x, y, kc)
    kc, flag = kcmean(x, y, kc, k)
print(y, kc, type(kc))

import matplotlib.pyplot as plt
plt.scatter(x,x,c=y,s=50,cmap='rainbow',marker='p',alpha=0.5)
plt.show()
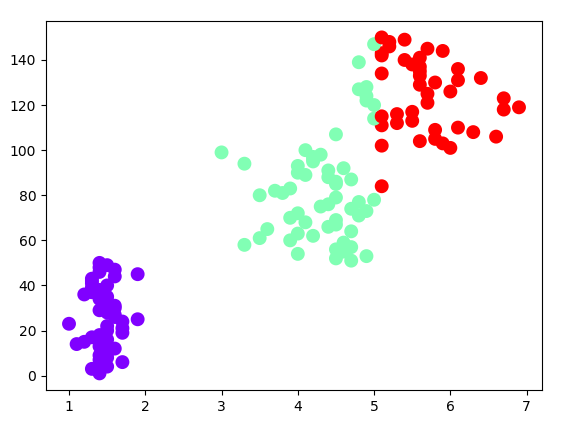
3.用sklearn.cluster.KMeans,鸢尾花花瓣长度数据做聚类并用散点图显示.
import numpy as np
from sklearn.cluster import KMeans
from sklearn.datasets import load_iris
import matplotlib.pyplot as plt

iris_data = load_iris()
X=iris_data.data
# 花瓣长度
petal_length = X[:, 2:3]
x= petal_length
print(x)
k_means = KMeans(n_clusters=3)
est = k_means.fit(x)
kc = est.cluster_centers_
y_kmeans = k_means.predict(x)

plt.scatter(x,np.linspace(1,150,150),c=y_kmeans,marker='o',cmap='rainbow',linewidths=4)
plt.show()

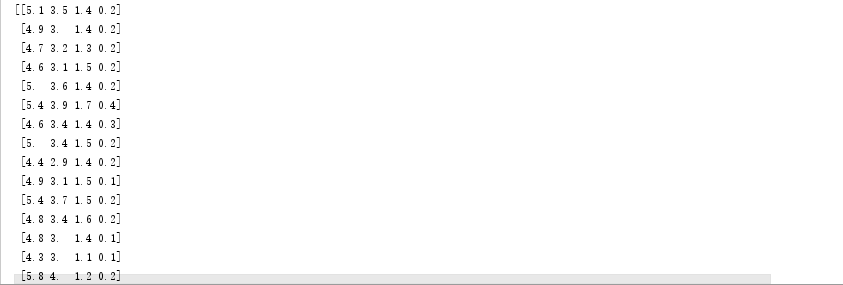
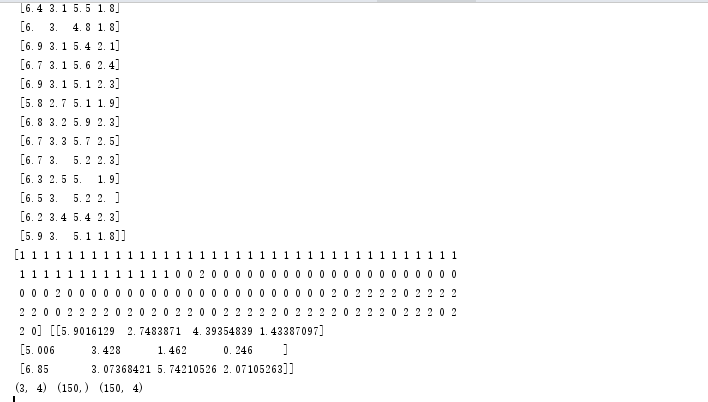
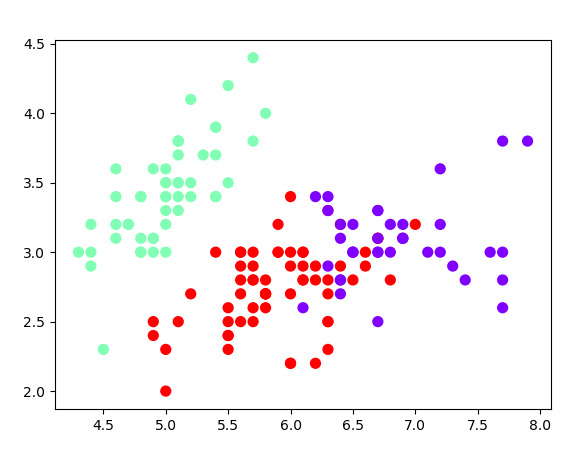
4.鸢尾花完整数据做聚类并用散点图显示.
import numpy as np
import matplotlib.pyplot as plt
from sklearn.datasets import load_iris
iris=load_iris()
x=iris.data
print(x)

from sklearn.cluster import KMeans

est=KMeans(n_clusters=3)
est.fit(x)
kc=est.cluster_centers_
y_kmeans=est.predict(x)
print(y_kmeans,kc)
print(kc.shape,y_kmeans.shape,x.shape)
plt.scatter(x[:,0],x[:,1],c=y_kmeans,s=50,cmap='rainbow')
plt.show()


 浙公网安备 33010602011771号