QML-Chartview
一、例子
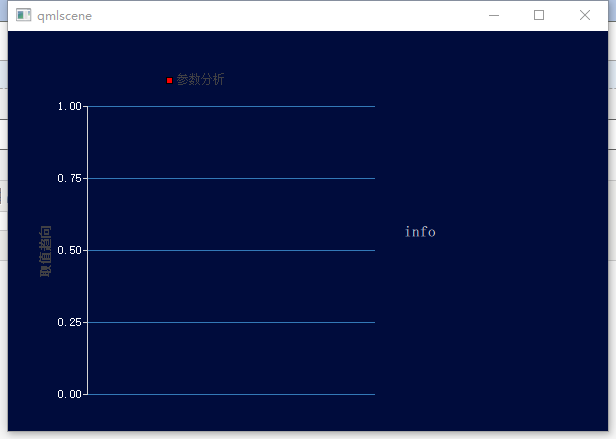
1、例子1:基本使用
import QtQuick 2.0
import QtCharts 2.2
Rectangle {
    id: root
    property string info: "info"
    color: "#000C3C"
    width: 600;
    height: 400;
    function setValue(list_y,txt)
    {
        root.info = txt;
        spline.clear();
        axisY.min = Math.min.apply(null,list_y)
        axisY.max = Math.max.apply(null,list_y)

        for(var i=0;i<list_y.length;i++)
        {
            spline.append(i,list_y[i]);
        }
    }

    ChartView {
        id:chartView
        width: 0.66*parent.width
        height: parent.height
        backgroundColor: "#000C3C"
        ValueAxis {
            id: axisX
            min: 0
            max: 10
            labelsVisible: false
            gridVisible: false
            visible: false
        }
        ValueAxis {
            id: axisY
            labelsColor: "white"
            gridLineColor: "#3379B7"
            titleText: "取值趋向"
        }
        LineSeries {
            id:spline;
            axisX: axisX
            axisY: axisY
            color:"red"
            name: "参数分析"
            width:1
            pointsVisible: true
        }
    }
    Text {
        id: text
        color: "white"
        font.pixelSize: 15;
        anchors.left: chartView.right
        width: 0.34*parent.width
        height: parent.height
        text: root.info
        wrapMode: Text.Wrap
        verticalAlignment:Text.AlignVCenter
//        Component.onCompleted: {
//            text.text = "参数名:xxx\n经分析2000.01.01~2020.01.01的数据,
//发现参数取值总体呈现上升趋势,出厂阈值为100~200,实际阈值为150~180,
//最大取值:190,最小取值:129,最可能取值:148\n2020.05.01";
//        }
    }
}
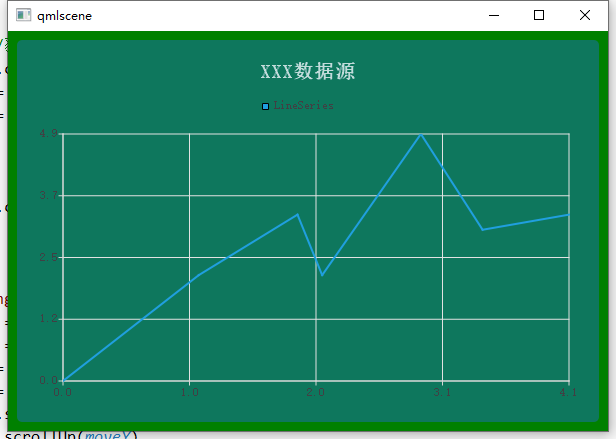
2、例子2:缩放等
import QtQuick 2.0
import QtCharts 2.2
Rectangle {
    id: root
    property string info: "info"
    color: "green"
    width: 600;
    height: 400;
    MouseArea {
        hoverEnabled: true
        anchors.fill: parent;
        onClicked: {
            console.log("MouseArea")
        }
        propagateComposedEvents: true
        onPressed: {
            mouse.accpted = false
        }
    }


    ChartView {
        id:chartView
        title: "XXX数据源"
        antialiasing: true
        backgroundColor: "#9917719b"
        titleColor: "#ccffffff"
        titleFont.bold: true
        titleFont.family: "方正粗倩_GBK"
        titleFont.pointSize: 15
        anchors.centerIn: parent;
//        width: 200;
//        height: 200;
        anchors.fill: parent
        LineSeries {
            name: "LineSeries"
            XYPoint { x: 0; y: 0 }
            XYPoint { x: 1.1; y: 2.1 }
            XYPoint { x: 1.9; y: 3.3 }
            XYPoint { x: 2.1; y: 2.1 }
            XYPoint { x: 2.9; y: 4.9 }
            XYPoint { x: 3.4; y: 3.0 }
            XYPoint { x: 4.1; y: 3.3 }
            onHovered: {
                console.log("LineSeries")
            }
        }
        MouseArea{
            id:mouseArea
            anchors.fill: parent
            property int currentX:0
            property int currentY: 0

            onWheel: {//图形缩放
                if(wheel.angleDelta.y>0){
                    chartView.zoom(1.1)
                    chartView.scrollRight(40)
                }
                else{
                    chartView.zoom(0.9)
                }
            }
            onPressed: {//获取点击时位置
                mouseArea.cursorShape = Qt.ClosedHandCursor
                currentX = mouse.x
                currentY = mouse.y
            }

            onReleased: {
                mouseArea.cursorShape = Qt.ArrowCursorArrowCursor

            }

            onPositionChanged:{//拖拽功能实现
                var moveX = mouse.x-currentX
                var moveY = mouse.y-currentY
                currentX = mouse.x
                currentY = mouse.y
                chartView.scrollLeft(moveX)
                chartView.scrollUp(moveY)
            }
        }
    }

}
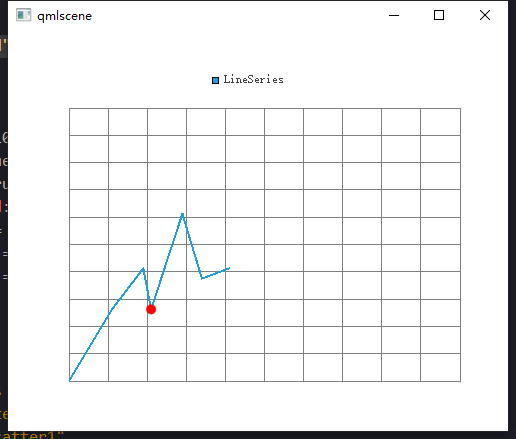
3、添加标记实时更新
import QtQuick 2.0
import QtQuick.Layouts 1.15
import QtCharts 2.15
ChartView {
    id: id_chart
    width: 500;
    height: 400


    ValueAxis {
        id: id_baseAxisX
        tickCount: 11
        labelsVisible: false
        gridLineColor: /*"#B5C2B9"*/"gray"
        lineVisible: false  //突出的小段线不可见
        min: 0
        max: 1000
        tickInterval: 1
    }
    ValueAxis {
        id: id_baseAxisY
        tickCount: 11
        labelsVisible: false
        gridLineColor: /*"#B5C2B9"*/"gray"
        lineVisible: false
        min: 0;
        max: 80
    }
    LineSeries {
        id:testLine
        name: "LineSeries"
        axisX: id_baseAxisX
        axisY: id_baseAxisY
        XYPoint { x: 0; y: 0 }
        XYPoint { x: 110; y: 21 }
        XYPoint { x: 190; y: 33 }
        XYPoint { x: 210; y: 21 }
        XYPoint { x: 290; y: 49 }
        XYPoint { x: 340; y: 30 }
        XYPoint { x: 410; y: 33 }
    }
    Rectangle {
        id: rect
        width: 10
        height: 10
        radius: 5
        color: "red"
    }

    Timer {
        interval: 1000
        repeat: true
        running: true
        onTriggered: {
            var p = id_chart.mapToPosition(testLine.at(3), testLine)
            rect.x = p.x-rect.width/2
            rect.y = p.y-rect.height/2
        }
    }
}
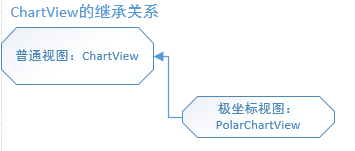
二、相关继承图
①、视图
②、图形系列
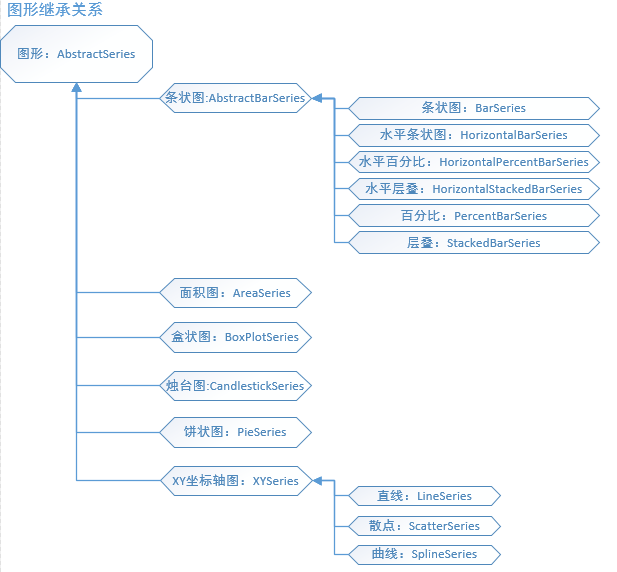
③、坐标轴

PS:
1、问题:在QML里加入了ChartView运行程序崩溃,将main.cpp里的QGuiApplication改成QApplication。
2、问题:使用QValueAxis时,报错:error: expected class-name,在开头加上QT_CHARTS_USE_NAMESPACE: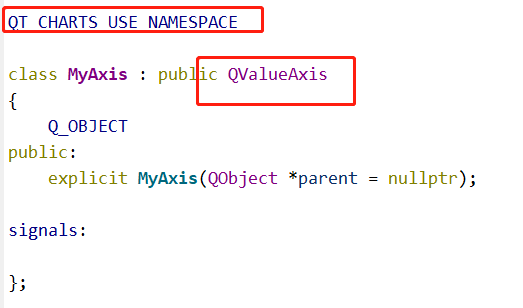
3、触摸屏的使用:PinchArea
https://stackoverflow.com/questions/50050391/how-to-set-zoom-origin-for-a-qml-chart-view
4、设置绘制区域
id_chart.plotArea = Qt.rect(id_chart.x,id_chart.y,id_chart.width,id_chart.height)
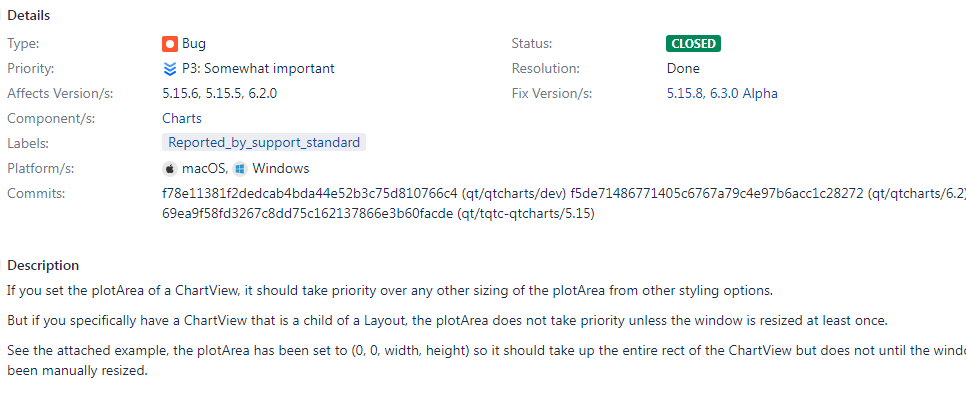
这个函数有个bug,需要重新设置宽度或高度,才会触发自绘,相关见官方:https://bugreports.qt.io/browse/QTBUG-95870
5、在C++中访问ChartView的线
①、方法1:通过查找chartview对象然后调用函数
QObject* chartview = viewer.rootObject()->findChild<QObject*>("myChartView"); //points to chartview object from QML
QAbstractSeries* series; //will point to PieSeries or LineSeries in ChartView once invokeMethod returns it
QMetaObject::invokeMethod(chartview, "series", Qt::AutoConnection, Q_RETURN_ARG(QAbstractSeries*, series), Q_ARG(int, 0)); //Get first series in ChartView; series method expect an integer
②、方法2:在C++中设置函数接口,在QML中调用传入line对象
//C++
Q_INVOKABLE void bindLine(QtCharts::QAbstractSeries* line)
{
    QtCharts::QLineSeries* s = static_case<QtCharts::QLineSeries>(line);
    QVector<QPointf> pts;
    //add points to pts
    s.replace(pts);
}

//QML
LineSeries {
    id: line
    Component.onComplect {
        bindLine(line);
    }
}
6、动态创建线
接口:ChartView.createSeries
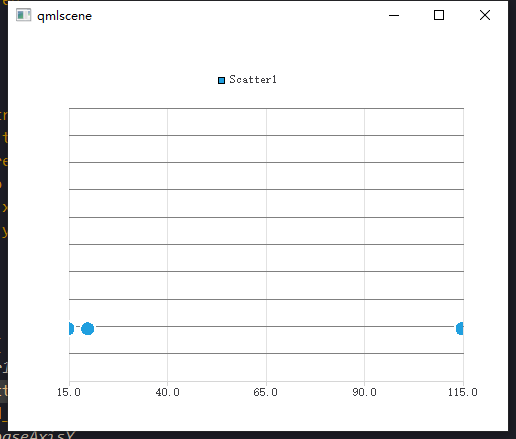
7、为线添加点时,是按照x从小到大绘制的,如果某个点的x值比前一个点的x大,则此点被忽略
import QtQuick 2.0
import QtQuick.Layouts 1.15
import QtCharts 2.15
ChartView {
    id: id_chart
    width: 500;
    height: 400

    ValueAxis {
        id: id_baseAxisX
        tickCount: 11
        labelsVisible: false
        gridLineColor: /*"#B5C2B9"*/"gray"
        lineVisible: false  //突出的小段线不可见
        min: 0
        max: 1000
        tickInterval: 1
    }
    ValueAxis {
        id: id_baseAxisY
        tickCount: 11
        labelsVisible: false
        gridLineColor: /*"#B5C2B9"*/"gray"
        lineVisible: false
        min: 0;
        max: 80
    }

    ScatterSeries {
        id: scatter1
        name: "Scatter1"
        axisX: id_baseAxisX
        axisY: id_baseAxisY
        XYPoint { x: 15; y: 15 }
        XYPoint { x: 115; y: 15 }
        XYPoint { x: 20; y: 15 }//会被忽略
    }
}

如果不指定y轴,则效果是:
8、chart坐标系和qml坐标系的转换
/*
*描述:根据chart坐标系上的一个点转化为chart所在的qt坐标系点
*参数1:[NULL] 参数2:[NULL]
*返回:NULL
*作者:zhuxy
*/
function getQMLPositionFromChart(chartPoint)
{
    console.assert(id_chart.count>0, "chart series count is 0");
    return id_chart.mapToPosition(chartPoint, id_chart.series(0));
}

/*
*描述:根据qt坐标系点转化为chart所在的坐标系点
*参数1:[NULL] 参数2:[NULL]
*返回:NULL
*作者:zhuxy
*/
function getChartPositionFromQML(qmlPoint)
{
    console.assert(id_chart.count>0, "chart series count is 0");
    return id_chart.mapToValue(qmlPoint, id_chart.series(0));
}
长风破浪会有时,直挂云帆济沧海!
可通过下方链接找到博主
https://www.cnblogs.com/judes/p/10875138.html


