


python指数平滑预测
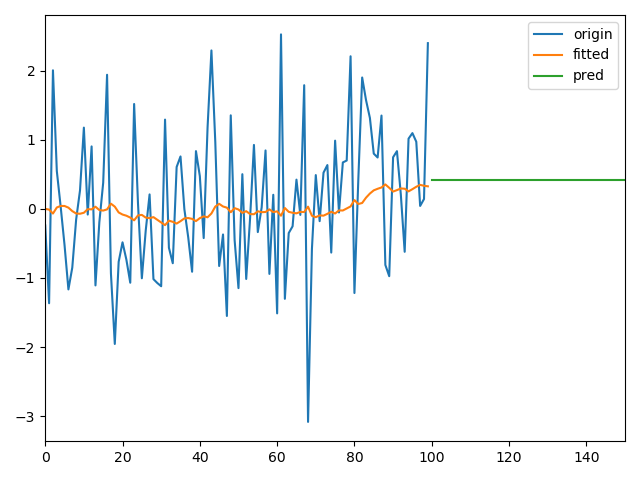
1、无明显单调或周期变化的参数

import numpy as np
import pandas as pd
import matplotlib.pyplot as plt
from statsmodels.tsa.holtwinters import SimpleExpSmoothing

x1 = np.linspace(0, 1, 100)
y1 = pd.Series(np.multiply(x1, (x1 - 0.5)) + np.random.randn(100))
ets1 = SimpleExpSmoothing(y1)
r1 = ets1.fit()
pred1 = r1.predict(start=len(y1), end=len(y1) + len(y1)//2)

pd.DataFrame({
    'origin': y1,
    'fitted': r1.fittedvalues,
    'pred': pred1
}).plot(legend=True)
plt.show()
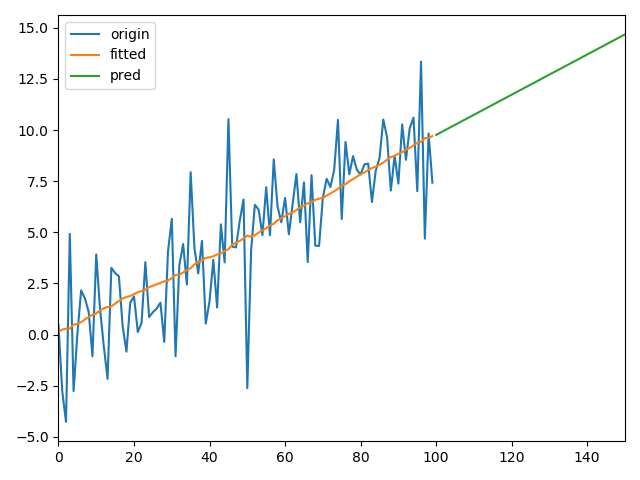
2、单调变化的参数
import numpy as np
import pandas as pd
import matplotlib.pyplot as plt

from statsmodels.tsa.holtwinters import Holt

x2 = np.linspace(0, 99, 100)
y2 = pd.Series(0.1 * x2 + 2 * np.random.randn(100))
ets2 = Holt(y2)
r2 = ets2.fit()
pred2 = r2.predict(start=len(y2), end=len(y2) + len(y2)//2)

pd.DataFrame({
    'origin': y2,
    'fitted': r2.fittedvalues,
    'pred': pred2
}).plot(legend=True)
plt.show()
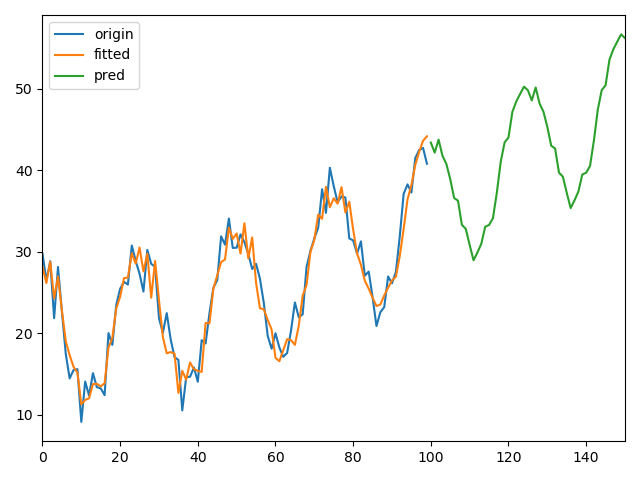
3、具有周期变化的参数
import numpy as np
import pandas as pd
import matplotlib.pyplot as plt

from statsmodels.tsa.holtwinters import ExponentialSmoothing

x3 = np.linspace(0, 4 * np.pi, 100)
y3 = pd.Series(20 + 0.1 * np.multiply(x3, x3) + 8 * np.cos(2 * x3) + 2 * np.random.randn(100))
ets3 = ExponentialSmoothing(y3, trend='add', seasonal='add', seasonal_periods=25)
r3 = ets3.fit()
pred3 = r3.predict(start=len(y3), end=len(y3) + len(y3)//2)

pd.DataFrame({
    'origin': y3,
    'fitted': r3.fittedvalues,
    'pred': pred3
}).plot(legend=True)
plt.show()
参考:https://www.jianshu.com/p/2c607fe926f0
长风破浪会有时,直挂云帆济沧海!
可通过下方链接找到博主
https://www.cnblogs.com/judes/p/10875138.html


【推荐】国内首个AI IDE,深度理解中文开发场景,立即下载体验Trae
【推荐】编程新体验,更懂你的AI,立即体验豆包MarsCode编程助手
【推荐】抖音旗下AI助手豆包,你的智能百科全书,全免费不限次数
【推荐】轻量又高性能的 SSH 工具 IShell:AI 加持,快人一步
· 10年+ .NET Coder 心语,封装的思维:从隐藏、稳定开始理解其本质意义
· .NET Core 中如何实现缓存的预热?
· 从 HTTP 原因短语缺失研究 HTTP/2 和 HTTP/3 的设计差异
· AI与.NET技术实操系列:向量存储与相似性搜索在 .NET 中的实现
· 基于Microsoft.Extensions.AI核心库实现RAG应用
· TypeScript + Deepseek 打造卜卦网站:技术与玄学的结合
· 阿里巴巴 QwQ-32B真的超越了 DeepSeek R-1吗?
· 【译】Visual Studio 中新的强大生产力特性
· 10年+ .NET Coder 心语 ── 封装的思维:从隐藏、稳定开始理解其本质意义
· 【设计模式】告别冗长if-else语句:使用策略模式优化代码结构
2017-04-02 常用指令