线性回归-实践篇
转至:云不知深处的博客: https://blog.csdn.net/pakko/article/details/37527799
总结了线性回归的理论部分,下面我们以浦东塘桥的二手房数据来实践线性回归。
1,数据获取
从网站爬到数据,并整理成我们需要的。爬取方式不便多讲,本人是用的jsoup。
2,数据过滤
爬到数据后,过滤了房间面积小于30平米,大于150平米的数据,总价格大于800w的也过滤了。(这些数据太小或者太大)
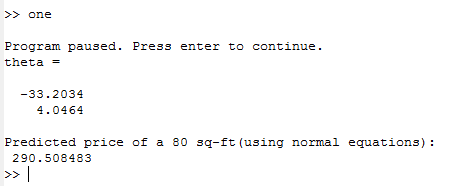
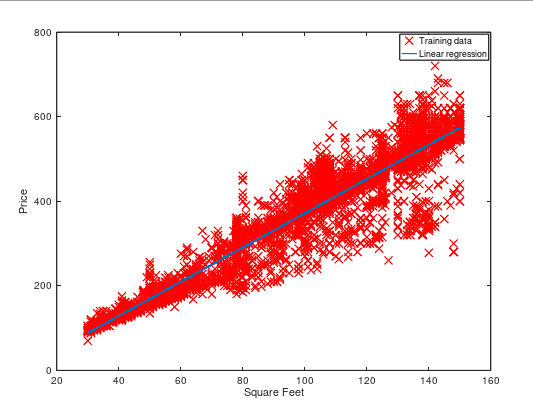
3,一元线性回归
x表示房子面积,y表示房价,使用正规方程组的方法计算。
拿到代码后执行one即可。
执行结果如下:
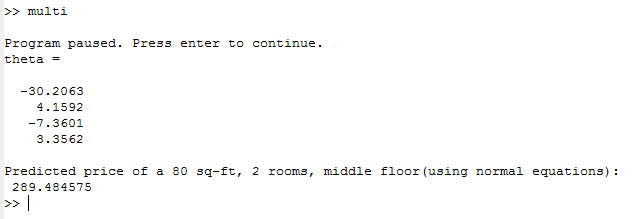
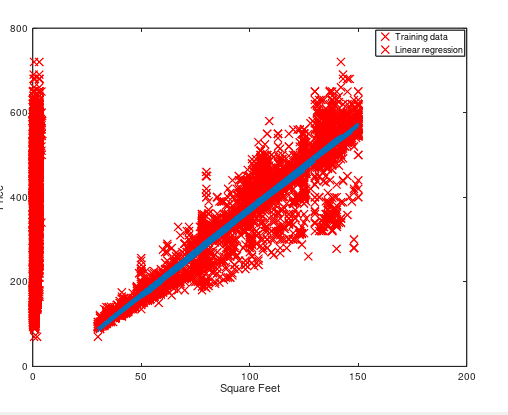
4,多元线性回归
x表示房子面积、房间数、楼层,y表示房价,使用正规方程组的方法计算。
拿到代码后执行multi即可。
执行结果如下: