梯度下降实现案例(含python代码)
基础:损失函数的定义,参考http://blog.csdn.net/l18930738887/article/details/50615029
目标:已知学习样本,求解预测函数的系数,希望损失函数取到最小值。
一、原理介绍:
假设我们已知门店销量为
|
门店数X |
实际销量Y |
|
1 |
13 |
|
2 |
14 |
|
3 |
20 |
|
4 |
21 |
|
5 |
25 |
|
6 |
30 |
我们如何预测门店数X与Y的关系式呢?假设我们设定为线性:Y=a0+a1X
接下来我们如何使用已知数据预测参数a0和a1呢?这里就是用了梯度下降法:
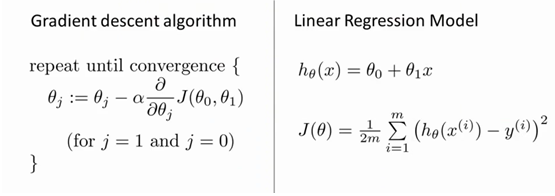
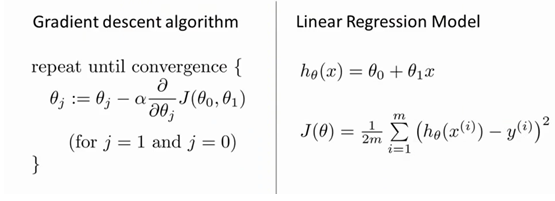
左侧就是梯度下降法的核心内容,右侧第一个公式为假设函数,第二个公式为损失函数。
其中 

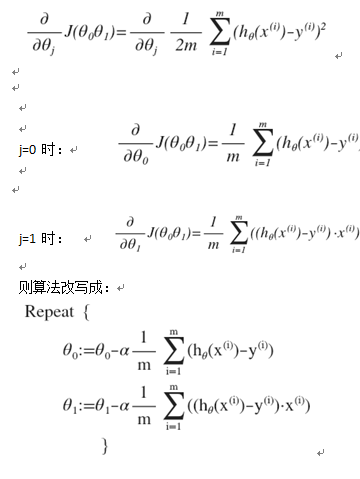
对我们之前的线性回归问题运用梯度下降法,关键在于求出代价函数的导数,即:
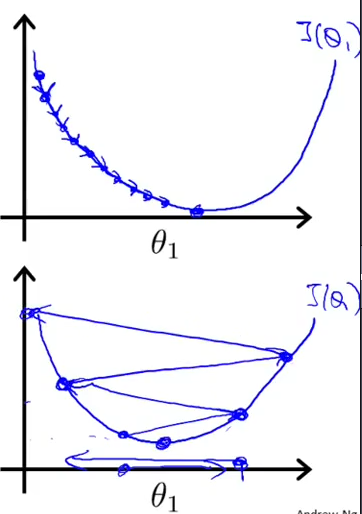
直观的表示,如下:
(取自斯坦福大学机器学习)
二、python代码实现:(以下代码是鲁棒性不高,可以看神经网络的梯度下降http://blog.csdn.net/l18930738887/article/details/50724478。)
- </pre><pre>
- import sys
- #Training data set
- #each element in x represents (x1)
- x = [1,2,3,4,5,6]
- #y[i] is the output of y = theta0+ theta1 * x[1]
- y = [13,14,20,21,25,30]
- #设置允许误差值
- epsilon = 1
- #学习率
- alpha = 0.01
- diff = [0,0]
- max_itor = 20
- error1 = 0
- error0 =0
- cnt = 0
- m = len(x)
- #init the parameters to zero
- theta0 = 0
- theta1 = 0
- while 1:
- cnt=cnt+1
- diff = [0,0]
- for i in range(m):
- diff[0]+=theta0+ theta1 * x[i]-y[i]
- diff[1]+=(theta0+theta1*x[i]-y[i])*x[i]
- theta0=theta0-alpha/m*diff[0]
- theta1=theta1-alpha/m*diff[1]
- error1=0
- for i in range(m):
- error1+=(theta0+theta1*x[i]-y[i])**2
- if abs(error1-error0)< epsilon:
- break
- print'theta0 :%f,theta1 :%f,error:%f'%(theta0,theta1,error1)
- if cnt>20:
- print 'cnt>20'
- break
- print'theta0 :%f,theta1 :%f,error:%f'%(theta0,theta1,error1)
结果现实:
- <pre style="box-sizing: border-box; overflow: auto; font-size: 14px; padding: 0px; margin-top: 0px; margin-bottom: 0px; line-height: 17.0001px; word-break: break-all; word-wrap: break-word; border: 0px; border-radius: 0px; white-space: pre-wrap; vertical-align: baseline; rgb(255, 255, 255);"><pre name="code" class="plain">theta0 :0.205000,theta1 :0.816667,error:1948.212261
- theta0 :0.379367,theta1 :1.502297,error:1395.602361
- theta0 :0.527993,theta1 :2.077838,error:1005.467313
- theta0 :0.654988,theta1 :2.560886,error:730.017909
- theta0 :0.763807,theta1 :2.966227,error:535.521394
- theta0 :0.857351,theta1 :3.306283,error:398.166976
- theta0 :0.938058,theta1 :3.591489,error:301.147437
- theta0 :1.007975,theta1 :3.830615,error:232.599138
- theta0 :1.068824,theta1 :4.031026,error:184.147948
- theta0 :1.122050,theta1 :4.198911,error:149.882851
- theta0 :1.168868,theta1 :4.339471,error:125.631467
- theta0 :1.210297,theta1 :4.457074,error:108.448654
- theta0 :1.247197,theta1 :4.555391,error:96.255537
- theta0 :1.280286,theta1 :4.637505,error:87.584709
- theta0 :1.310171,theta1 :4.706007,error:81.400378
- theta0 :1.337359,theta1 :4.763073,error:76.971413
- theta0 :1.362278,theta1 :4.810533,error:73.781731
- theta0 :1.385286,theta1 :4.849922,error:71.467048
- theta0 :1.406686,theta1 :4.882532,error:69.770228
- theta0 :1.426731,theta1 :4.909448,error:68.509764
- theta0 :1.445633,theta1 :4.931579,error:67.557539
- cnt>20
- theta0 :1.445633,theta1 :4.931579,error:67.557539
可以看到学习率在0.01时,error会正常下降。图形如下:(第一张图是学习率小的时候,第二张图就是学习率较大的时候)
所以我们再调整一下新的学习率看看是否能看到第二张图:
我们将学习率调整成了0.3的时候得到以下结果:
- theta0 :6.150000,theta1 :24.500000,error:38386.135000
- theta0 :-15.270000,theta1 :-68.932500,error:552053.226569
- theta0 :67.840125,theta1 :285.243875,error:7950988.401277
- theta0 :-245.867981,theta1 :-1059.347887,error:114525223.507401
- theta0 :946.357695,theta1 :4043.346381,error:1649619133.261223
- theta0 :-3576.913313,theta1 :-15323.055232,error:23761091159.680252
- theta0 :13591.518674,theta1 :58177.105053,error:342254436006.869995
- theta0 :-51565.747234,theta1 :-220775.317546,error:4929828278909.234375
- theta0 :195724.210360,theta1 :837920.911885,error:71009180027939.656250
- theta0 :-742803.860227,theta1 :-3180105.158068,error:1022815271242165.875000
- theta0 :2819153.863813,theta1 :12069341.864380,error:14732617369683060.000000
- theta0 :-10699395.102930,theta1 :-45806250.675551,error:212208421856953728.000000
- theta0 :40606992.787278,theta1 :173846579.256281,error:3056647245837464576.000000
- theta0 :-154114007.118001,theta1 :-659792674.286440,error:44027905696333684736.000000
- theta0 :584902509.168162,theta1 :2504083725.690765,error:634177359734604038144.000000
- theta0 :-2219856149.407590,theta1 :-9503644836.328783,error:9134682134868024885248.000000
- theta0 :8424927779.709908,theta1 :36068788150.345154,error:131575838248146814631936.000000
- theta0 :-31974778105.915466,theta1 :-136890372077.920685,error:1895216599231190653730816.000000
- theta0 :121352546013.825867,theta1 :519534337912.329712,error:27298674329760760684609536.000000
- theta0 :-460564272592.117981,theta1 :-1971767072878.787598,error:393209736799816196514906112.000000
- theta0 :1747960435714.394287,theta1 :7483365594965.919922,error:5663787744653302294061776896.000000
- cnt>20
- theta0 :1747960435714.394287,theta1 :7483365594965.919922,error:5663787744653302294061776896.000000
可以看到theta0和theta1都在跳跃,与预期相符。
上文使用的是批量梯度下降法,如遇到大型数据集的时候这种算法非常缓慢,因为每次迭代都需要学习全部数据集,后续推出了随机梯度下降,其实也就是抽样学习的概念。


