三、OCTAVE画图
1.画图
t = [1:0.1:1.8]
y1 = sin(2 * pi *4*t)
plot(t,y1,'r') #x轴的数,y轴的数,颜色

#在原画的基础上继续画图
hold on
title("my plot")
xlabel("time")
ylabel("value")
legend('sin','cos')
2.刻度
通过 axis 命令可以设置轴的刻度,即设置 x 和 y 轴的最小值和最大值,使用方式如下:
axis([xmin xmax ymin ymax])
3.生成子图
subplot(m, n, p)
m 和 n 为积阵列的行数和列数(即将图像分割成 m*n 个格子),p 表示把当前图形绘制在哪个子图中
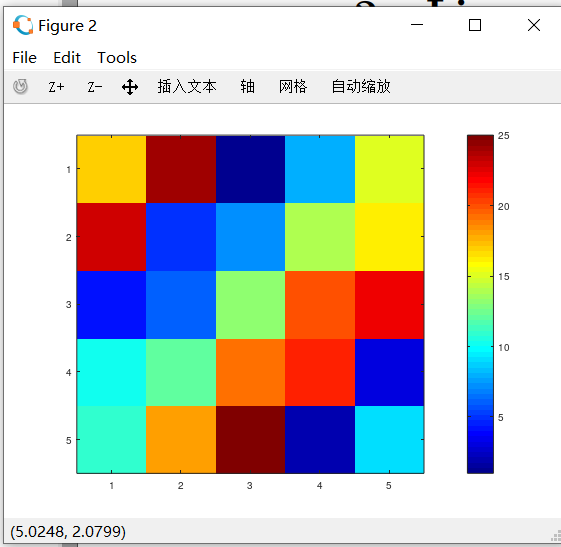
4.画热力图
A = magic(5);
imagesc(A),colorbar,colormap jet;


