计算之道

  博客园  :: 首页  :: 新随笔  :: 联系 :: 订阅 订阅  :: 管理

原文章链接(侵删):https://bohrium.dp.tech/notebooks/9747927953


在完成分子动力学模拟之后,需要对模拟轨迹进行分析,计算径向分布函数(Radial Distribution Function, RDF)即是一种常见的分析。大多分子动力学模拟软件提供了计算RDF的功能,但往往不够灵活,也不能适应不同的轨迹格式。

MDtraj是一个用于处理分子动力学轨迹的Python包,它能够接受多种轨迹格式,将不同格式的轨迹作为统一的轨迹对象处理;同时,它也提供了许多性质计算的功能,其中就包括RDF;最后,通过使用Python代码,使得性质计算灵活了许多。

本文将先介绍RDF的计算原理,再以一段分子动力学轨迹为例,展示如何通过MDtraj计算RDF,并通过RDF计算配位数。已对RDF熟悉的读者,可跳过第一部分。


# 导入需要使用的包
import mdtraj as md
import matplotlib.pyplot as plt
import numpy as np
import matplotlib.pyplot as plt
 

径向分布函数的计算原理

均匀分布


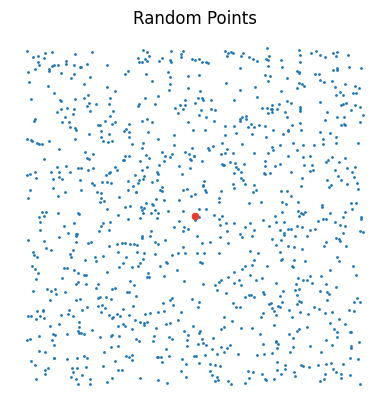
首先在1*1 的平面内均匀的生成若干个点,并选择(0.5, 0.5) 作为中心。现在我们想要知道,距离中心点为r 处点的数密度(后文简称为密度)。由于离散情形,实际上我们想知道的是r 到r + Δ r 这样的圆环内点的密度。可以想象,由于点的分布是均匀的,因此各处密度应该相等,并且与平均密度一致。由于面积为1,因此平均密度在数值上与点的数量相等。

n_points = 1000 # 对于密恐患者,请不要使用过多的点
data = np.random.random((n_points,2))
center = np.array([0.5,0.5])
 
plt.axes().set_aspect('equal')
plt.axis("off")
plt.scatter(data[:,0], data[:,1],s = 1)
plt.scatter(center[0], center[1],s = 20, c = '#e53d30')
plt.title("Random Points")


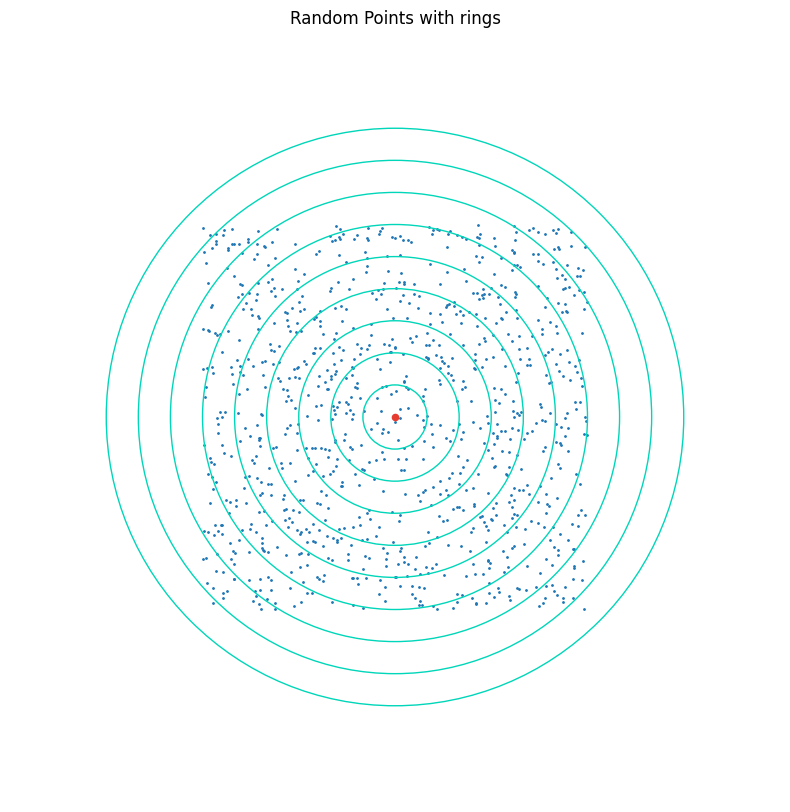
首先将各个圆环画出来

n_circle = 10 # 对于密恐患者,请不要使用过多的圆
r_range = np.linspace(0,0.75,n_circle)
 
plt.figure(figsize=(10,10))
plt.axes().set_aspect('equal')
plt.axis("off")
plt.xlim(-0.5,1.5)
plt.ylim(-0.5,1.5)
plt.scatter(data[:,0], data[:,1],s = 1)
plt.scatter(center[0], center[1],s = 20, c = '#e53d30')
# plot circle
for r in r_range:
circle = plt.Circle((center[0], center[1]), r, color='#00d6b9', fill=False)
plt.gcf().gca().add_artist(circle)
plt.title("Random Points with rings")


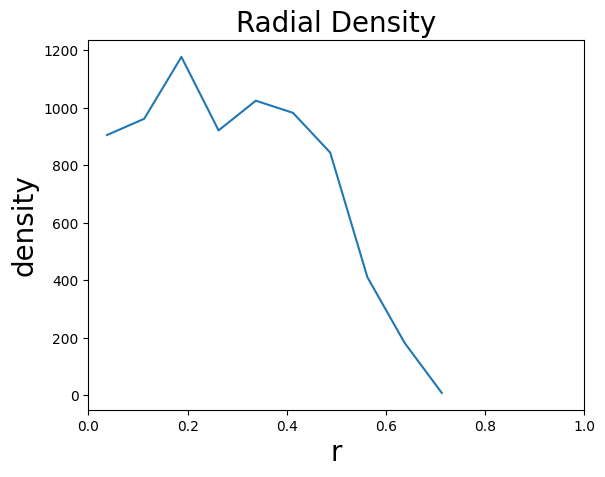
为了计算圆环内点的密度,我们只需统计各圆环内点的数量,然后将其除以圆环的面积。注意到,一个点落到哪个圆环内,只与其距中心的距离R 有关,而与方向无关,这也正是径向的含义。因此,只需计算每个点距中心的距离,并且当r ≤ R < r+ Δ r 时,对应r 的圆环内点的计数加1。numpy已经提供了类似的功能,因此这里直接使用。
 
distance = np.linalg.norm(data - center, axis = 1)
number_count,r_range = np.histogram(distance, bins = n_circle, range = (0,0.75))
 
plt.xlim(0,1)
xbins = (r_range[1:] + r_range[:-1])/2 # 圆环的中心
area = np.pi * (r_range[1:]**2 - r_range[:-1]**2) # 圆环面积
density = number_count/area # 圆环上的密度
plt.xlabel("r",fontsize = 20)
plt.ylabel("density",fontsize = 20)
plt.title("Radial Density",fontsize = 20)
plt.plot(xbins, density)


可以看见,在r < 0.5 的时候,密度接近于1000,也就是点的平均密度。而当r > 0.5 时,由于生成的点只在(0,1)的范围内,此时圆环越来越“空”,密度也快速下降。

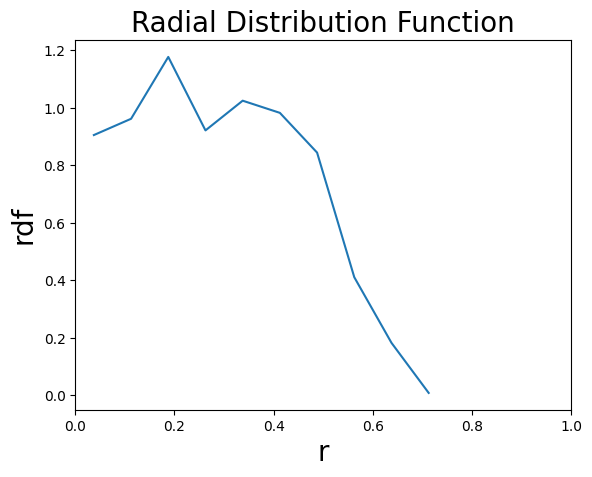
但是,这和RDF有什么关系呢?事实上,RDF只不过是用密度再除以一下平均密度而已,g(r)=ρρ(r)
 
plt.xlim(0,1)
rdf = density/n_points
plt.xlabel("r",fontsize = 20)
plt.ylabel("rdf",fontsize = 20)
plt.title("Radial Distribution Function",fontsize = 20)
plt.plot(xbins, rdf)


这里提供一段简短的代码,读者可自行修改点的数量与圆环的数量,观察一下它们对RDF曲线的影响。
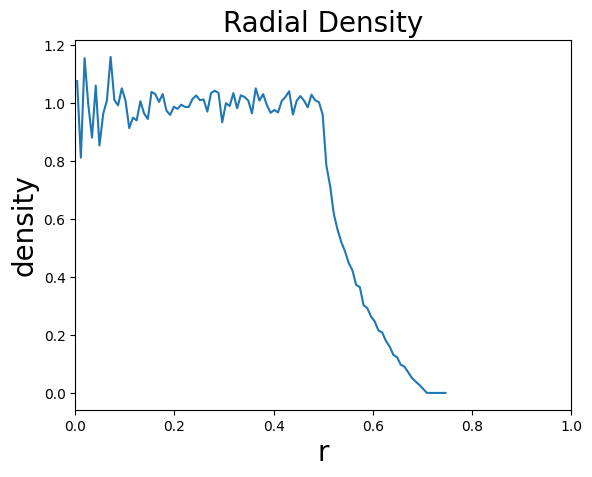
 
n_points = 100000 # 点的数量
data = np.random.random((n_points,2))
 
n_circle = 100 # 圆环的数量
dist = np.linalg.norm(data - center, axis=1)
number_count,r_range = np.histogram(dist, bins = n_circle, range = (0,0.75))
 
plt.xlim(0,1)
xbins = (r_range[1:] + r_range[:-1])/2
area = np.pi * (r_range[1:]**2 - r_range[:-1]**2)
rdf = number_count/area/n_points
plt.xlabel("r",fontsize = 20)
plt.ylabel("density",fontsize = 20)
plt.title("Radial Density",fontsize = 20)
plt.plot(xbins, rdf)


引入额外的点


均匀分布的点,其RDF平平无奇,因为任何位置的密度都与平均密度相同。让我们增加一些额外的点,让局部的密度上升,看看会发生什么。
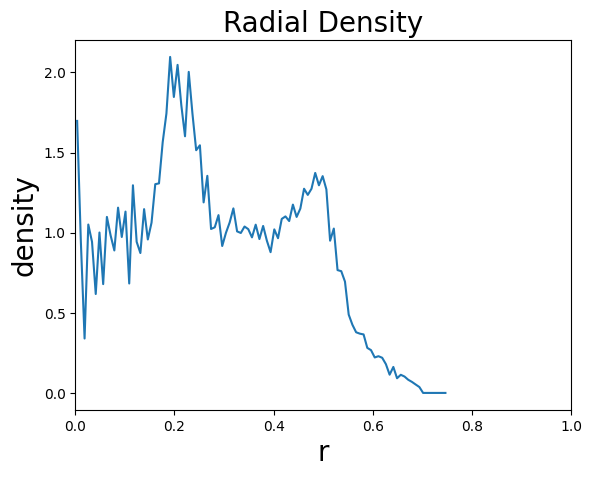

n_points = 10000
data = np.random.random((n_points,2))
center = np.array([0.5,0.5])
 
# 增加两处密度较大的区域
n_add = 1000
addtion1 = np.random.random((n_add,2))*0.1 + 0.3
addtion2 = np.random.random((n_add,2))*0.1 + 0.8
data = np.concatenate((data,addtion1,addtion2),axis = 0)
 
n_circle = 100
dist = np.linalg.norm(data - center, axis=1)
number_count,r_range = np.histogram(dist, bins = n_circle, range = (0,0.75))
 
plt.xlim(0,1)
xbins = (r_range[1:] + r_range[:-1])/2
area = np.pi * (r_range[1:]**2 - r_range[:-1]**2)
rdf = number_count/area/n_points
plt.xlabel("r",fontsize = 20)
plt.ylabel("density",fontsize = 20)
plt.title("Radial Density",fontsize = 20)
plt.plot(xbins, rdf)


可以看见,RDF曲线上出现了两处峰,这意味着在对应的r 处,点的密度突然增大了。让我们把散点画出来,看看发生了什么。
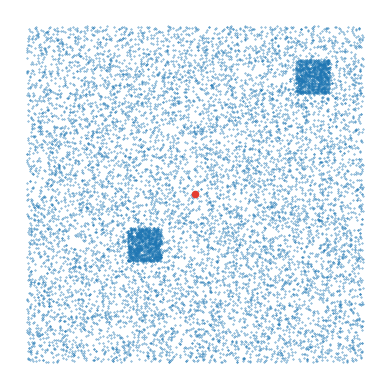
 
plt.axes().set_aspect('equal')
plt.axis("off")
plt.scatter(data[:,0], data[:,1],s = 0.1)
plt.scatter(center[0], center[1],s = 20, c = '#e53d30')


可以看见,在中心点的左下和右上方,分别有两块点密度很大的区域,RDF上的两个峰,正是对应了这两个区域的出现。这就是说,RDF可以告诉我们沿着径向密度的变化,或说包含了这部分信息,但请注意,RDF不包含方向信息,它只能告诉我们各个方向密度的平均值。


MDtraj 计算径向分布函数


基本上,计算分子动力学轨迹的RDF与前述计算RDF的方式是十分类似的,唯一不同的是,中心点通常不止一个,轨迹不止一帧。放轻松,这并不会带来更多本质上的复杂度,只不过前面的圆环在这里变成了球壳,剩下的只是按照前述的思路分别计算一帧一个中心点的情况,接着求平均值即可。


下面直接使用Mdtraj读取一段水分子的轨迹并计算径向分布函数


计算RDF
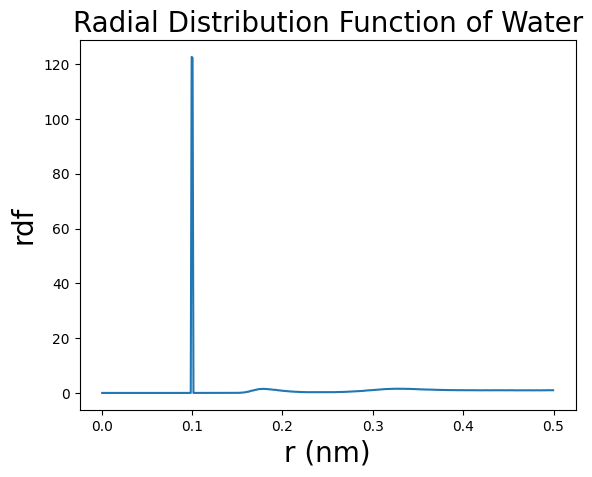
 
import mdtraj as md
import numpy as np
import matplotlib.pyplot as plt
 
# 载入轨迹文件,前者为轨迹坐标,后者为拓扑文件,用于读取结构信息
traj = md.load("demo.trr", top="demo.gro")
traj = traj[1000:1020] # 选取一段小的轨迹,便于演示
 
center = traj.topology.select("element O") # 选取氧为中心原子
ref = traj.topology.select("element H") # 选取氢为参考原子
pairs = traj.topology.select_pairs(center,ref) # 生成两种原子之间的所有配对
 
dr = 0.001 # bin的宽度
# 计算rdf,r_range为半径范围
rdf = md.compute_rdf(traj, pairs, r_range=[0,0.5], bin_width=dr)
 
# 绘制rdf
plt.plot(rdf[0],rdf[1])
plt.xlabel("r (nm)",fontsize = 20)
plt.ylabel("rdf",fontsize = 20)
plt.title("Radial Distribution Function of Water",fontsize = 20)


在约0.1 nm处有一个很强的RDF峰,这个峰对应这每个水分子上的氢原子(氢氧键的键长约为0.1 nm)


计算配位数


接下来我们计算一下配位数,所谓配位数,也就是距离中心原子距离r′ 以内的原子的数量。由以下公式给出 n(r)=0rg(r)ρ4πr2dr

由于RDF已经告诉了我们每一个球壳内原子的密度信息,将RDF乘以平均的原子密度ρ,就得到了球壳内原子的密度;接着乘以球壳的体积4πr2dr,就是球壳内原子的数量;最后累加一下(积分),就可以知道距离中心原子距离r′ 以内的原子的数量。

由于我们的RDF是离散的,因此将积分改为求和,并且使用以下公式计算球壳体积即可 Vn(r)=34π(r+Δr)334πr3=34π(r3+3r2Δr+3rΔr2+Δr3)34πr3=34π(3r2Δr+3rΔr2+Δr3)4πr2Δr 由于Δr 很小,因此可以忽略其二阶和三阶项

n(r)=Σg(r)ρ4πr2Δr

实际上也就是是将积分改为求和,dr替换为了Δr


rho = len(ref)/traj.unitcell_volumes[0] # 计算氢原子的数密度
coordination_number = []
for r, g_r in zip(rdf[0], rdf[1]):
coordination_number.append(4*np.pi*r*r*rho*g_r*dr + coordination_number[-1] if coordination_number else 0)
 
plt.plot(rdf[0],coordination_number)
plt.xlabel("r (nm)",fontsize = 20)
plt.ylabel("coordination number",fontsize = 20)


可以看见,曲线在0.1 nm处出现了明显的转折,对应的数值大约为2,也即对应了水分子中两个氢原子。


寻峰与绘图


在实际应用中,我们往往想知道的是离特定原子最近的一层原子的数量,这对应着到RDF第一个峰的峰谷距离以内的原子数量。总而言之,我们不仅要计算RDF,还需要找到它峰谷的位置。寻峰实际上是一个很具有一般性的问题,下面通过一个简单的例子说明如何寻峰。首先计算一段RDF。

 
center = traj.topology.select("element O") # 选取氧为中心原子
ref = traj.topology.select("element O") # 选取氢为参考原子
pairs = traj.topology.select_pairs(center,ref) # 生成两种原子之间的所有配对
 
dr = 0.001 # bin的宽度
# 计算rdf,r_range为半径范围
rdf = md.compute_rdf(traj, pairs, r_range=[0,0.5], bin_width=dr)
 
# 绘制rdf
plt.plot(rdf[0],rdf[1])
plt.xlabel("r (nm)",fontsize = 20)
plt.ylabel("rdf",fontsize = 20)
plt.title("Radial Distribution Function of Water",fontsize = 20)


这里我们直接调用scipy中信号处理的接口

  1. 先将RDF曲线平滑,便于寻峰。
  2. 将曲线反转,通过寻找峰的方式找到峰谷

也可以不反转峰,直接寻峰,然后再读取props中的'right_bases',不过亲测这样做有时候并不能正确地找到峰谷,请读者谨慎尝试

 
from scipy.signal import find_peaks
from scipy.signal import savgol_filter
 
# 平衡曲线
rdf_smooth = savgol_filter(rdf[1], 10, 1)
# 反转曲线,通过寻找峰的方式找到峰谷
peaks,props = find_peaks(-rdf_smooth,prominence=max(rdf[1])*0.02)
 
plt.plot(rdf[0],rdf[1])
plt.plot(rdf[0],rdf_smooth)
plt.scatter(rdf[0][peaks],rdf_smooth[peaks],marker="x", s=100, c="r",zorder=4)
plt.legend(["rdf","smoothed rdf","peaks"],frameon=False,fontsize=15)


可以看见,平衡之后曲线峰的位置不变,峰谷也找得较为准确。最后,可以将前面的过程简单的封装一下,便于复用。

def plot_ax(figsize=(12 / 2.54, 9 / 2.54)):
return rdf, coordination_number
 
def draw_rdf_cn(ax1,rdf,coordination_number):
"""
The function `draw_rdf_cn` takes in an axes object `ax1`, radial distribution function data `rdf`,
and coordination number data `coordination_number`, and plots the RDF and coordination number on
separate y-axes with a shared x-axis.
 
Args:
ax1: The ax1 parameter is the first subplot axis object where the RDF (Radial Distribution
Function) and its corresponding Y-axis will be plotted.
rdf: The rdf parameter is a list containing two lists: the first list contains the x-values (r
values) and the second list contains the y-values (rdf values).
coordination_number: The coordination_number parameter is a list or array containing the values of
the coordination number for each value of r in the RDF.
 
Returns:
two axes objects, `ax1` and `ax2`.
"""
x = rdf[0]
y1 = rdf[1]
y2 = coordination_number
 
# 绘制第一个Y轴的数据
ax1.plot(x, y1, color='#3370ff', label='RDF')
ax1.set_xlabel('r (nm)',fontsize=18)
ax1.set_ylabel('RDF', color='#3370ff',fontsize=18)
ax1.set_xlim(min(x),max(x))
ax1.set_ylim(0,)
 
# 创建第二个Y轴,共享X轴
ax2 = ax1.twinx()
ax2.set_ylim(0,max(y2)*1.1)
 
# 绘制第二个Y轴的数据
ax2.plot(x, y2, color='#133c9a', label='CN')
ax2.set_ylabel('Coordination Number', color='#133c9a',fontsize=18)
 
# 添加图例
lines1, labels1 = ax1.get_legend_handles_labels()
lines2, labels2 = ax2.get_legend_handles_labels()
lines = lines1 + lines2
labels = labels1 + labels2
ax1.legend(lines, labels, frameon=False,fontsize=18,loc='upper left')
 
return ax1,ax2
 
def find_rdf_peaks(ax2,rdf,cn, **kwargs):
"""
The function `find_rdf_peaks` takes in an axis object, radial distribution function (rdf), and
coordination number (cn), and plots the peaks of the rdf on the axis object.
 
Args:
ax2: ax2 is a matplotlib Axes object, which represents a subplot in a figure. It is used to plot
the RDF peaks and annotate them with text.
rdf: The `rdf` parameter is a tuple containing two arrays. The first array `rdf[0]` represents the
x-values (e.g., distance) and the second array `rdf[1]` represents the y-values (e.g., radial
distribution function).
cn: The parameter "cn" represents the values of the coordination number (or any other quantity)
corresponding to each point in the radial distribution function (rdf). It is used to plot the peaks
found in the rdf.
 
Returns:
the modified `ax2` object.
"""
 
from scipy.signal import find_peaks
from scipy.signal import savgol_filter
 
rdf_smooth = savgol_filter(rdf[1], 10, 1)
peaks,props = find_peaks(-rdf_smooth,prominence=max(rdf[1])*0.02,**kwargs)
 
for peak in peaks:
x = rdf[0][peak]
y = cn[peak]
ax2.plot(x,y,'x',color='#133c9a',markersize=10,markeredgewidth=2)
ax2.text(x,y+max(cn)*0.05,"%.2f"%y,fontsize=15,color='#133c9a',horizontalalignment='center')
 
return ax2


封装完成后,只需使用MDtraj读入轨迹,并指定中心原子和参数原子,即可迅速计算出RDF与配位数,并绘制好图片,十分地便利。对于有其他需求的读者,可以自行修改函数。


traj = md.load("demo.trr", top="demo.gro")[1000:1020]
center_sel = "element O"
ref_sel = "element O"
 
rdf,coordination_number = calc_rdf_and_cn(traj,center_sel,ref_sel)
ax1 = plot_ax()
ax1,ax2 = draw_rdf_cn(ax1,rdf,coordination_number)
ax2 = find_rdf_peaks(ax2,rdf,coordination_number)


关于RDF与配位数计算的讨论就到这里,感谢读者愿意花费时间阅读,如有问题或者建议,欢迎在评论区讨论。

原文章链接(侵删):https://bohrium.dp.tech/notebooks/9747927953

posted on 2024-04-08 11:22  计算之道  阅读(2742)  评论(0编辑  收藏  举报