

logstash编写2以及结合kibana使用
有时候根据日志的内容,可能一行不能全部显示,会延续在下一行,为了将上下内容关联在一起,于是codec插件中的multiline插件
就派上用场了,源日志内容:
[2017-09-20T16:04:34,936][INFO ][logstash.outputs.elasticsearch] Attempting to install template {:manage_template=>{"template"=>"logstash-*", "version"=>50001, "settings"=>{"index.refresh_interval"=>"5s"}, "mappings"=>{"_default_"=>{"_all"=>{"enabled"=>true, "norms"=>false}, "dynamic_templates"=>[{"message_field"=>{"path_match"=>"message", "match_mapping_type"=>"string", "mapping"=>{"type"=>"text", "norms"=>false}}}, {"string_fields"=>{"match"=>"*", "match_mapping_type"=>"string", "mapping"=>{"type"=>"text", "norms"=>false, "fields"=>{"keyword"=>{"type"=>"keyword", "ignore_above"=>256}}}}}], "properties"=>{"@timestamp"=>{"type"=>"date", "include_in_all"=>false}, "@version"=>{"type"=>"keyword", "include_in_all"=>false}, "geoip"=>{"dynamic"=>true, "properties"=>{"ip"=>{"type"=>"ip"}, "location"=>{"type"=>"geo_point"}, "latitude"=>{"type"=>"half_float"}, "longitude"=>{"type"=>"half_float"}}}}}}}}
[2017-09-20T16:04:34,949][INFO ][logstash.outputs.elasticsearch] New Elasticsearch output {:class=>"LogStash::Outputs::ElasticSearch", :hosts=>["//192.168.44.134:9200"]}
根据时间戳前面的[这个符号进行判断日志内容是否是一起的
[root@node3 conf.d]# cat multiline.conf
input {
    file {
        path => ["/var/log/logstash/logstash-plain.log"]
        start_position => "beginning"
        codec => multiline {
            pattern => "^\["
            negate => true
            what => "previous"
        }
    }
}


output {
    stdout {
        codec => rubydebug
    }
}
然后执行:
[root@node3 conf.d]# /usr/share/logstash/bin/logstash -f multiline.conf
Sending Logstash's logs to /var/log/logstash which is now configured via log4j2.properties
{
      "@version" => "1",
          "host" => "node3",
          "path" => "/var/log/logstash/logstash-plain.log",
    "@timestamp" => 2017-09-21T02:54:37.733Z,
       "message" => "[2017-09-21T10:51:10,588][INFO ][logstash.modules.scaffold] Initializing module {:module_name=>\"netflow\", :directory=>\"/usr/share/logstash/modules/netflow/configuration\"}"
}
{
      "@version" => "1",
          "host" => "node3",
          "path" => "/var/log/logstash/logstash-plain.log",
    "@timestamp" => 2017-09-21T02:54:37.743Z,
       "message" => "[2017-09-21T10:51:10,596][INFO ][logstash.modules.scaffold] Initializing module {:module_name=>\"fb_apache\", :directory=>\"/usr/share/logstash/modules/fb_apache/configuration\"}"
}
接下来开始nginx日志的收集
log_format name [escape=default|json] string,查看nginx文档,nginx日志格式支持json,于是采用json来配置nginx日志,再结合logstash的json插件来收集nginx的日志
1、首先安装nginx,这里采用yum安装,nginx存在于epel源中
2、配置nginx的日志输出为json格式
http {
    log_format  main  '$remote_addr - $remote_user [$time_local] "$request" '
                      '$status $body_bytes_sent "$http_referer" '
                      '"$http_user_agent" "$http_x_forwarded_for"';
    log_format  json  '{"@timstamp":"$time_iso8601","@version":"1","client":"$remote_addr","url":"$uri","status":"$status","domain":"$host","host":"$server_addr","size":"$body_bytes_sent","responsetime":"$request_time","referer":"$http_referer","ua":"$http_user_agent"}';

    #access_log  /var/log/nginx/access.log  main;
    access_log  /var/log/nginx/access.log  json;
3、上面配置的value值都是nginx的一些变量,查看更多变量:http://nginx.org/en/docs/http/ngx_http_core_module.html#var_status
4、启动nginx服务,查看生成的日志是否是json格式:
[root@node3 nginx]# cat /var/log/nginx/access.log
{"@timstamp":"2017-09-21T13:47:43+08:00","@version":"1","client":"192.168.44.1","url":"/index.html","status":"200","domain":"192.168.44.136","host":"192.168.44.136","size":"3698","responsetime":"0.000","referer":"-","ua":"Mozilla/5.0 (Windows NT 10.0; Win64; x64) AppleWebKit/537.36 (KHTML, like Gecko) Chrome/60.0.3112.113 Safari/537.36"}
{"@timstamp":"2017-09-21T13:47:43+08:00","@version":"1","client":"192.168.44.1","url":"/nginx-logo.png","status":"200","domain":"192.168.44.136","host":"192.168.44.136","size":"368","responsetime":"0.000","referer":"http://192.168.44.136/","ua":"Mozilla/5.0 (Windows NT 10.0; Win64; x64) AppleWebKit/537.36 (KHTML, like Gecko) Chrome/60.0.3112.113 Safari/537.36"}
{"@timstamp":"2017-09-21T13:47:43+08:00","@version":"1","client":"192.168.44.1","url":"/poweredby.png","status":"200","domain":"192.168.44.136","host":"192.168.44.136","size":"2811","responsetime":"0.000","referer":"http://192.168.44.136/","ua":"Mozilla/5.0 (Windows NT 10.0; Win64; x64) AppleWebKit/537.36 (KHTML, like Gecko) Chrome/60.0.3112.113 Safari/537.36"}
{"@timstamp":"2017-09-21T13:47:43+08:00","@version":"1","client":"192.168.44.1","url":"/404.html","status":"404","domain":"192.168.44.136","host":"192.168.44.136","size":"3652","responsetime":"0.000","referer":"http://192.168.44.136/","ua":"Mozilla/5.0 (Windows NT 10.0; Win64; x64) AppleWebKit/537.36 (KHTML, like Gecko) Chrome/60.0.3112.113 Safari/537.36"}
然后利用logstash的json格式来收集nginx访问日志:
[root@node3 conf.d]# cat json.conf
input {
    file {
        path => ["/var/log/nginx/access.log"]
        start_position => "beginning"
        codec => json
    }
}


output {
    stdout {
        codec => rubydebug
    }
}
执行编写的配置文件:
[root@node3 conf.d]# /usr/share/logstash/bin/logstash -f json.conf
Sending Logstash's logs to /var/log/logstash which is now configured via log4j2.properties
{
         "referer" => "-",
              "ua" => "Mozilla/5.0 (Windows NT 10.0; Win64; x64) AppleWebKit/537.36 (KHTML, like Gecko) Chrome/60.0.3112.113 Safari/537.36",
             "url" => "/index.html",
            "path" => "/var/log/nginx/access.log",
      "@timestamp" => 2017-09-21T05:58:44.442Z,
            "size" => "3698",
       "@timstamp" => "2017-09-21T13:47:43+08:00",
          "domain" => "192.168.44.136",
        "@version" => "1",
            "host" => "192.168.44.136",
          "client" => "192.168.44.1",
    "responsetime" => "0.000",
          "status" => "200"
}
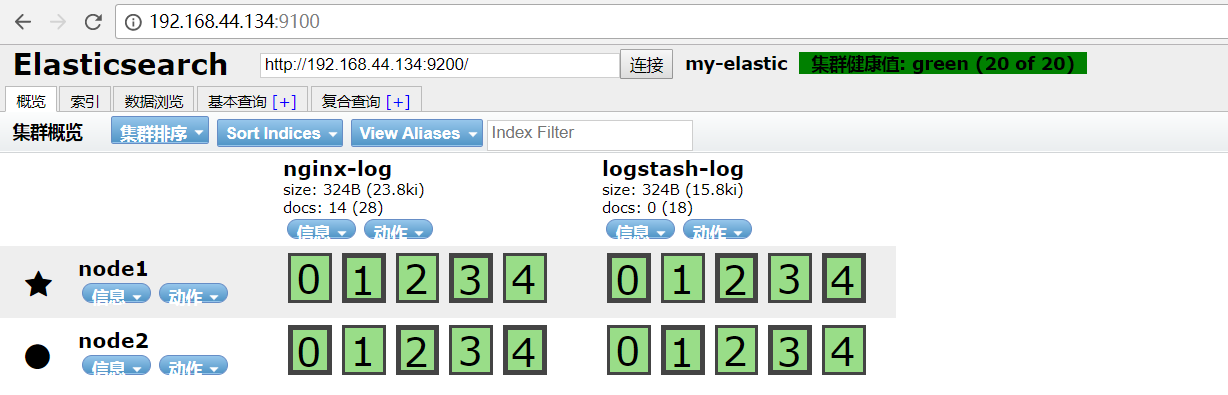
现在将上面两个的日志(logstash和nginx的日志)都输出到elasticsearch中,将es中之前的index清空,重新使用logstash收集上面的日志到es中:
[root@node3 conf.d]# cat all.conf
input {
    file {
        type => "nginx-log"
        path => ["/var/log/nginx/access.log"]
        start_position => "beginning"
        codec => json
    }
    file {
        type => "logstash-log"
        path => ["/var/log/logstash/logstash-plain.log"]
        start_position => "beginning"
        codec => multiline {
            pattern => "^\["
            negate => true
            what => "previous"
        }
    }
}

output {
    if [type] == "logstash-log" {
        elasticsearch {
            hosts => ["192.168.44.134:9200"]
            index => "logstash-log"
        }
    }
    if [type] == "nginx-log" {
        elasticsearch {
            hosts => ["192.168.44.134:9200"]
            index => "nginx-log"
        }
    }
}
然后在es上查看是否已经有数据了:
使用kibana来看看具体效果,开始安装kibana
这里采用rpm进行安装kinaba:
wget https://artifacts.elastic.co/downloads/kibana/kibana-5.6.1-x86_64.rpm
/etc/default/kibana
/etc/init.d/kibana
/etc/kibana/kibana.yml
/etc/systemd/system/kibana.service
/usr/share/kibana/LICENSE.txt
/usr/share/kibana/NOTICE.txt
/usr/share/kibana/README.txt
/usr/share/kibana/bin/kibana
/usr/share/kibana/bin/kibana-plugin
/usr/share/kibana/node/CHANGELOG.md
/usr/share/kibana/node/LICENSE
/usr/share/kibana/node/README.md
/usr/share/kibana/node/bin/node
/usr/share/kibana/node/bin/npm
修改kibana的配置:
[root@node3 ~]# egrep -v "^#|^$" /etc/kibana/kibana.yml
server.port: 5601
server.host: "192.168.44.136"
server.name: "node3"
elasticsearch.url: "http://192.168.44.134:9200"
kibana.index: ".kibana"
然后启动kibana:
[root@node3 ~]# /etc/init.d/kibana start
kibana started
[root@node3 ~]# netstat -tunlp
Active Internet connections (only servers)
Proto Recv-Q Send-Q Local Address               Foreign Address             State       PID/Program name
tcp        0      0 0.0.0.0:80                  0.0.0.0:*                   LISTEN      6948/nginx
tcp        0      0 0.0.0.0:22                  0.0.0.0:*                   LISTEN      1301/sshd
tcp        0      0 192.168.44.136:5601         0.0.0.0:*                   LISTEN      7451/node
访问kibana查看是否已经和es结合起来了:
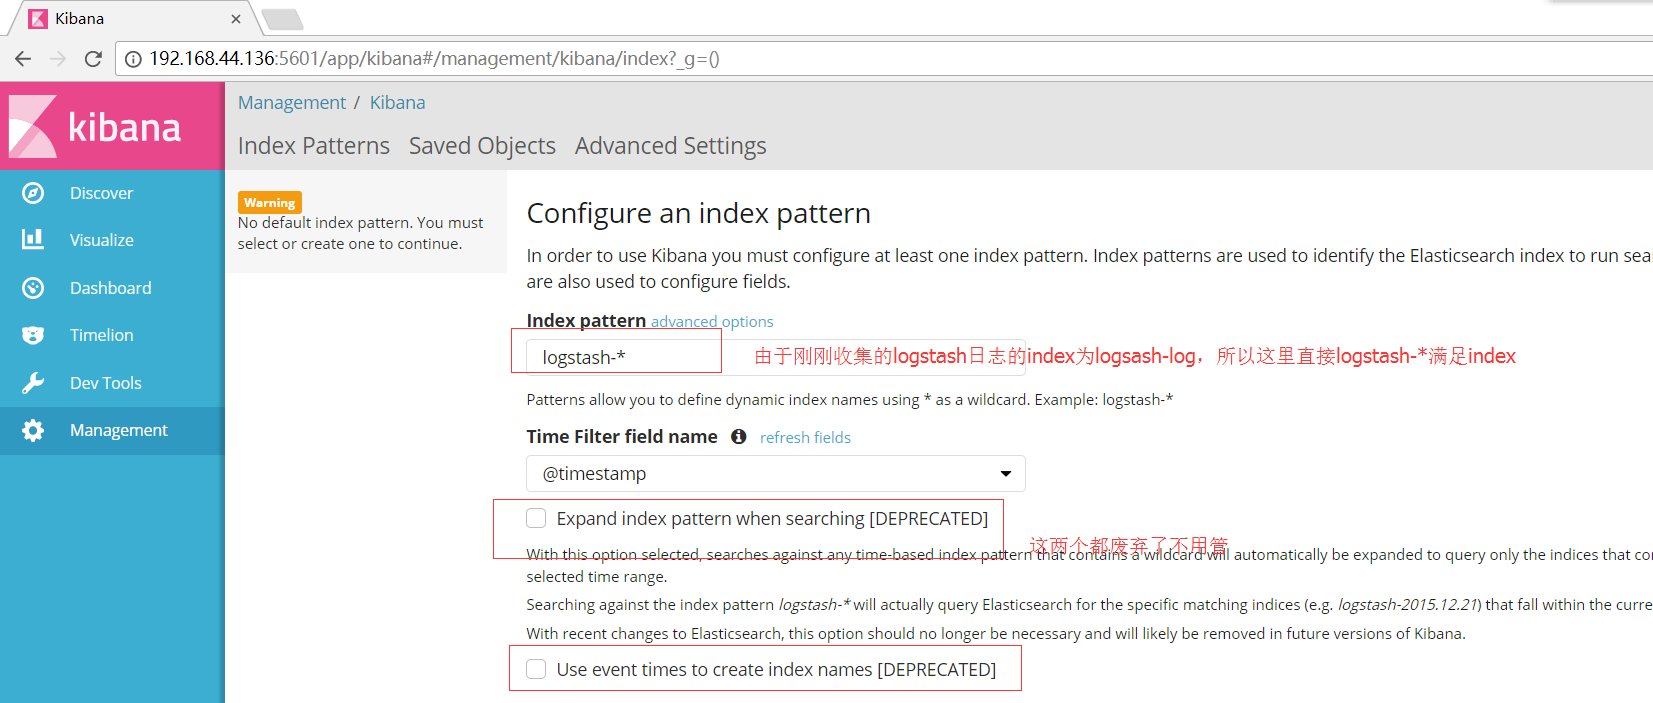
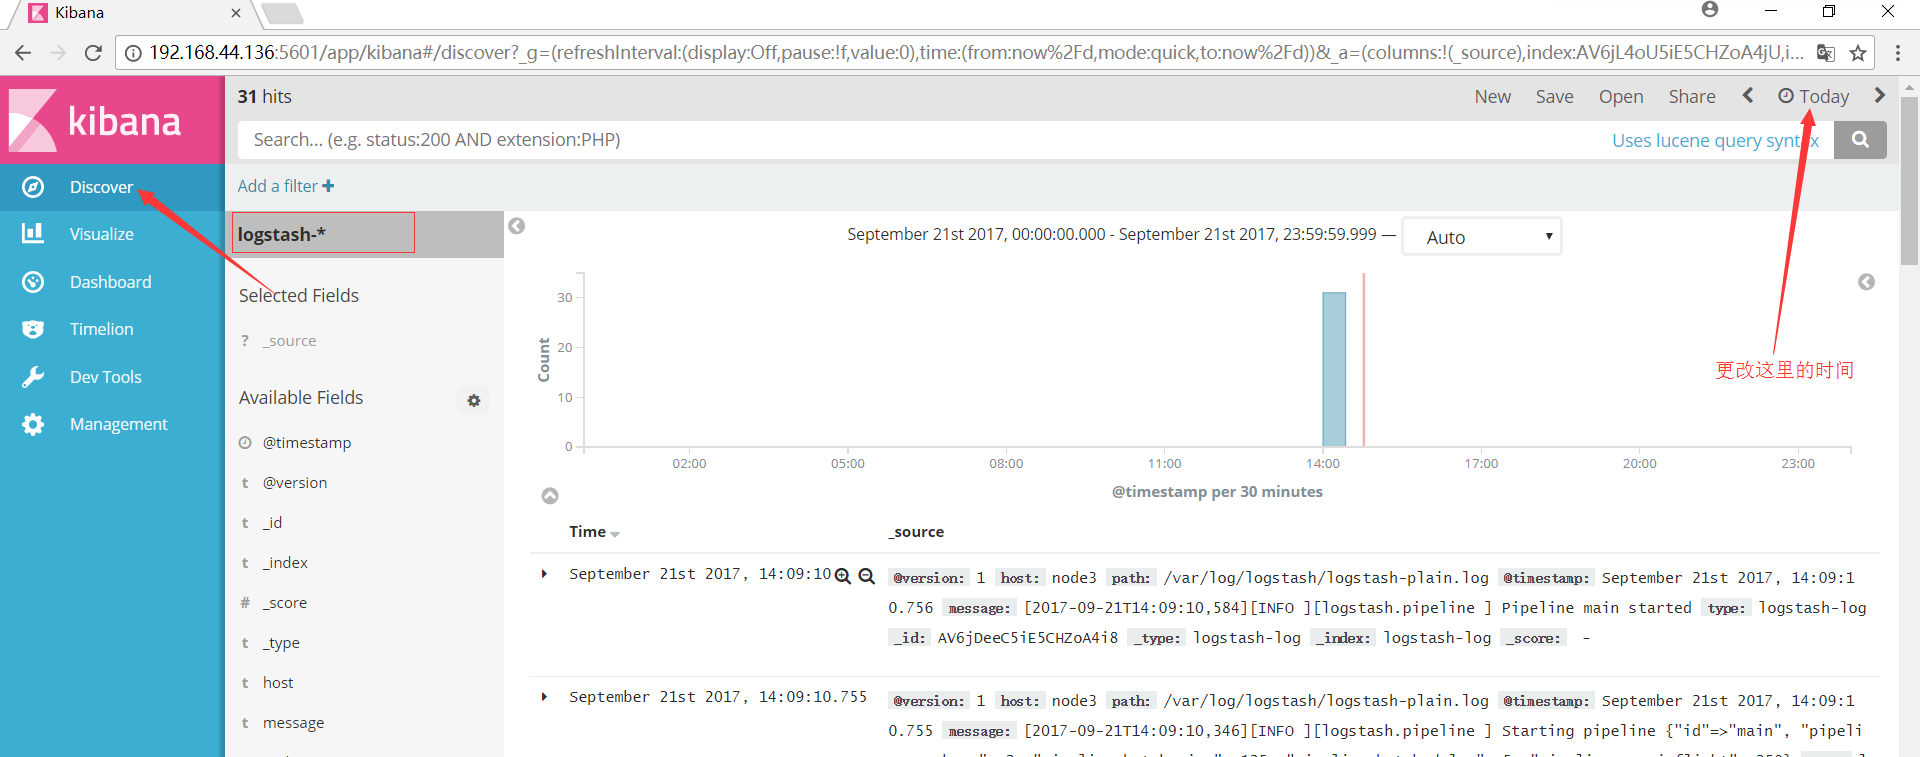
现在将es中的nginx-log这个索引添加到kibana中:

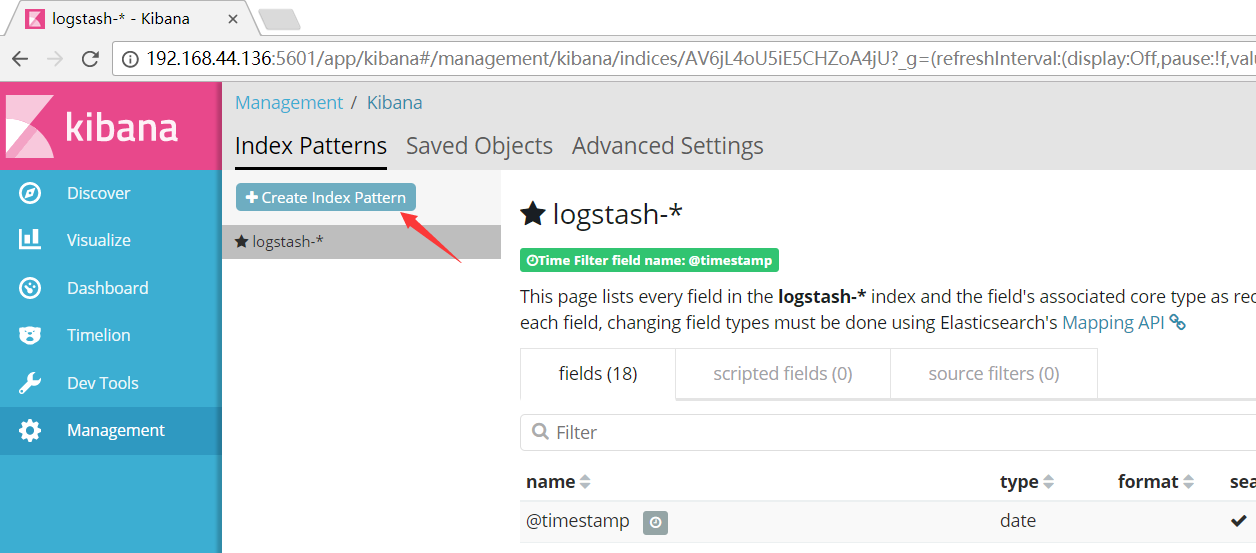


于是kibana与es的简单结合操作完成
继续编logstash的配置文件:收集syslog的日志
[root@node3 conf.d]# cat syslog.conf
input {
    syslog {
        type => "syslog"
        host => "192.168.44.136"
        port => "514"
    }
}


output {
    stdout {
        codec => rubydebug
    }
}
查看端口是否已经起来了:
[root@node3 conf.d]# netstat -tunlp
Active Internet connections (only servers)
Proto Recv-Q Send-Q Local Address               Foreign Address             State       PID/Program name
tcp        0      0 0.0.0.0:80                  0.0.0.0:*                   LISTEN      6948/nginx
tcp        0      0 0.0.0.0:22                  0.0.0.0:*                   LISTEN      1301/sshd
tcp        0      0 192.168.44.136:5601         0.0.0.0:*                   LISTEN      7451/node
tcp        0      0 :::80                       :::*                        LISTEN      6948/nginx
tcp        0      0 :::22                       :::*                        LISTEN      1301/sshd
tcp        0      0 ::ffff:127.0.0.1:9600       :::*                        LISTEN      7669/java
tcp        0      0 ::ffff:192.168.44.136:514   :::*                        LISTEN      7669/java
udp        0      0 0.0.0.0:68                  0.0.0.0:*                               1128/dhclient
udp        0      0 ::ffff:192.168.44.136:514   :::*                                    7669/java
修改rsyslog配置文件:
vim /etc/rsyslog.conf添加到最后一行:
*.* @@192.168.44.136:514
重启rsyslog服务:
[root@node3 conf.d]# /etc/init.d/rsyslog restart
关闭系统日志记录器:                                       [确定]
启动系统日志记录器:                                       [确定]
[root@node3 conf.d]# /usr/share/logstash/bin/logstash -f syslog.conf
Sending Logstash's logs to /var/log/logstash which is now configured via log4j2.properties
{
          "severity" => 6,
           "program" => "kernel",
           "message" => "imklog 5.8.10, log source = /proc/kmsg started.\n",
              "type" => "syslog",
          "priority" => 6,
         "logsource" => "node3",
        "@timestamp" => 2017-09-21T07:28:55.000Z,
          "@version" => "1",
              "host" => "192.168.44.136",
          "facility" => 0,
    "severity_label" => "Informational",
         "timestamp" => "Sep 21 15:28:55",
    "facility_label" => "kernel"
}
接下来使用tcp插件进行收集数据:
[root@node3 conf.d]# cat tcp.conf
input {
    tcp {
        host => ["192.168.44.136"]
        port => "6666"
    }
}

output {
    stdout {
        codec => rubydebug
    }
}
[root@node3 conf.d]# netstat -tunlp
Active Internet connections (only servers)
Proto Recv-Q Send-Q Local Address               Foreign Address             State       PID/Program name
tcp        0      0 0.0.0.0:80                  0.0.0.0:*                   LISTEN      6948/nginx
tcp        0      0 0.0.0.0:22                  0.0.0.0:*                   LISTEN      1301/sshd
tcp        0      0 192.168.44.136:5601         0.0.0.0:*                   LISTEN      7451/node
tcp        0      0 :::80                       :::*                        LISTEN      6948/nginx
tcp        0      0 :::22                       :::*                        LISTEN      1301/sshd
tcp        0      0 ::ffff:127.0.0.1:9600       :::*                        LISTEN      7867/java
tcp        0      0 ::ffff:192.168.44.136:6666  :::*                        LISTEN      7867/java
可以看见端口6666已经开启了,现在开始测试:
[root@node3 ~]# nc 192.168.44.136 6666 < /etc/resolv.conf
[root@node3 ~]# nc 192.168.44.136 6666 < /etc/resolv.conf
[root@node3 conf.d]# /usr/share/logstash/bin/logstash -f tcp.conf
Sending Logstash's logs to /var/log/logstash which is now configured via log4j2.properties
{
      "@version" => "1",
          "host" => "192.168.44.136",
    "@timestamp" => 2017-09-21T07:44:25.087Z,
       "message" => "; generated by /sbin/dhclient-script",
          "port" => 54117
}
{
      "@version" => "1",
          "host" => "192.168.44.136",
    "@timestamp" => 2017-09-21T07:44:25.090Z,
       "message" => "search localdomain",
          "port" => 54117
}
下篇讲解将日志通过logstash收集到redis,然后再通过logstash从redis取出数据输出到es,通过kibana进行展示

 浙公网安备 33010602011771号