Prometheus笔记-安装Node_exporter
Node_exporter是可以在* Nix和Linux系统上运行的计算机度量标准的导出器。
Node_exporter 主要用于暴露 metrics 给 Prometheus,其中 metrics 包括:cpu 的负载,内存的使用情况,网络等。
配置文件
修改主配置文件
[root@VM-24-9-centos prometheus-2.41.0.linux-amd64]# vi prometheus.yml
global:
  scrape_interval: 15s # #每15s采集一次数据
  evaluation_interval: 15s #每15s做一次告警检测.
  # scrape_timeout is set to the global default (10s).

# Alertmanager configuration(告警配置)
alerting:
  alertmanagers:
    - static_configs:
        - targets:
          # - alertmanager:9093

# rule_files 加载告警规则文件
rule_files:
  # - "first_rules.yml"
  # - "second_rules.yml"

# A scrape configuration containing exactly one endpoint to scrape:
# Here it's Prometheus itself.
scrape_configs:
  # 定义一个job名称
  - job_name: "prometheus"

    # 默认指标地址 '/metrics'
    metrics_path: '/metrics'
    # scheme defaults to 'http'.
    scheme: 'http'
    file_sd_configs:
      - files: ["/usr/local/src/Prometheus_server/prometheus-2.41.0.linux-amd64/child_config/prometheus.yml"]

  - job_name: "node_exporter"
    metrics_path: '/metrics'
    scheme: 'http'
    file_sd_configs:
      - files: ["/usr/local/src/Prometheus_server/prometheus-2.41.0.linux-amd64/child_config/node_exporter.yml"]
新增子配置文件
[root@VM-24-9-centos child_config]# vi node_exporter.yml
- targets: ['localhost:9100']
  labels:
    env: 'test'
    host: 'localhosti'
    type: 'node_exporter'
下载node_exporter
# 下载
wget https://github.com/prometheus/node_exporter/releases/download/v1.5.0/node_exporter-1.5.0.linux-amd64.tar.gz
# 使用第三方加速 https://ghproxy.com/
wget wget https://ghproxy.com/https://github.com/prometheus/node_exporter/releases/download/v1.5.0/node_exporter-1.5.0.linux-amd64.tar.gz
安装node_exporter
[root@VM-24-9-centos exporter_package]# tar -zxvf node_exporter-1.5.0.linux-amd64.tar.gz
node_exporter-1.5.0.linux-amd64/
node_exporter-1.5.0.linux-amd64/LICENSE
node_exporter-1.5.0.linux-amd64/NOTICE
node_exporter-1.5.0.linux-amd64/node_exporter
node_exporter启动
常用启动配置项
--web.listen-address=":9100"
#node_exporter监听的端口,默认是9100,若需要修改则通过此参数。

--web.telemetry-path="/metrics"
#获取metric信息的url,默认是/metrics,若需要修改则通过此参数

--log.level="info"
#设置日志级别

--log.format="logger:stderr"
#设置打印日志的格式,若有自动化日志提取工具可以使用这个参数规范日志打印的格式

# 以下内容不常用
--collector.diskstats.ignored-devices="^(ram|loop|fd|(h|s|v|xv)d[a-z]|nvme\\d+n\\d+p)\\d+$"
#通过正则表达式忽略某些磁盘的信息收集

--collector.filesystem.ignored-mount-points="^/(dev|proc|sys|var/lib/docker/.+)($|/)"
#通过正则表达式忽略某些文件系统挂载点的信息收集

--collector.filesystem.ignored-fs-types="^(autofs|binfmt_misc|bpf|cgroup2?|configfs|debugfs|devpts|devtmpfs|fusectl|hugetlbfs|mqueue|nsfs|overlay|proc|procfs|pstore|rpc_pipefs|securityfs|selinuxfs|squashfs|sysfs|tracefs)$"
#通过正则表达式忽略某些文件系统类型的信息收集

--collector.netclass.ignored-devices="^$"
#通过正则表达式忽略某些网络类的信息收集

--collector.netdev.ignored-devices="^$"
#通过正则表达式忽略某些网络设备的信息收集

  --collector.netstat.fields="^$"
 #通过正则表达式配置需要获取的网络状态信息

--collector.vmstat.fields="^(oom_kill|pgpg|pswp|pg.*fault).*"
#通过正则表达式配置vmstat返回信息中需要收集的选项
启动node_exporter
[root@VM-24-9-centos node_exporter-1.5.0.linux-amd64]# nohup ./node_exporter --web.listen-address=":9100" &
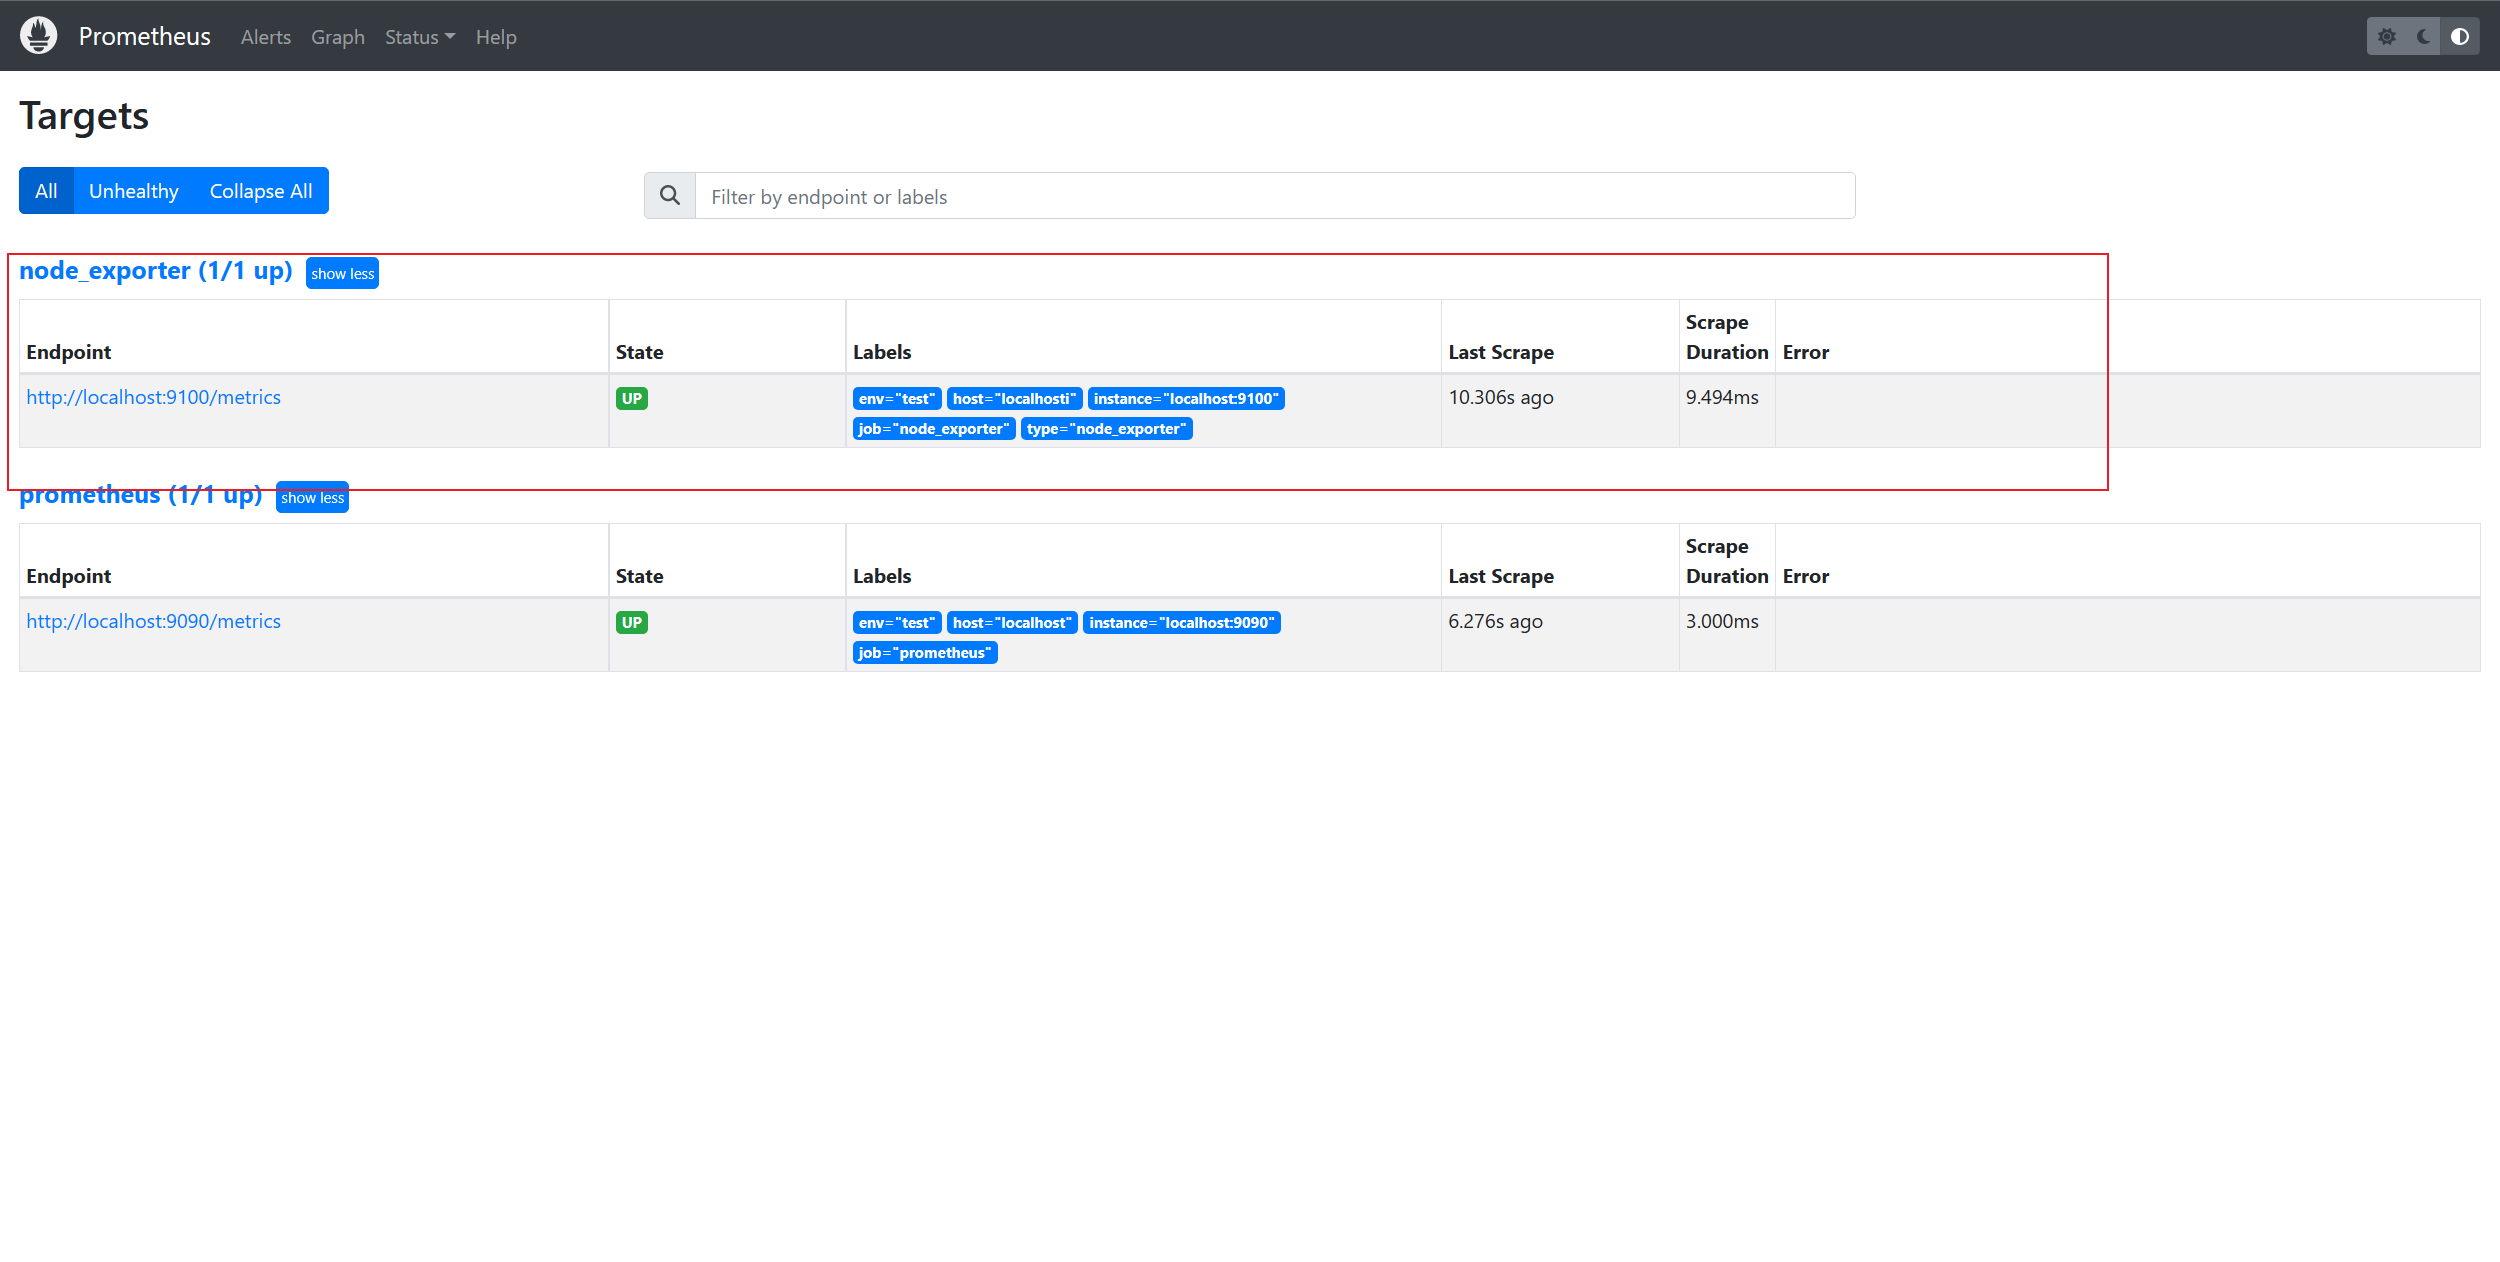
显示效果
本文来自博客园,作者:Jruing,转载请注明原文链接:https://www.cnblogs.com/jruing/p/17057625.html

 浙公网安备 33010602011771号