Prometheus笔记-安装
官网
下载Prometheus
安装Prometheus
配置文件
# my global config
global:
  scrape_interval: 15s # #每15s采集一次数据
  evaluation_interval: 15s #每15s做一次告警检测.
  # scrape_timeout is set to the global default (10s).

# Alertmanager configuration(告警配置)
alerting:
  alertmanagers:
    - static_configs:
        - targets:
          # - alertmanager:9093

# rule_files 加载告警规则文件
rule_files:
  # - "first_rules.yml"
  # - "second_rules.yml"

# A scrape configuration containing exactly one endpoint to scrape:
# Here it's Prometheus itself.
scrape_configs:
  # 定义一个job名称
  - job_name: "prometheus"

    # 默认指标地址 '/metrics'
  	metrics_path: '/metrics'
    # scheme defaults to 'http'.
    scheme: 'http'

	  # 静态指定每一个监控目标
    static_configs:
      # 监控目标节点地址,可以并列写入多个目标节点地址(格式为 机器ip:端口),以逗号隔开
      - targets: ["localhost:9090"]
启动服务
[root@VM-24-9-centos prometheus-2.41.0.linux-amd64]# ./prometheus --config.file='prometheus.yml'

ts=2023-01-08T03:53:40.822Z caller=main.go:512 level=info msg="No time or size retention was set so using the default time retention" duration=15d
ts=2023-01-08T03:53:40.823Z caller=main.go:556 level=info msg="Starting Prometheus Server" mode=server version="(version=2.41.0, branch=HEAD, revision=c0d8a56c69014279464c0e15d8bfb0e153af0dab)"
ts=2023-01-08T03:53:40.823Z caller=main.go:561 level=info build_context="(go=go1.19.4, platform=linux/amd64, user=root@d20a03e77067, date=20221220-10:40:45)"
ts=2023-01-08T03:53:40.823Z caller=main.go:562 level=info host_details="(Linux 3.10.0-1160.11.1.el7.x86_64 #1 SMP Fri Dec 18 16:34:56 UTC 2020 x86_64 VM-24-9-centos (none))"
ts=2023-01-08T03:53:40.823Z caller=main.go:563 level=info fd_limits="(soft=100002, hard=100002)"
ts=2023-01-08T03:53:40.823Z caller=main.go:564 level=info vm_limits="(soft=unlimited, hard=unlimited)"
ts=2023-01-08T03:53:40.840Z caller=web.go:559 level=info component=web msg="Start listening for connections" address=0.0.0.0:9090
ts=2023-01-08T03:53:40.840Z caller=main.go:993 level=info msg="Starting TSDB ..."
ts=2023-01-08T03:53:40.842Z caller=tls_config.go:232 level=info component=web msg="Listening on" address=[::]:9090
ts=2023-01-08T03:53:40.842Z caller=tls_config.go:235 level=info component=web msg="TLS is disabled." http2=false address=[::]:9090
ts=2023-01-08T03:53:40.843Z caller=head.go:562 level=info component=tsdb msg="Replaying on-disk memory mappable chunks if any"
ts=2023-01-08T03:53:40.843Z caller=head.go:606 level=info component=tsdb msg="On-disk memory mappable chunks replay completed" duration=3.827µs
ts=2023-01-08T03:53:40.843Z caller=head.go:612 level=info component=tsdb msg="Replaying WAL, this may take a while"
ts=2023-01-08T03:53:40.845Z caller=head.go:683 level=info component=tsdb msg="WAL segment loaded" segment=0 maxSegment=0
ts=2023-01-08T03:53:40.845Z caller=head.go:720 level=info component=tsdb msg="WAL replay completed" checkpoint_replay_duration=14.226µs wal_replay_duration=2.00604ms wbl_replay_duration=130ns total_replay_duration=2.041035ms
ts=2023-01-08T03:53:40.846Z caller=main.go:1014 level=info fs_type=EXT4_SUPER_MAGIC
ts=2023-01-08T03:53:40.846Z caller=main.go:1017 level=info msg="TSDB started"
ts=2023-01-08T03:53:40.846Z caller=main.go:1197 level=info msg="Loading configuration file" filename=prometheus.yml
ts=2023-01-08T03:53:40.847Z caller=main.go:1234 level=info msg="Completed loading of configuration file" filename=prometheus.yml totalDuration=555.287µs db_storage=2.605µs remote_storage=2.565µs web_handler=160ns query_engine=451ns scrape=259.664µs scrape_sd=20.178µs notify=28.153µs notify_sd=8.496µs rules=2.965µs tracing=13.535µs
ts=2023-01-08T03:53:40.847Z caller=main.go:978 level=info msg="Server is ready to receive web requests."
ts=2023-01-08T03:53:40.847Z caller=manager.go:953 level=info component="rule manager" msg="Starting rule manager..."
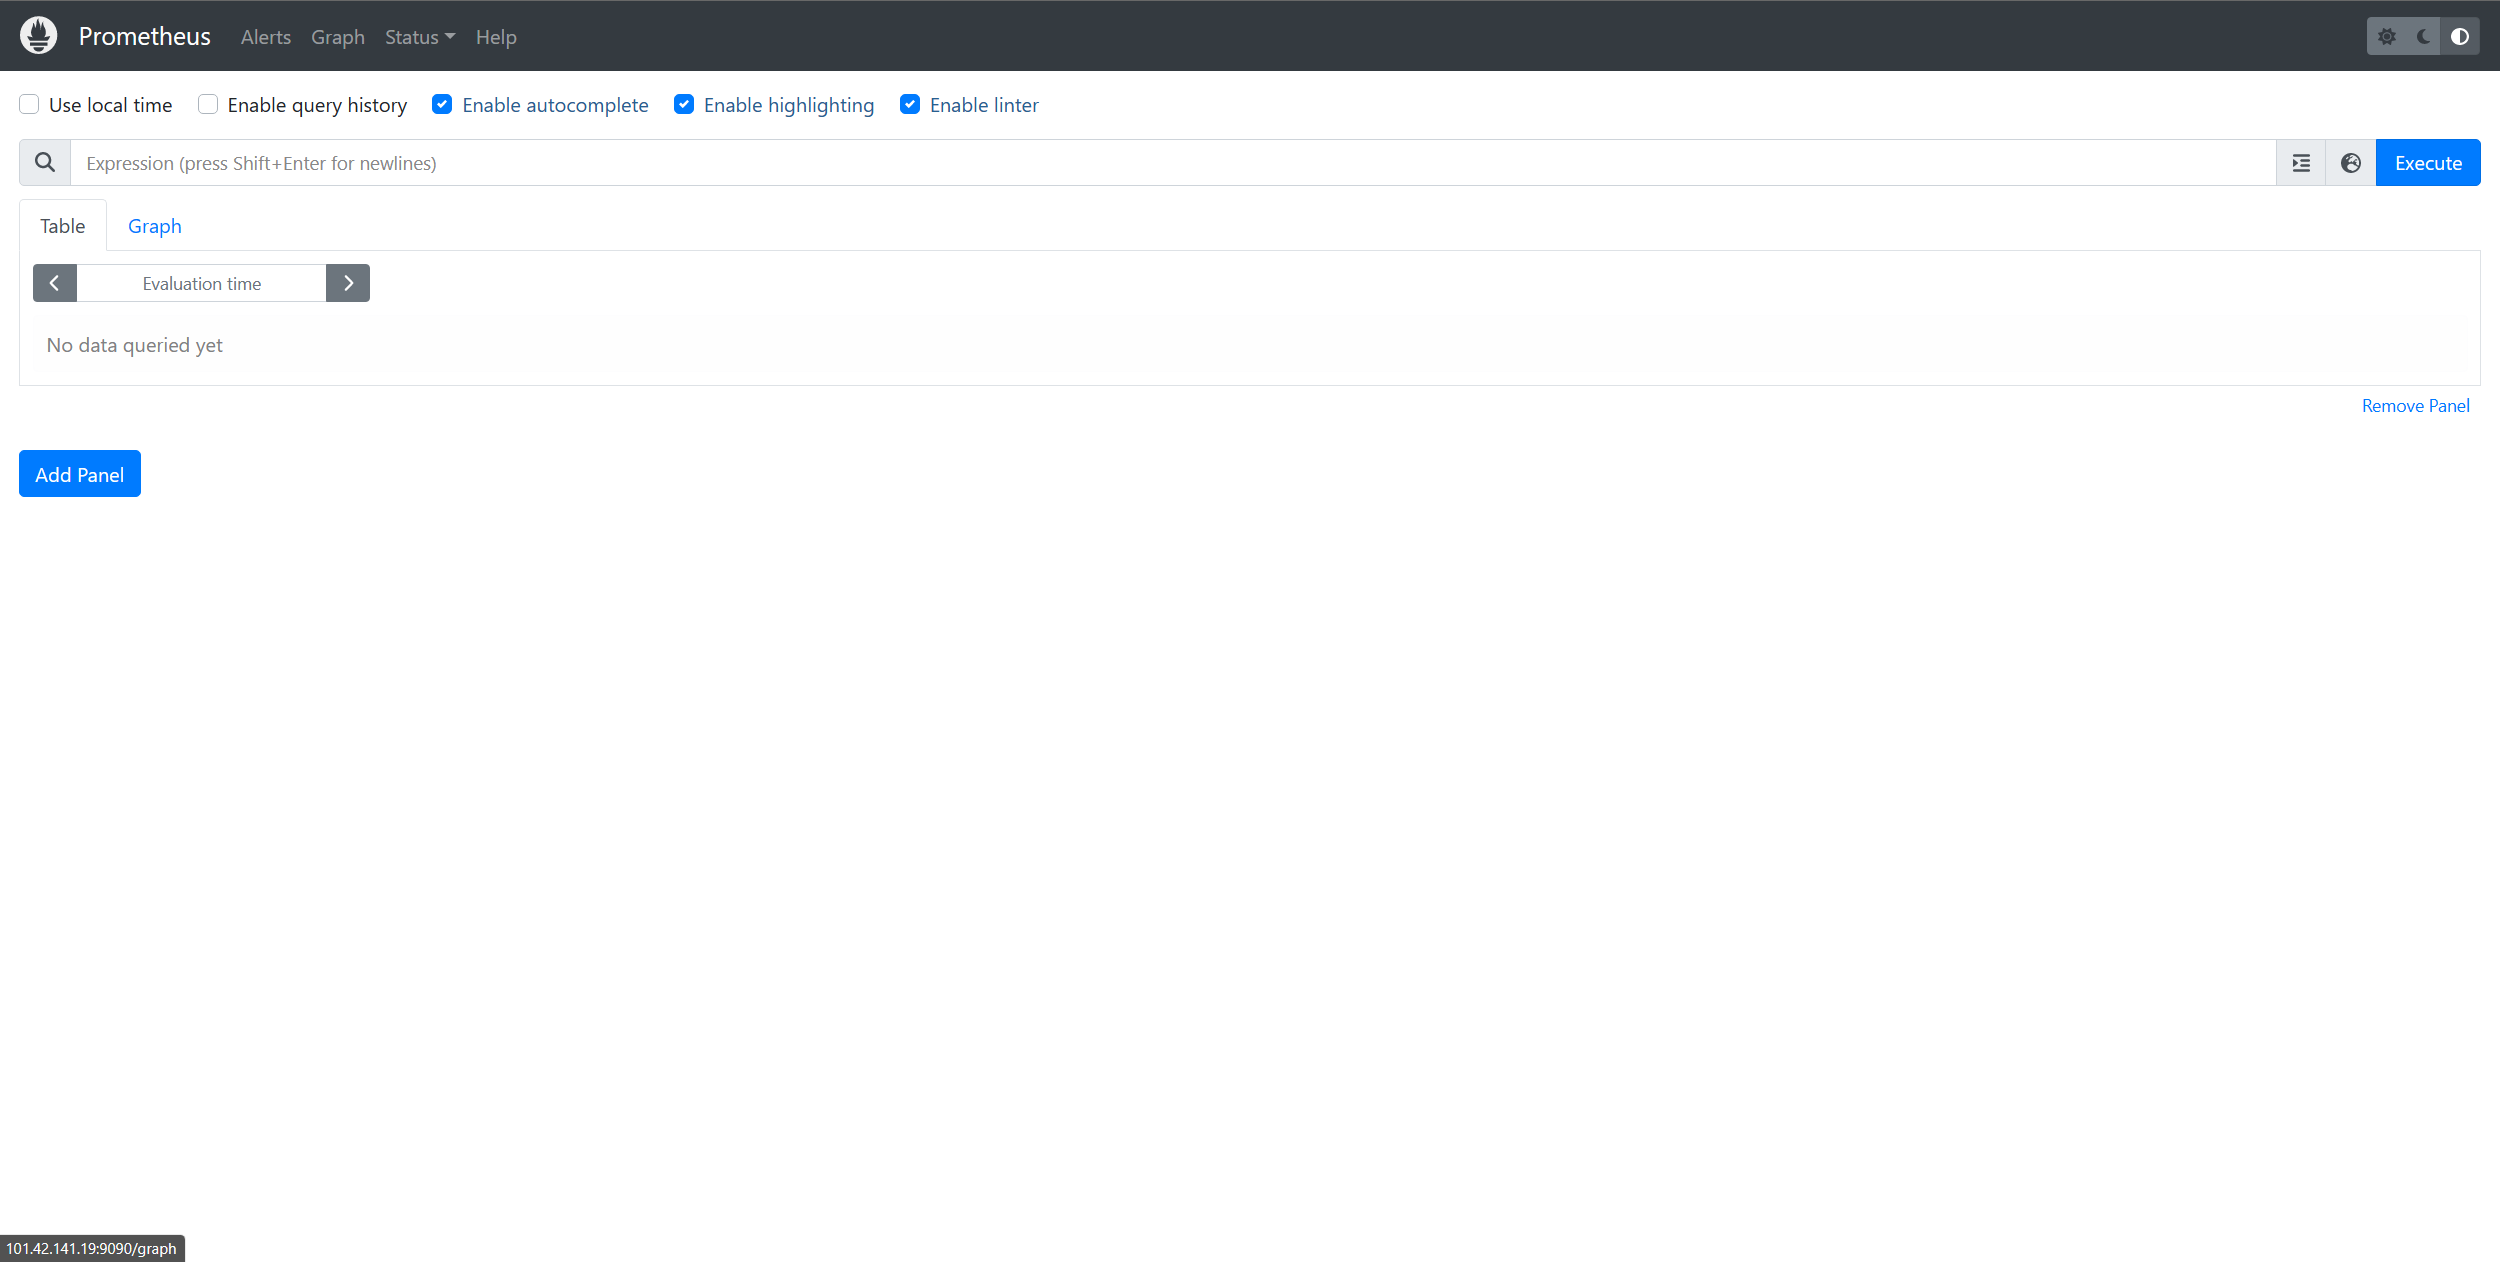
显示效果
Prometheus默认端口为 9090,访问地址为ip:9090, 能看到如下页面就代表Prometheus安装成功了(如果是在云服务器上安装,需要开通防火墙)
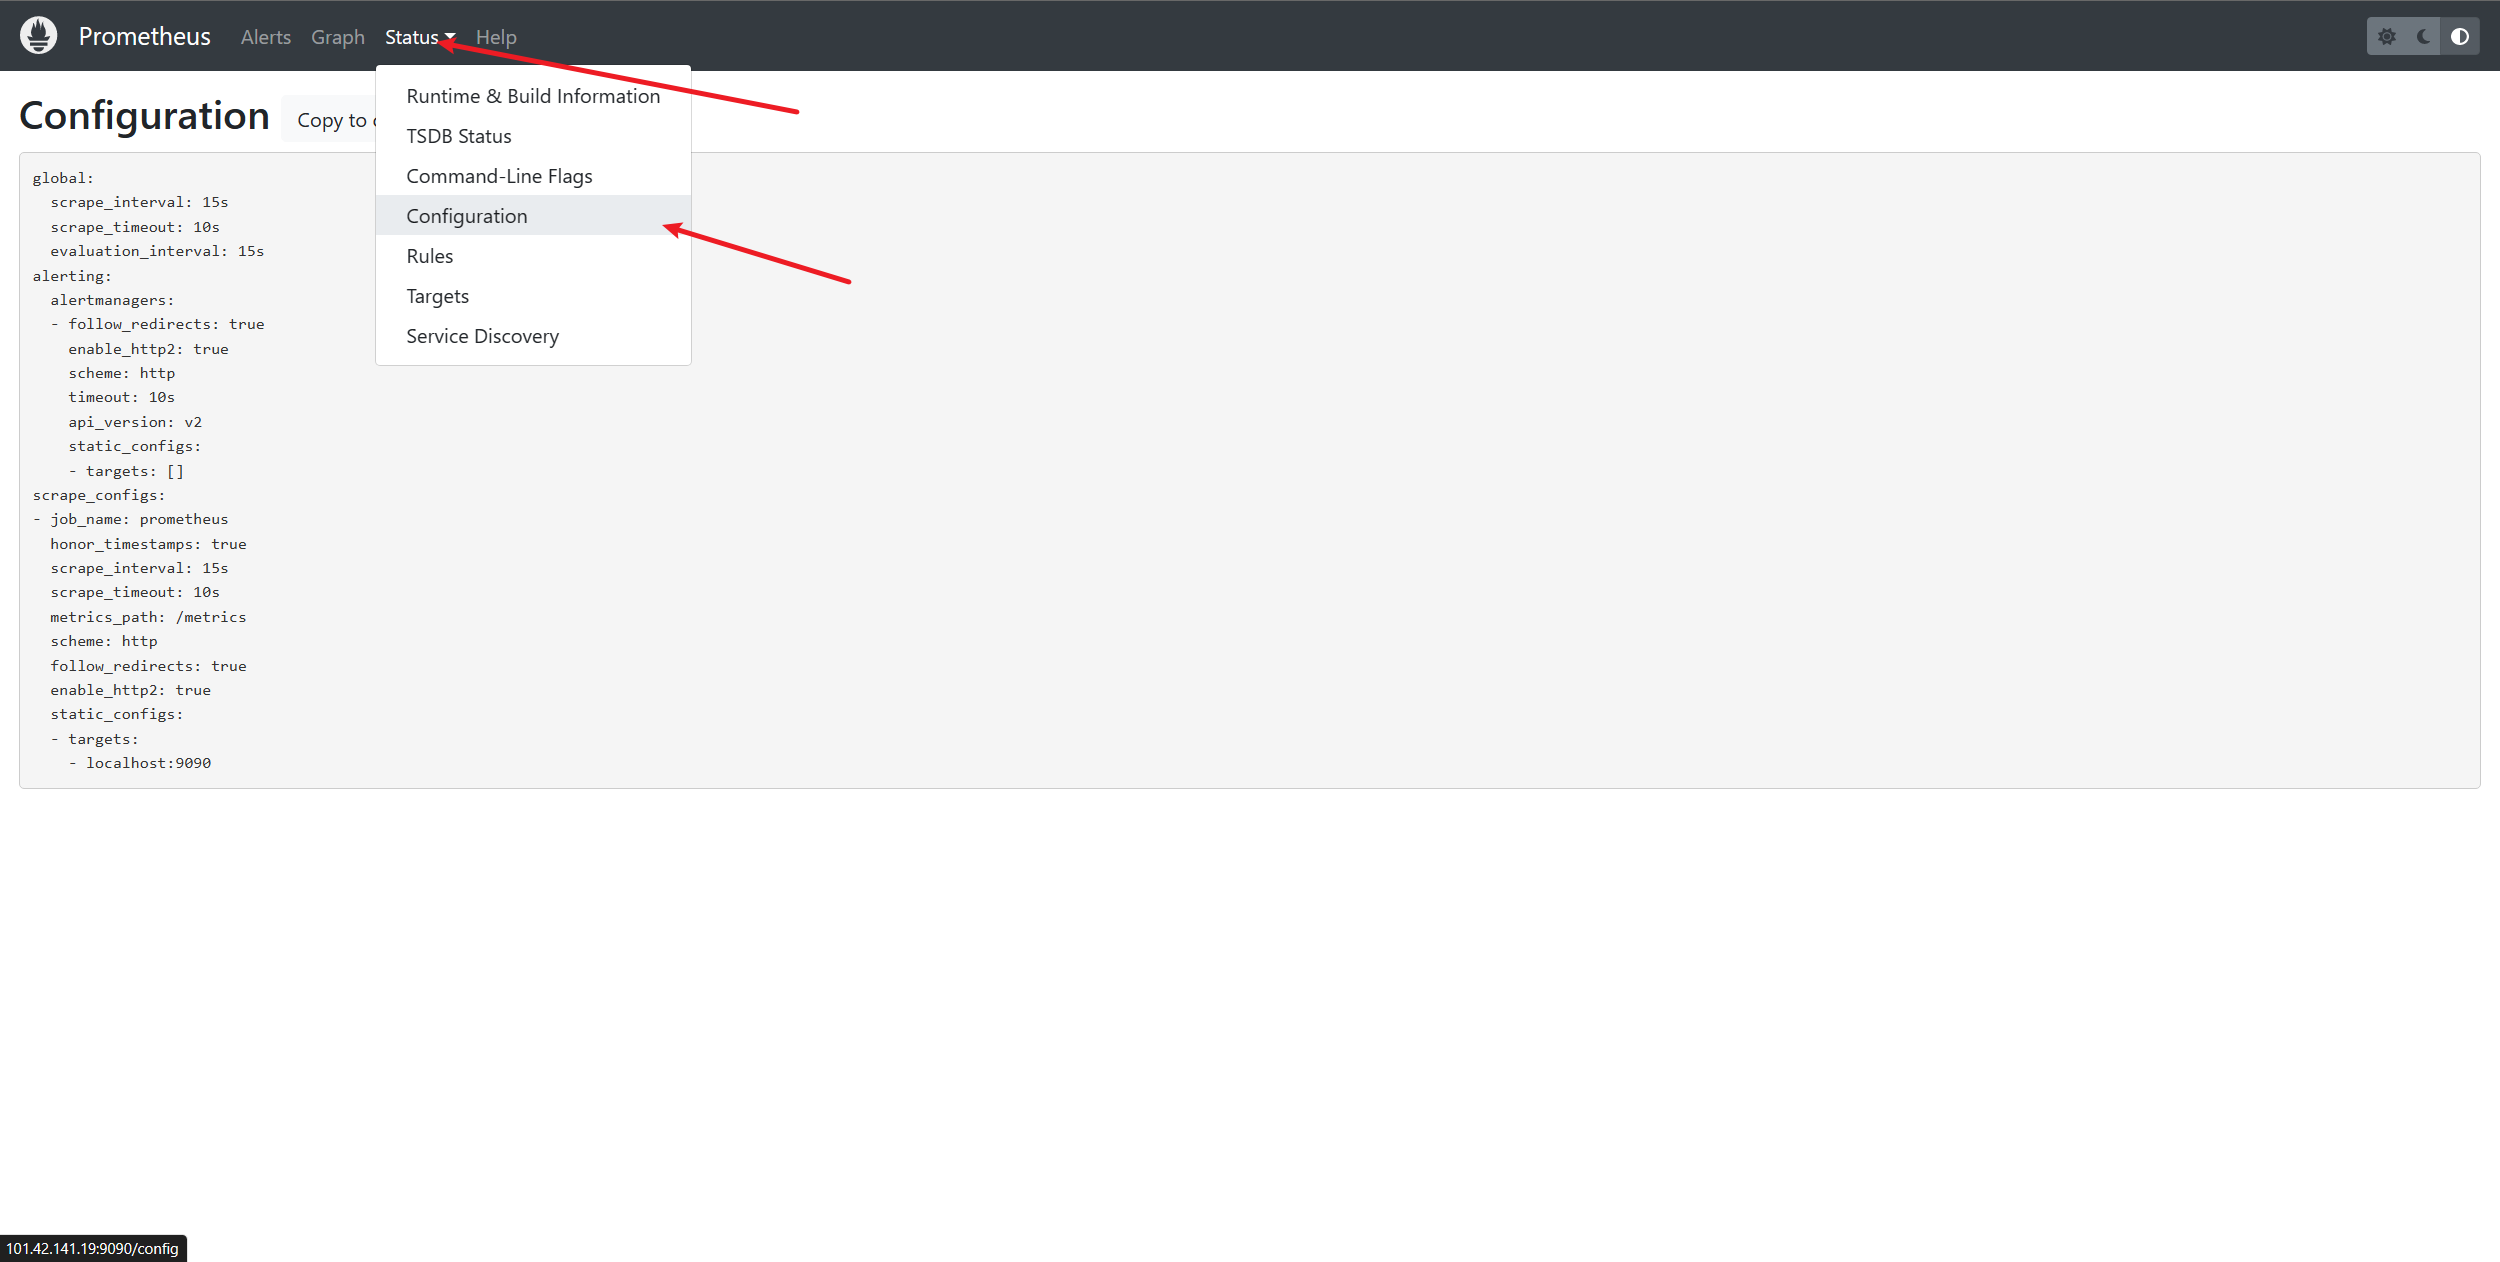
查看配置文件(在webui中查看)
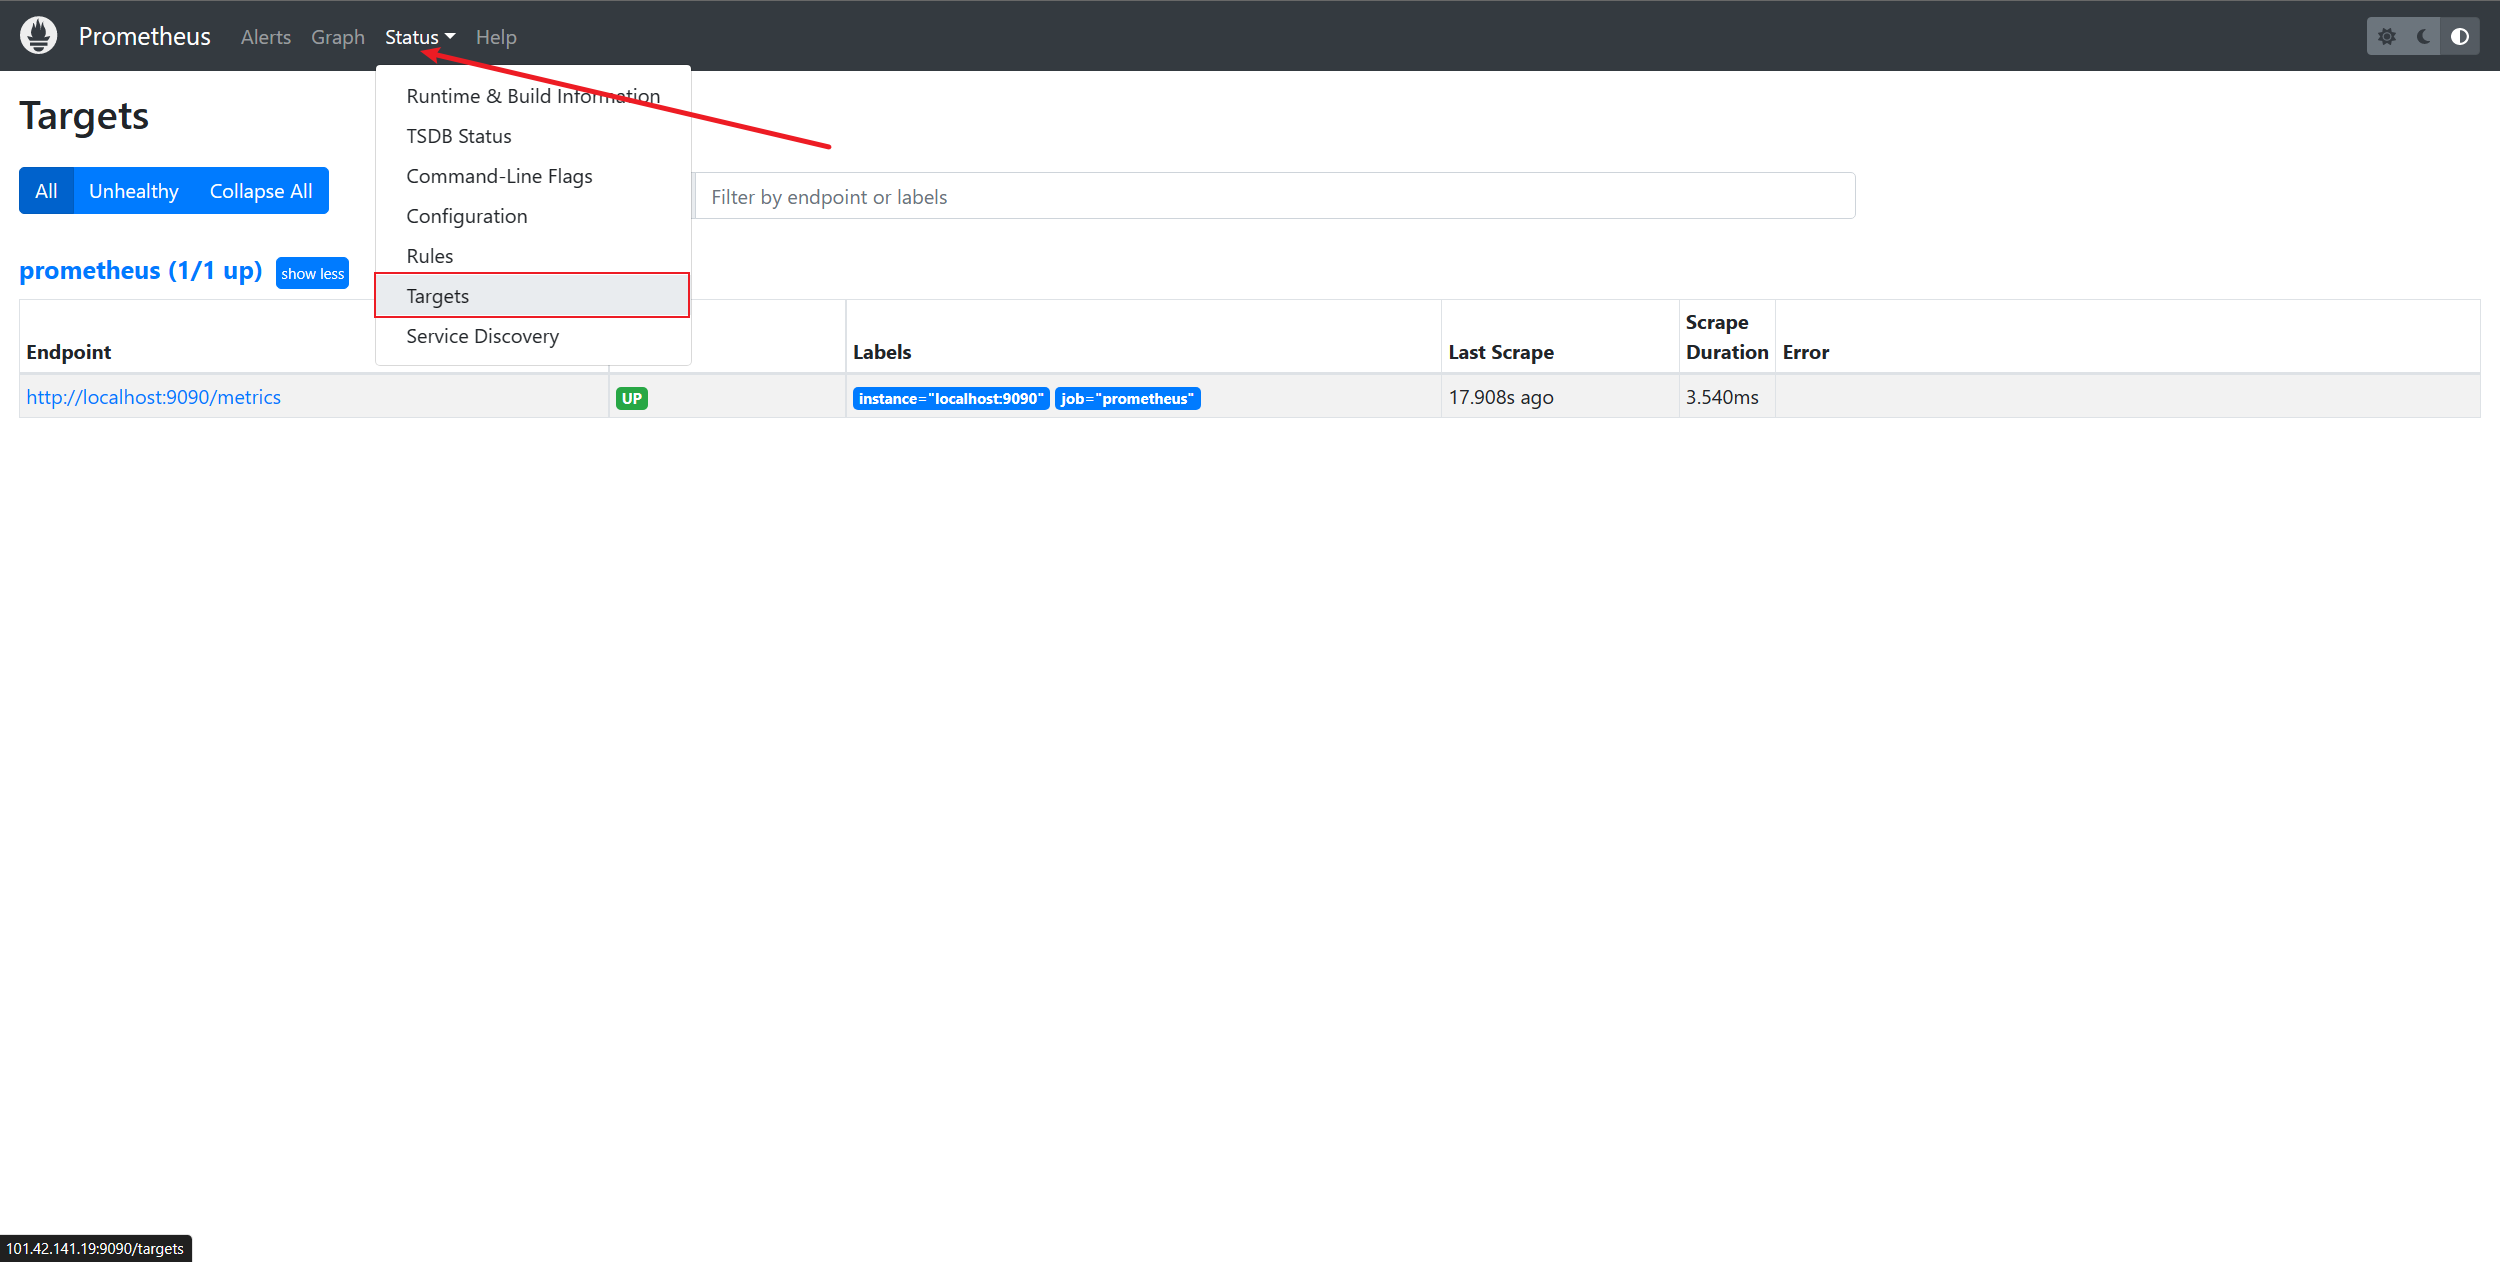
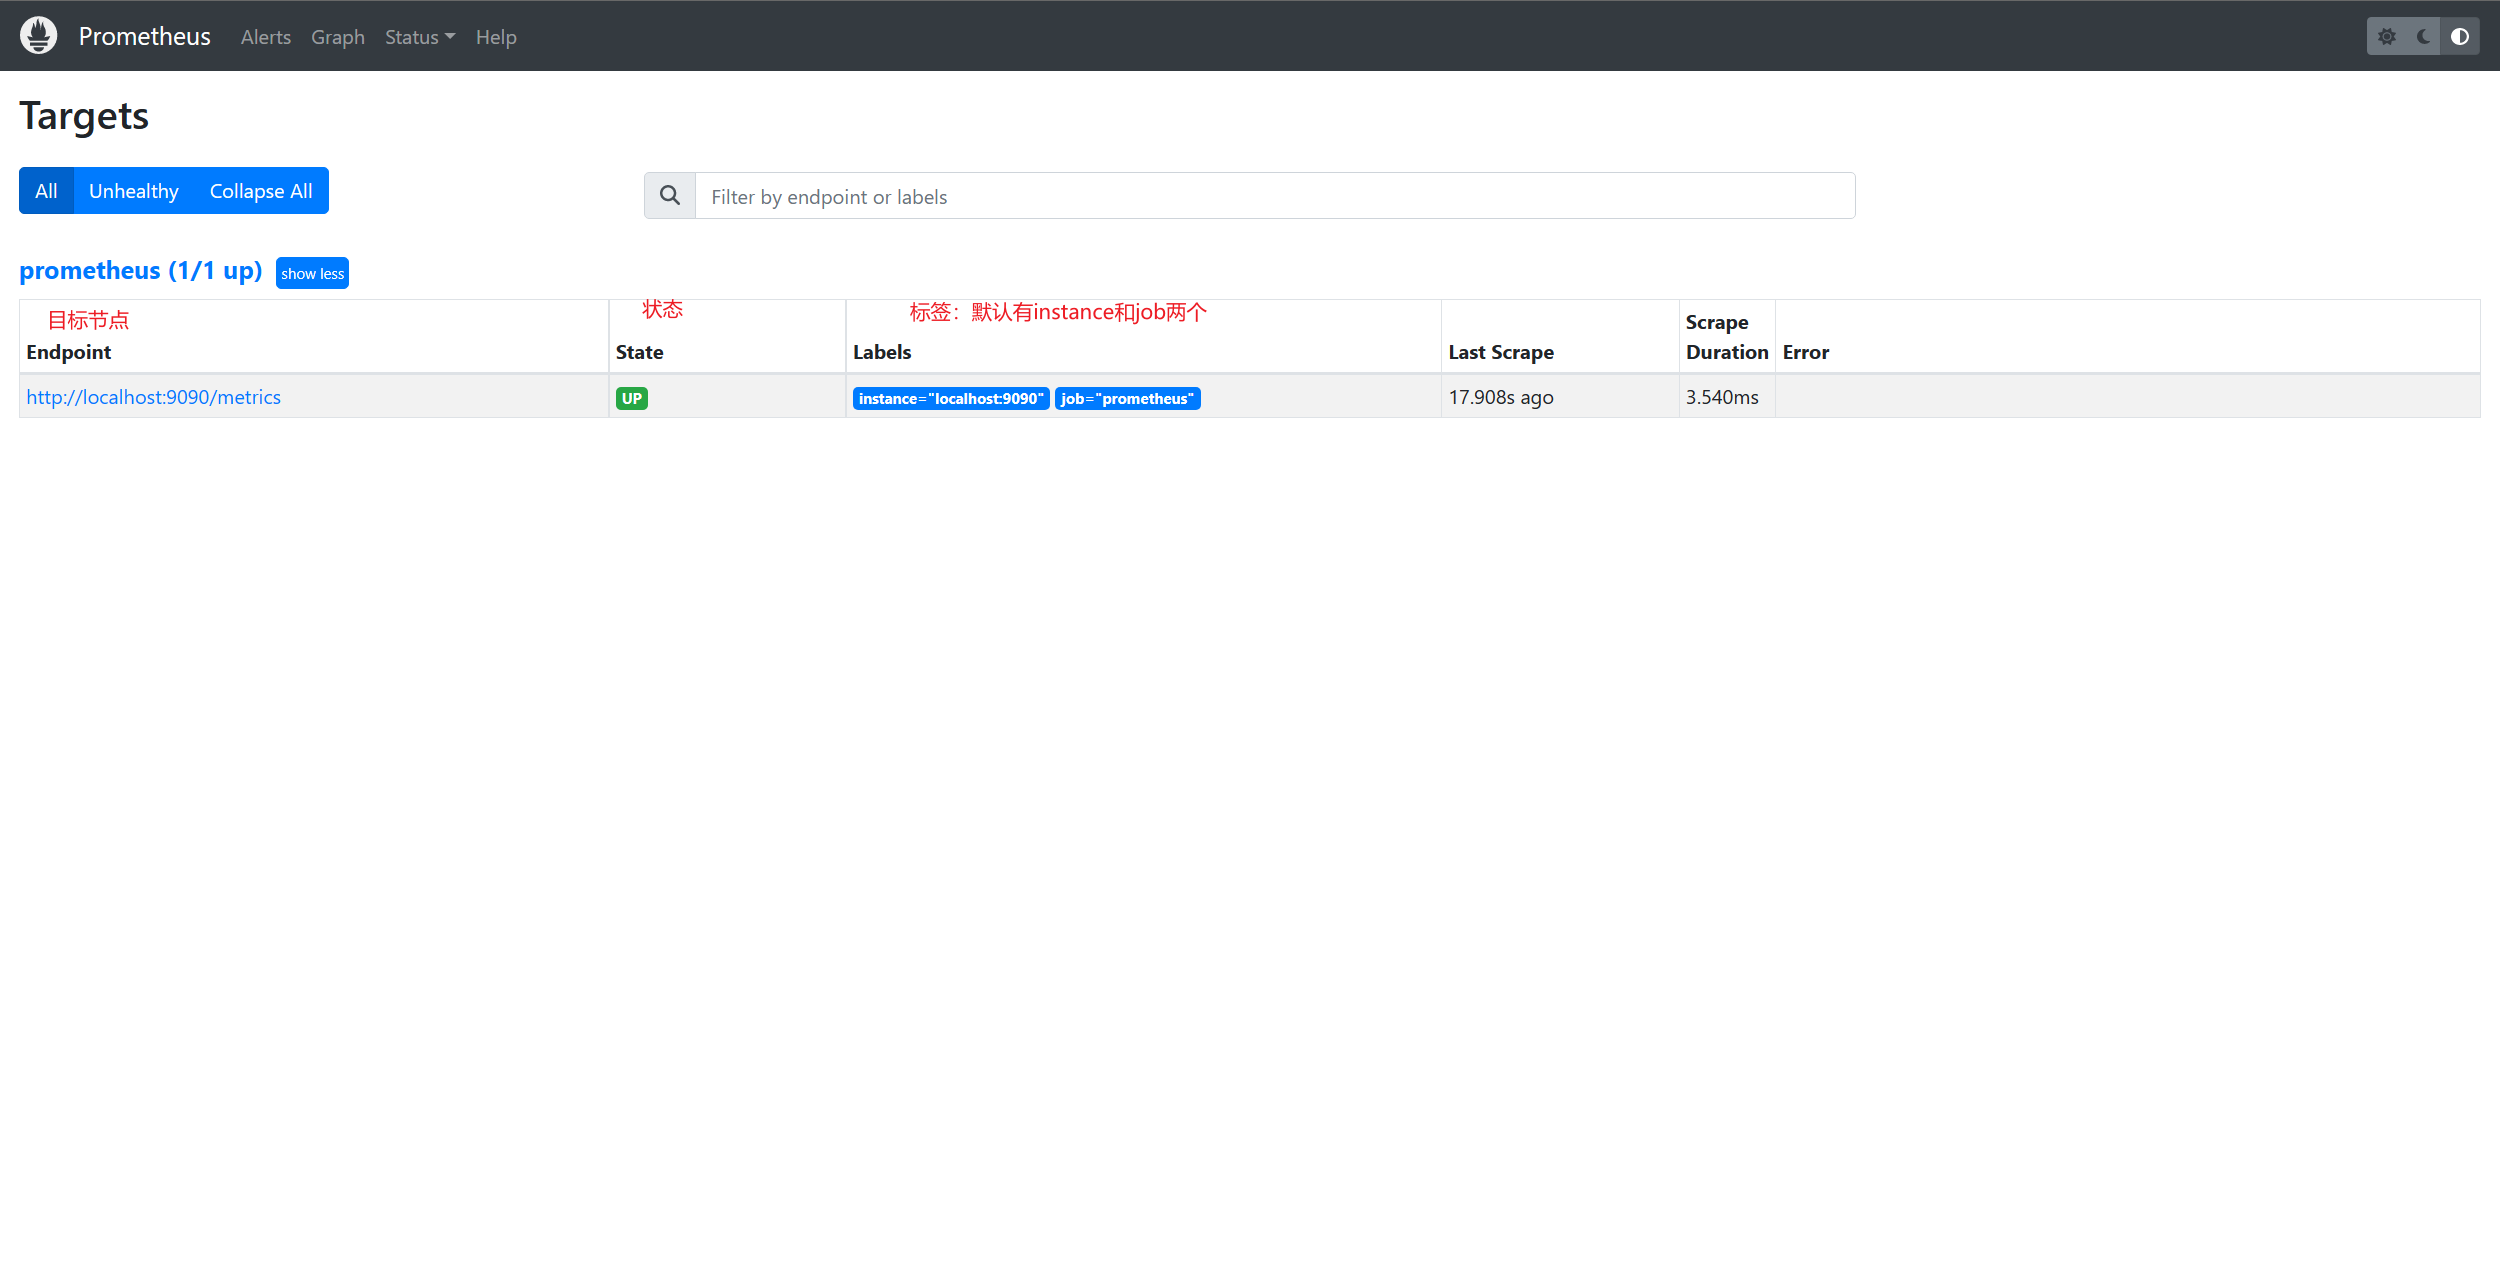
查看监控节点(在webui中查看)
本文来自博客园,作者:Jruing,转载请注明原文链接:https://www.cnblogs.com/jruing/p/17057592.html

 浙公网安备 33010602011771号