深度学习与医学图像处理 案例学习3——Covid19肺炎检测(CXR图像)
内容引用自https://www.kaggle.com/mahmoudreda55/x-ray-covid19-95
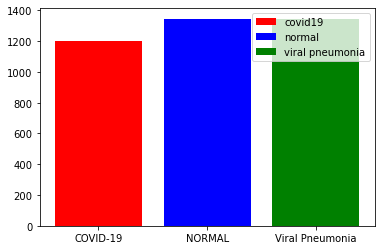
数据集中的影像模式为胸部X线,共有COVID-19数据1200例,1341例正常人影像和1345例病毒性肺炎影像。
#导入数据包
import kerastuner as kt
from tensorflow import keras
import tensorflow as tf
from kerastuner.tuners import RandomSearch
from kerastuner.engine.hyperparameters import HyperParameter as hp
from keras.layers import Dense,Dropout,Activation,Add,MaxPooling2D,Conv2D,Flatten
from keras.models import Sequential
from keras.preprocessing.image import ImageDataGenerator
import numpy as np
import matplotlib.pyplot as plt
from keras.applications import VGG19
from keras import layers
from keras.preprocessing import image
import matplotlib.pyplot as plt
import seaborn as sns
import os
import numpy as np
import pandas as pd
#读入数据
base_path='/kaggle/input/covid19-radiography-database/COVID-19 Radiography Database'
train_data = tf.keras.preprocessing.image_dataset_from_directory(
    base_path,
    labels="inferred",
    label_mode="int",
    class_names=None,
    color_mode="rgb",
    batch_size=32,
    image_size=(244, 244),
    shuffle=True,
    seed=123,
    validation_split=0.2,
    subset="training",
    interpolation="bilinear",
    follow_links=False,
)
val_data = tf.keras.preprocessing.image_dataset_from_directory(
    base_path,
    labels="inferred",
    label_mode="int",
    class_names=None,
    color_mode="rgb",
    batch_size=32,
    image_size=(244, 244),
    shuffle=True,
    seed=123,
    validation_split=0.2,
    subset="validation",
    interpolation="bilinear",
    follow_links=False,
)
#该方法适合整理数据,代码比较简单

#分类
class_names =  ["COVID-19","NORMAL","Viral Pneumonia"]
for i in range(len(class_names)):
    print(class_names[i] ," " , i)
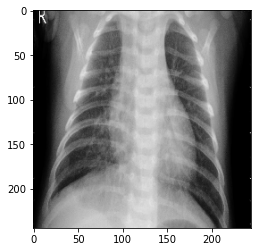
#显示一副病毒性肺炎的图片
image_path=os.path.join(base_path,'Viral Pneumonia/Viral Pneumonia (1024).png')
new_img=image.load_img(image_path,target_size=(244,244))
print('type of new_img',type(new_img))
img = image.img_to_array(new_img)
print('shape of img',img.shape)
img = np.expand_dims(img, axis=0)
print('shape of img',img.shape)
print("Viral Pneumonia")
plt.imshow(new_img)

![]()
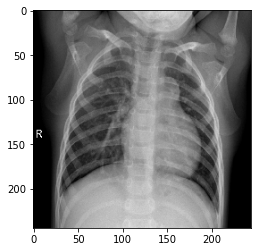
#显示一例正常人的数据
image_path=os.path.join(base_path,'NORMAL/NORMAL (1013).png')
new_img = image.load_img(image_path, target_size=(244, 244))
img = image.img_to_array(new_img)
img = np.expand_dims(img, axis=0)
print("NORMAL")
plt.imshow(new_img)
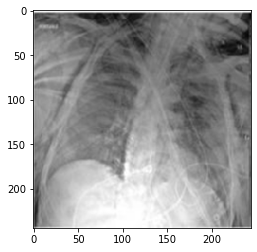
#显示1例新冠
image_path=os.path.join(base_path,'COVID/COVID (123).png')
new_img = image.load_img(image_path, target_size=(244, 244))
img = image.img_to_array(new_img)
img = np.expand_dims(img, axis=0)
print("COVID-19")
plt.imshow(new_img)
covid_num=len(os.listdir(base_path+'/COVID'))
normal_num=len(os.listdir(base_path+'/NORMAL'))
pneumonia_num=len(os.listdir(base_path+'/Viral Pneumonia'))
#查看三个数据集对比
fig, ax = plt.subplots()
ax.bar("COVID-19",covid_num,color="r",label="covid19")
ax.bar("NORMAL",normal_num,color="b",label="normal")
ax.bar("Viral Pneumonia",pneumonia_num,color="g",label="viral pneumonia")
ax.legend()
#CNN模型
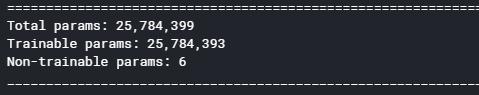
model = tf.keras.models.Sequential([ layers.BatchNormalization(), #244,244,3 layers.Conv2D(32, 3, activation='relu'), #242,242,32 layers.MaxPooling2D(), #121,121,32 layers.Conv2D(64, 3, activation='relu'), #119,119,64 layers.MaxPooling2D(), #59,59,64 layers.Dropout(0.3), #59,59,64 layers.Conv2D(128, 3, activation='relu'), #57,57,128 layers.MaxPooling2D(), #28,28,128 layers.Dropout(0.2), #28,28,128 layers.Flatten(), #100352 layers.Dense(256, activation='relu'), #256 layers.Dropout(0.15), layers.Dense(3, activation= 'softmax') #771 ])
model.summary()
#提前停止设置,5个epoch验证损失函数无提升则终止
early = tf.keras.callbacks.EarlyStopping(monitor='val_loss',patience=5)
model.compile(optimizer='adam',loss='sparse_categorical_crossentropy', metrics=['accuracy'])
history=model.fit(train_data,validation_data=val_data,batch_size=32,epochs = 10,callbacks=[early])

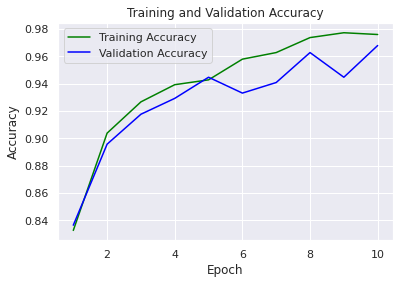
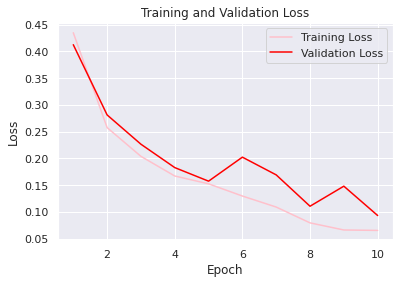
#显示结果
sns.set()

acc = history.history['accuracy']
val_acc = history.history['val_accuracy']
loss = history.history['loss']
val_loss = history.history['val_loss']
epochs = range(1, len(loss) + 1)

#accuracy plot
plt.plot(epochs, acc, color='green', label='Training Accuracy')
plt.plot(epochs, val_acc, color='blue', label='Validation Accuracy')
plt.title('Training and Validation Accuracy')
plt.ylabel('Accuracy')
plt.xlabel('Epoch')
plt.legend()

plt.figure()
#loss plot
plt.plot(epochs, loss, color='pink', label='Training Loss')
plt.plot(epochs, val_loss, color='red', label='Validation Loss')
plt.title('Training and Validation Loss')
plt.xlabel('Epoch')
plt.ylabel('Loss')
plt.legend()

plt.show()
#使用前面的例子看结果
image_path=os.path.join(base_path,'COVID/COVID (123).png')
new_img = image.load_img(image_path, target_size=(244, 244))
img = image.img_to_array(new_img)
img = np.expand_dims(img, axis=0)
prediction = model.predict(img)
prediction = np.argmax(prediction,axis=1)
print(prediction)
print(class_names[prediction[0]])

image_path=os.path.join(base_path,'NORMAL/NORMAL (1013).png')
new_img = image.load_img(image_path, target_size=(244, 244))
img = image.img_to_array(new_img)
img = np.expand_dims(img, axis=0)
prediction = model.predict(img)
prediction = np.argmax(prediction,axis=1)
print(prediction)
print(class_names[prediction[0]])

image_path=os.path.join(base_path,'Viral Pneumonia/Viral Pneumonia (1024).png')
new_img = image.load_img(image_path, target_size=(244, 244))
img = image.img_to_array(new_img)
img = np.expand_dims(img, axis=0)
prediction = model.predict(img)
prediction = np.argmax(prediction,axis=1)
print(prediction)
print(class_names[prediction[0]])

#保存模型
model.save('model.h5')

 浙公网安备 33010602011771号