echarts多圆环饼图
不用UI也可获得的
echarts超炫饼图体验(其实根本没有UI)🌚
先看效果图
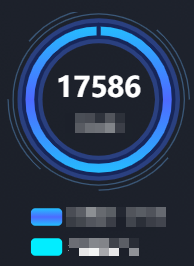
这种样式的饼图要依赖echarts画圆环的功力,多画几个就有这种效果了
上代码
多圆环叠加之术😶
初始化一些参数
let echarts = require('echarts/lib/echarts')
let Chart1 = echarts.init(document.getElementById('pie_chart1'))
      //  饼图开始
      let chartTitle1 = '总数'
      let chartLabel1 = ['有车', '没车']
      let chartValue1 = [10, 15]
      let innerNumber1 = 456
      let chartData1 = []
      for (let i = 0; i < chartLabel1.length; i++) {
        chartData1.push({
          name: chartLabel1[i],
          value: chartValue1[i]
        })
      }
      // 颜色取值列表,饼图渐变色解决方案
      let colorList1 = [new echarts.graphic.LinearGradient(0, 0, 0, 1,
        [
          { offset: 0, color: '#23bffe' },
          { offset: 0.5, color: '#4d6aff' },
          { offset: 1, color: '#23bffe' }
        ]), '#02edff']

      Chart1.setOption(this.setOption(chartTitle1, innerNumber1, chartLabel1, chartValue1, colorList1, chartData1))
设置option的函数
setOption(title, innerNum, chartLabel, chartValue, colorList, chartData){
        title: [{
          // 饼图小标题
          show: true,
          text: title,
          x: '47%',
          y: '40%',
          textAlign: 'center',
          textStyle: {
            fontSize: '12',
            color: '#fff',
            fontWeight: '100'
          }
        }, {
          // 饼图大标题
          text: innerNum,
          x: 'center',
          top: '23%',
          textStyle: {
            fontSize: '22',
            color: '#fff',
            fontWeight: '600'
          }
        }],
        legend: {
          // 图下标签
          orient: 'vertical',
          bottom: 0,
          data: chartLabel,
          textStyle: {
            color: '#fff'
          },
          formatter: function (name) {
            let index = 0
            let clientlabels = chartLabel
            let clientcounts = chartValue
            clientlabels.forEach(function (value, i) {
              if (value === name) {
                index = i
              }
            })
            return name + '  ' + clientcounts[index]
          }
        },
        series: [{
          // 第一环
          type: 'pie',
          zlevel: 1,
          silent: true,
          radius: ['68%', '69%'],
          center: ['50%', '35%'],
          hoverAnimation: false,
          color: 'rgba(88,142,197,0.5)',
          // animation:false,    //charts3 no
          label: {
            normal: {
              show: false
            }
          },
          labelLine: {
            normal: {
              show: false
            }
          },
          data: [1]
        },
        {
          // 第二环
          type: 'pie',
          zlevel: 2,
          silent: true,
          radius: ['72%', '73%'],
          center: ['50%', '35%'],
          startAngle: 50,
          hoverAnimation: false,
          // animation:false,    //charts3 no
          label: {
            normal: {
              show: false
            }
          },
          labelLine: {
            normal: {
              show: false
            }
          },
          data: this._pie2()
        },
        {
          // 实际有用的圆环,第四环,展示后台数据的圆环
          itemStyle: {
            normal: {
              color: function (params) {
                return colorList[params.dataIndex]
              },
              borderColor: '#172659',
              borderWidth: 3
            }
          },
          label: {
            normal: {
              position: 'inner',
              show: false
            }
          },
          type: 'pie',
          // clockWise: false ,
          // roseType: 'radius',
          radius: ['50%', '60%'],
          center: ['50%', '35%'],
          labelLine: {
            normal: {
              lineStyle: {
                color: '#34569D'
              }
            }
          },
          data: chartData
        }, {
          // 第三环
          itemStyle: {
            normal: {
              color: 'rgba(62,109,255,0.4)'
            }
          },
          type: 'pie',
          hoverAnimation: false,
          radius: ['45%', '65%'],
          center: ['50%', '35%'],
          label: {
            normal: {
              show: false
            }
          },
          data: [{
            value: 1
          }],
          z: -1
        }
        ]
      })
绘制等分圆环的函数(本段代码引自echarts gallery)
_pie2 () {
      let dataArr = []
      for (let i = 0; i < 8; i++) {
        if (i % 2 === 0) {
          dataArr.push({
            name: (i + 1).toString(),
            value: 25,
            itemStyle: {
              normal: {
                color: 'rgba(88,142,197,0.5)',
                borderWidth: 0,
                borderColor: 'rgba(0,0,0,0)'
              }
            }
          })
        } else {
          dataArr.push({
            name: (i + 1).toString(),
            value: 20,
            itemStyle: {
              normal: {
                color: 'rgba(0,0,0,0)',
                borderWidth: 0,
                borderColor: 'rgba(0,0,0,0)'
              }
            }
          })
        }
      }
      return dataArr
    }
这个例子告诉我们,万物可叠👦👫👪

 浙公网安备 33010602011771号