方法(一)
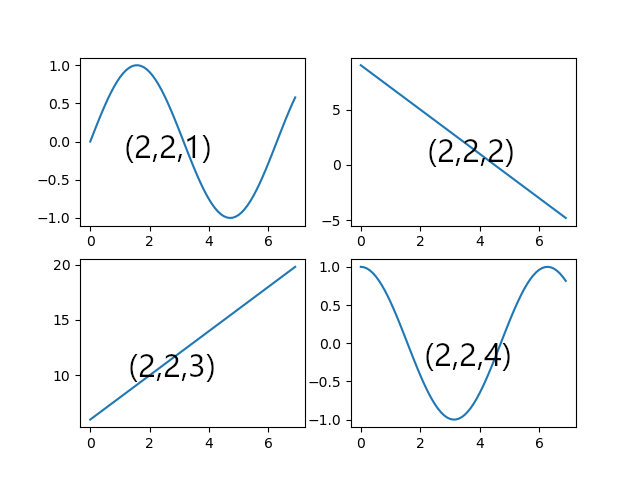
plt.subplot(总行数,总列数,序号)

x=np.arange(0,7,0.1)
y1=np.sin(x)
y2=np.cos(x)
y3=2*x+6
y4=-2*x+9

plt.subplot(2,2,1)
plt.plot(x,y1)

plt.subplot(2,2,4)
plt.plot(x,y2)

plt.subplot(2,2,3)
plt.plot(x,y3)

plt.subplot(2,2,2)
plt.plot(x,y4)

plt.show()
方法(二)
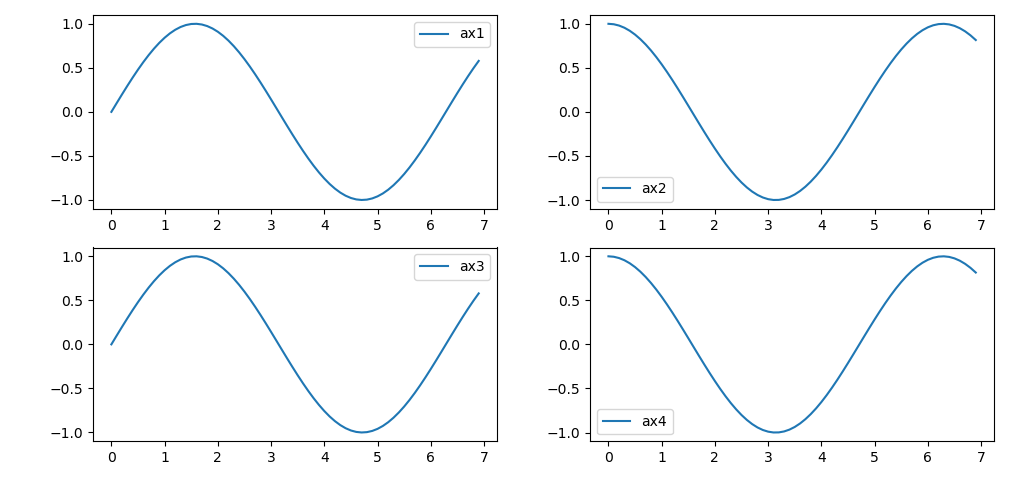
f,((ax1,ax2),(ax3,ax4))=plt.subplots(2,2,sharex=True,sharey=True)
sharex是否共享x轴,默认为False

x=np.arange(0,7,0.1)
y1=np.sin(x)
y2=np.cos(x)
y3=2*x+6
y4=-2*x+9

f,((ax1,ax2),(ax3,ax4))=plt.subplots(2,2)

ax1.plot(x,y1,label='ax1')
ax1.legend()
ax2.plot(x,y2,label='ax2')
ax2.legend()
ax3.plot(x,y1,label='ax3')
ax3.legend()
ax4.plot(x,y2,label='ax4')
ax4.legend()

plt.tight_layout()
plt.show()


