「AntV」基于众源轨迹数据的三维路网生成与L7可视化
1. 引言
L7 地理空间数据可视分析引擎是一种基于 WebGL 技术的地理空间数据可视化引擎,可以用于实现各种地理空间数据可视化应用。L7 引擎支持多种数据源和数据格式,包括 GeoJSON、CSV等,可以快速加载和渲染大规模地理空间数据。L7 引擎还提供了丰富的可视化效果和交互功能,包括热力图、等高线图、鼠标交互等,可以帮助用户更好地理解和分析地理空间数据。
L7 官网:蚂蚁地理空间数据可视化 | AntV (antgroup.com)
L7 GitHub 仓库:antvis/L7: 🌎 Large-scale WebGL-powered Geospatial Data Visualization analysis engine (github.com)
L7 官方教程:简介 | L7 (antgroup.com)
L7 官方示例:所有图表 | L7 (antgroup.com)
L7 API文档:场景 Scene | L7 (antgroup.com)
本文描述使用L7对长沙岳麓山景点游客轨迹数据进行可视化并构建三维路网
2. 数据获取
路网数据可以从以下网站下载,数据来源自六只脚:六只脚_GPS轨迹记录_户外自助游_自助游线路 (foooooot.com)
具体的轨迹获取教程可以参考:GPS地图生成03之数据获取 - 当时明月在曾照彩云归 - 博客园 (cnblogs.com)
下载好以后可以在QGIS中利用加载XY文件的方式加载all.csv文件,并设置OSM底图,预览GPS轨迹:
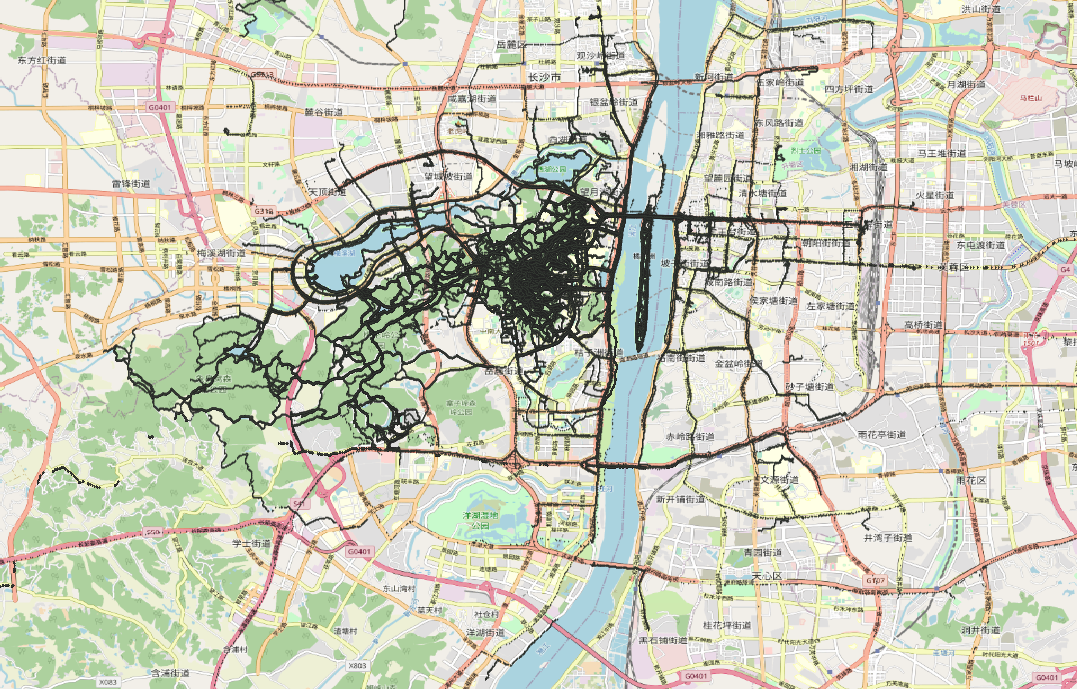
- 注:数据量较大,绘制卡顿
数据文件尺寸为47.2 M,有892152条轨迹数据,至此数据获取完成
数据文件内容示例为:
id,lng,lat,ele,track,time
0,112.938652777778,28.1828777777778,52.5862003780718,1448263,1511330079
1,112.936425,28.1837833333333,63.8200589970501,1448263,1511330738
2,112.936280555556,28.1837833333333,64.1105651105651,1448263,1511330800
3,112.93595,28.18385,65.3336643495531,1448263,1511331332
4,112.935691666667,28.1839333333333,66.9243986254296,1448263,1511331794
5,112.932275,28.1840388888889,80.1450980392157,1448263,1511335690
6,112.929519444444,28.1849583333333,179.382636655949,1448263,1511336583
7,112.929244444444,28.1849777777778,185.630363036304,1448263,1511336714
8,112.928458333333,28.1860111111111,228.579710144928,1448263,1511337087
9,112.931161111111,28.1911555555556,285.57196969697,1448263,1511339434
10,112.931288888889,28.1910944444444,288.503448275862,1448263,1511339460
......
3. L7可视化
可参考官方亮度图样例:亮度图 | L7 (antgroup.com)
3.1 加载底图
加载Mapbox地图
<!DOCTYPE html>
<html lang="en">

<head>
  <meta charset="UTF-8">
  <meta http-equiv="X-UA-Compatible" content="IE=edge">
  <meta name="viewport" content="width=device-width, initial-scale=1.0">
  <title>Document</title>
  <script src='https://api.mapbox.com/mapbox-gl-js/v2.15.0/mapbox-gl.js'></script>
  <link href='https://api.mapbox.com/mapbox-gl-js/v2.15.0/mapbox-gl.css' rel='stylesheet' />
  <script src='https://unpkg.com/@antv/l7'></script>
</head>

<body>
  <div id="map"></div>
  <script>
    const scene = new L7.Scene({
      id: 'map',
      map: new L7.Mapbox({
        style: 'dark',
        center: [112.9448, 28.1708],
        zoom: 12,
        token: 'pk.eyJ1IjoieWFuZ2ppYW4iLCJhIjoiY2phaG1neno0MXFkNDMzbWhwNWw0bWM4aiJ9.CFmrh0LVWAbmVeed-Xr7wA'
      }),
    });

  </script>
</body>

</html>
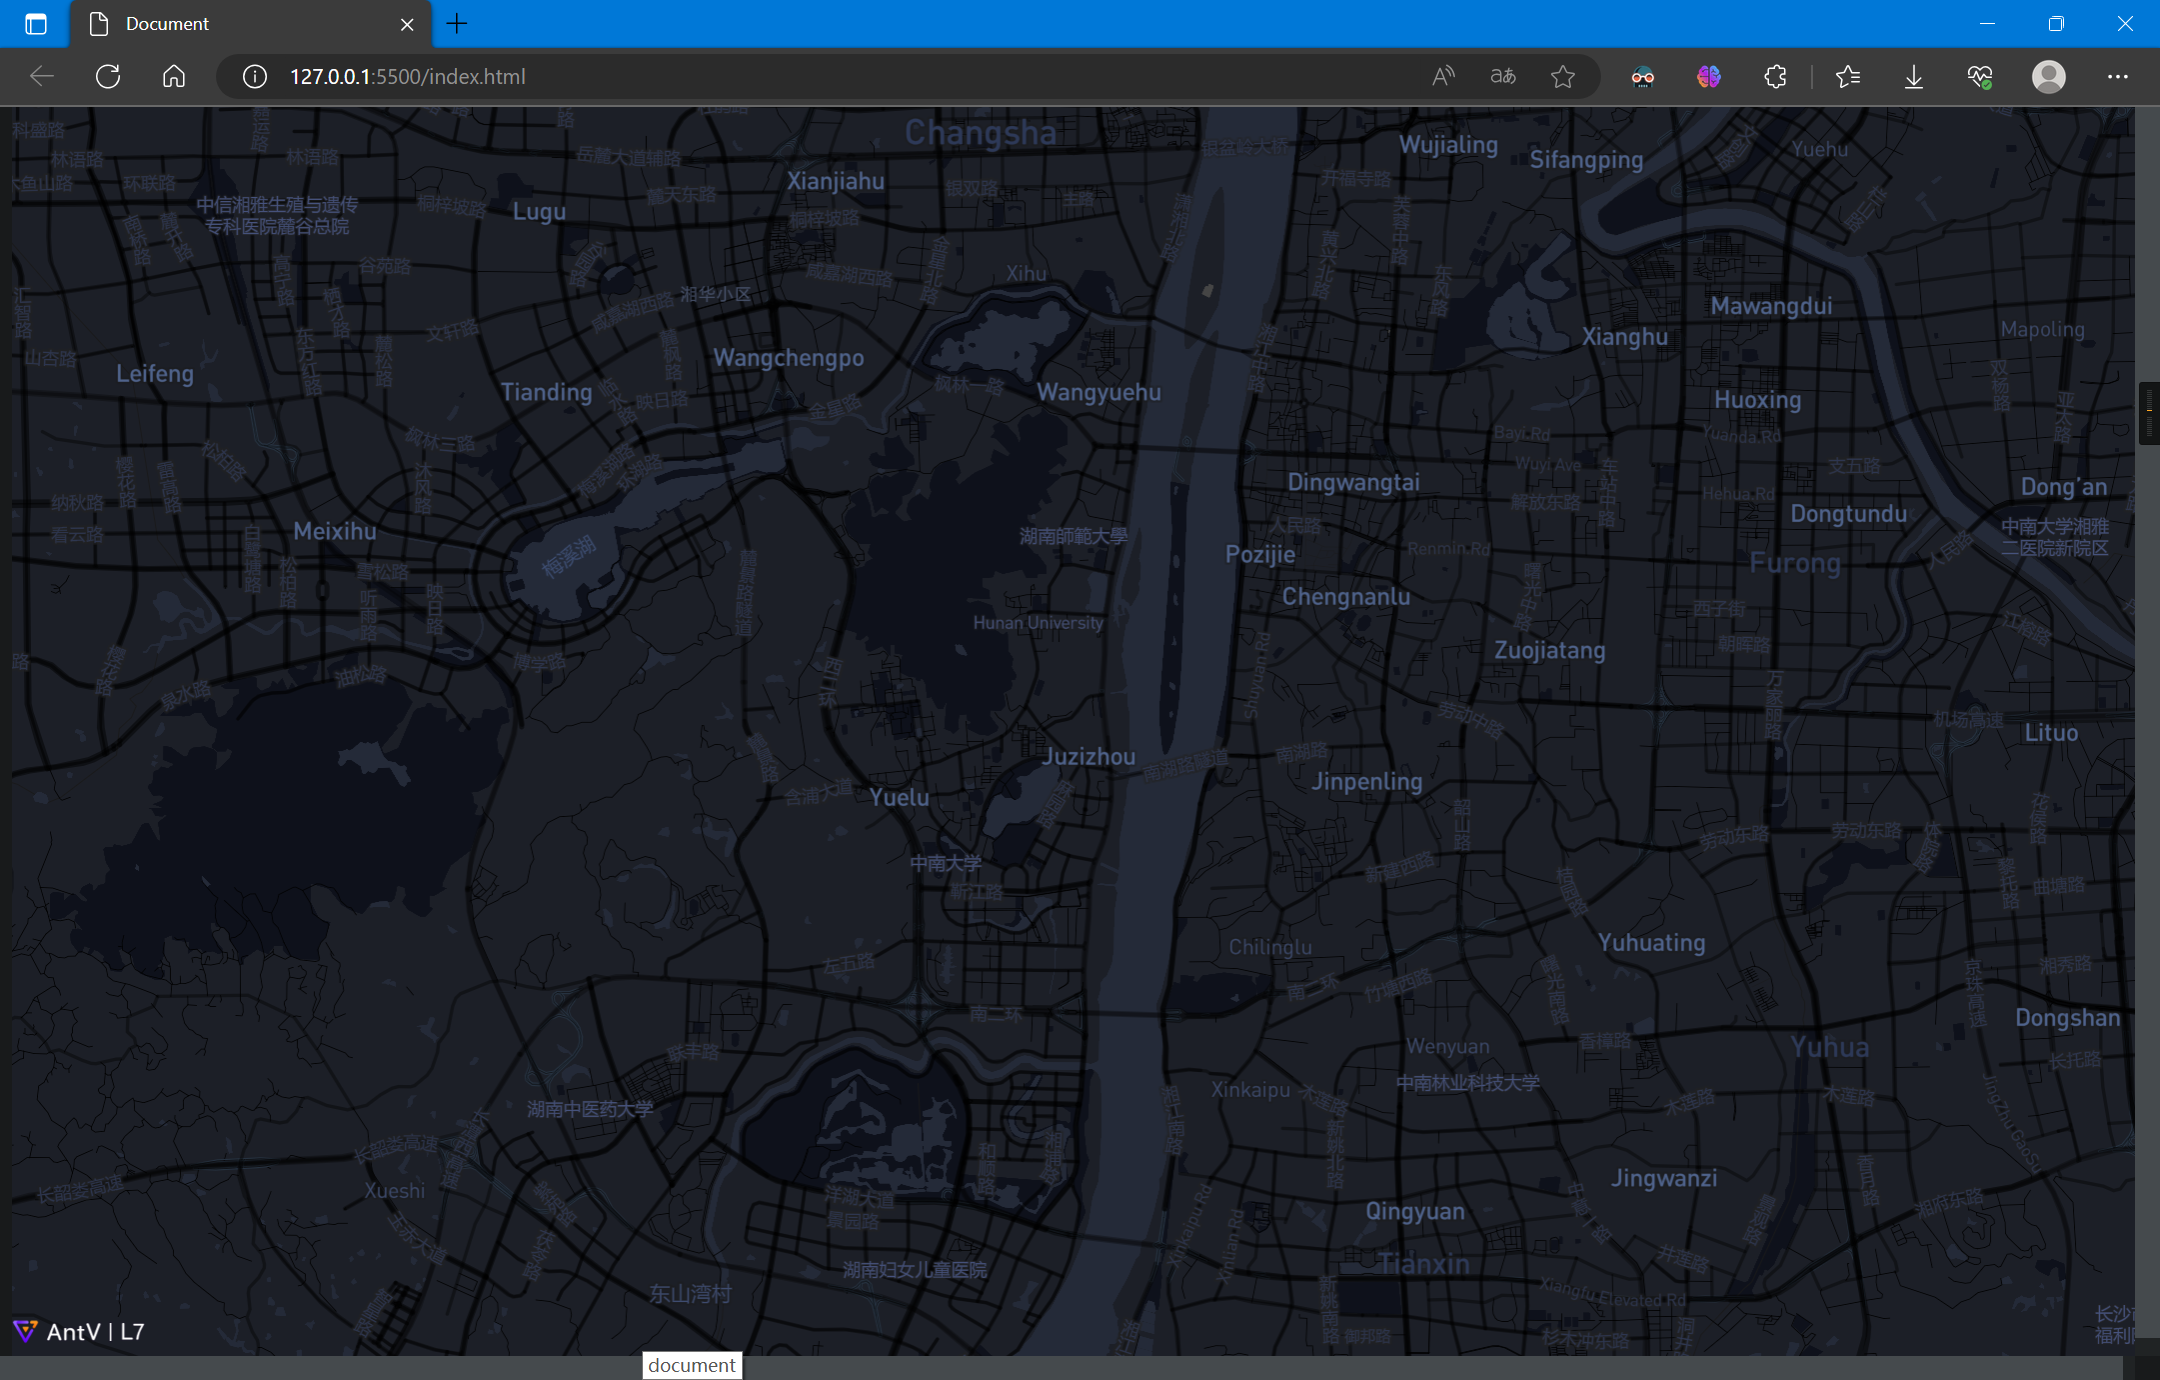
3.2 加载数据并解析
加载数据,L7内置CSV格式解析器,只需指定字段名即可:
scene.on('loaded', () => {
    fetch('./all.csv')
        .then(res => res.text())
        .then(data => {
        const pointLayer = new L7.PointLayer({})
        .source(data, {
            parser: {
                type: 'csv',
                y: 'lat',
                x: 'lng'
            }
        })

        scene.addLayer(pointLayer);
    });
});
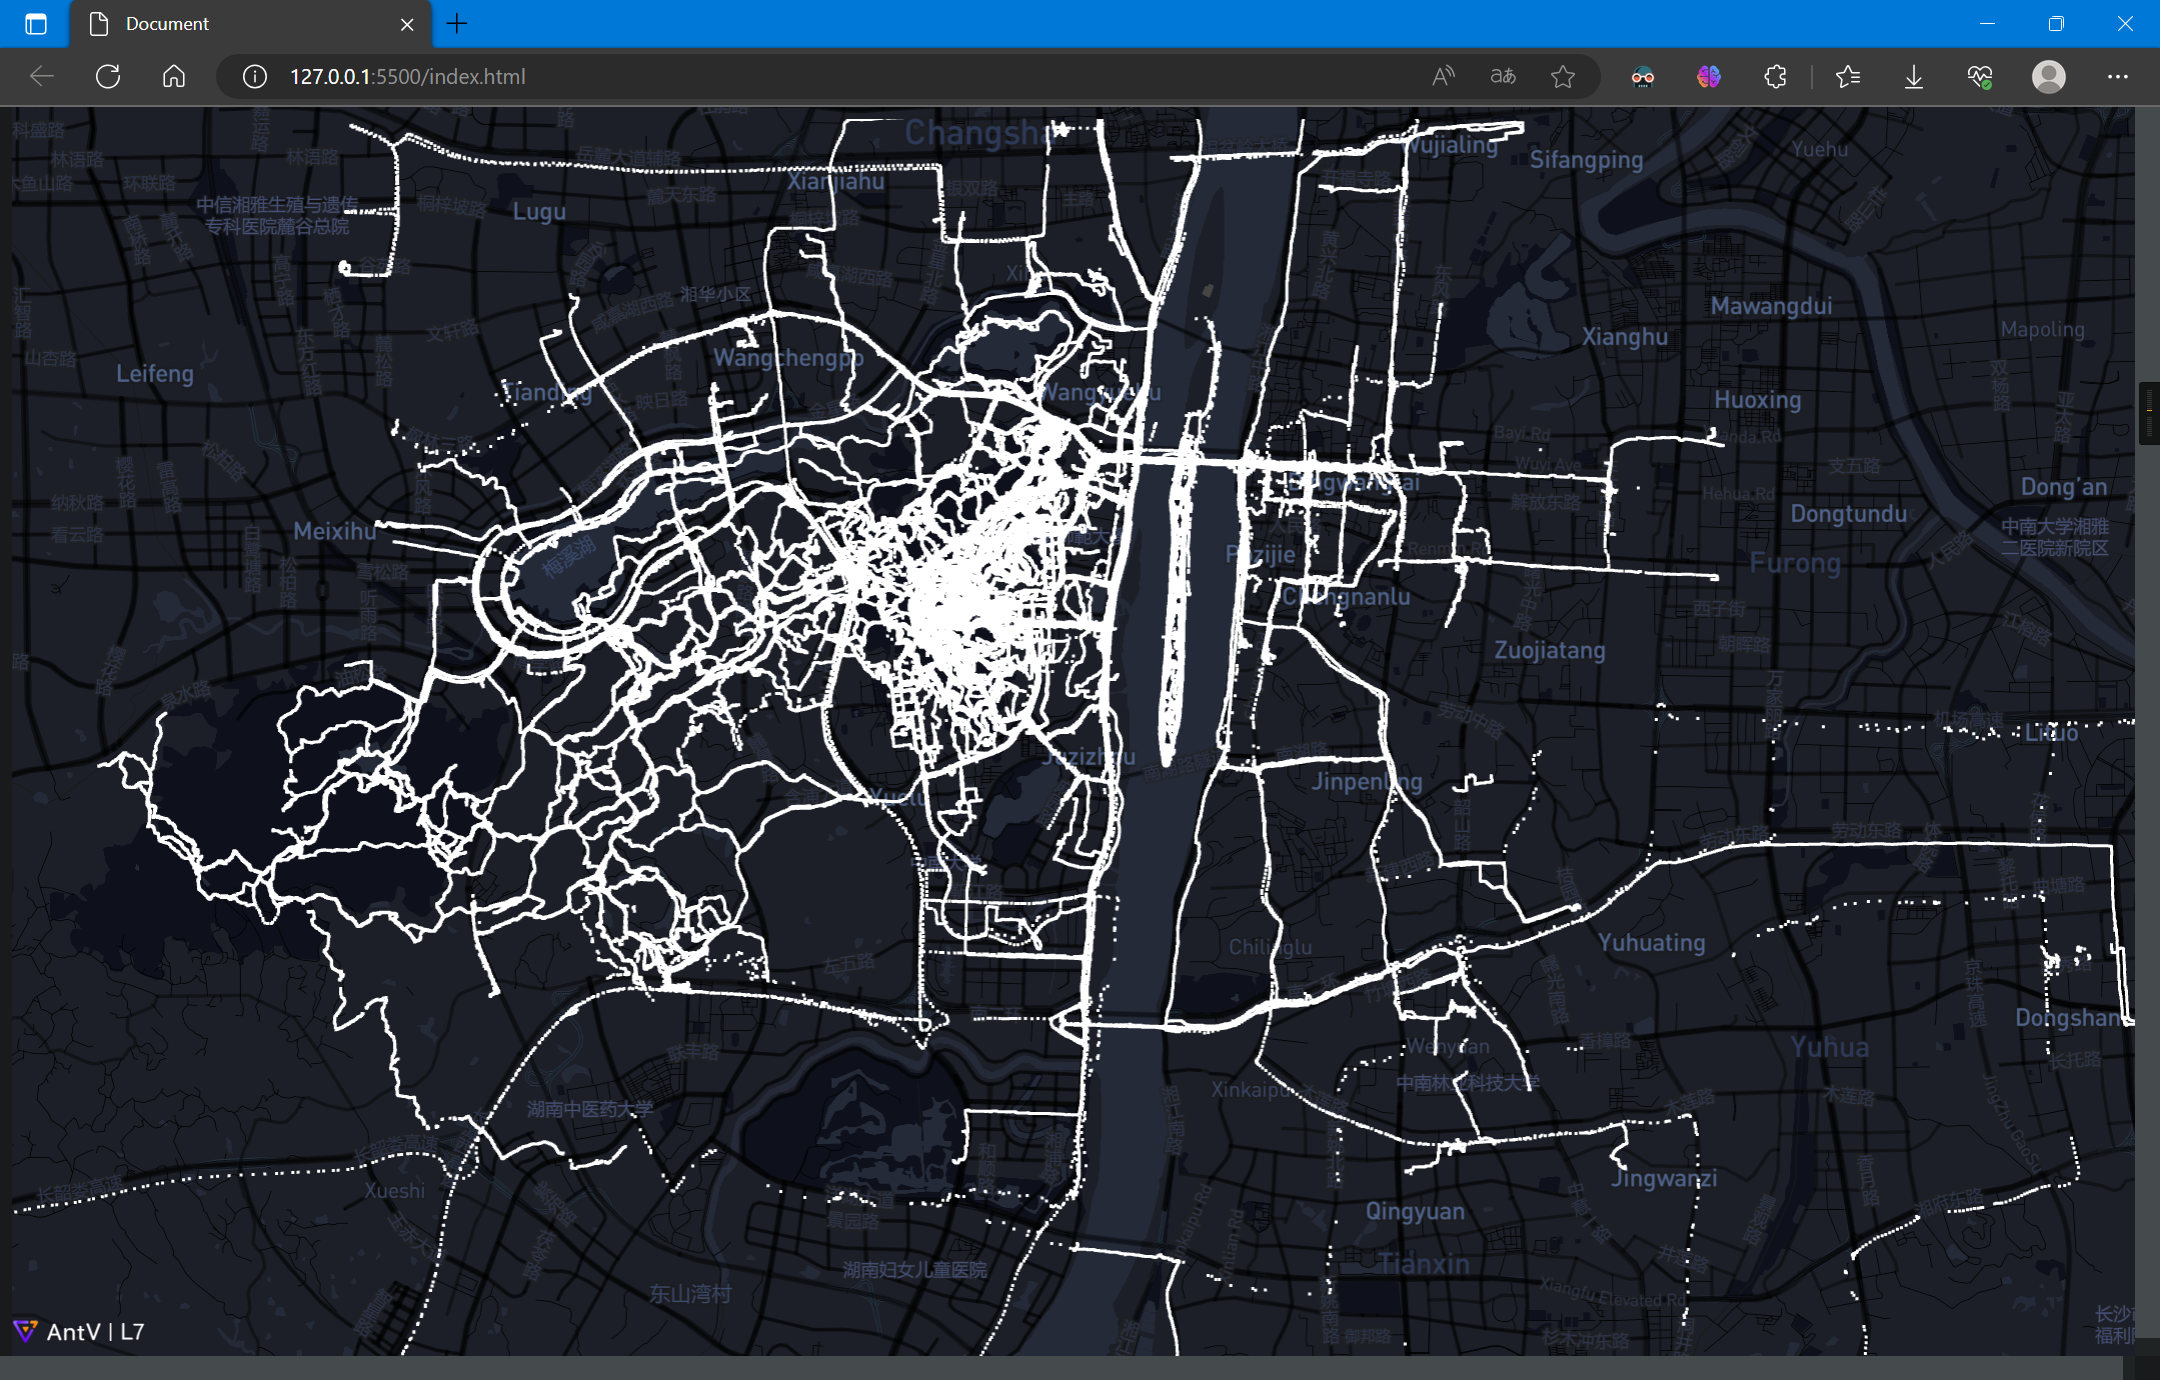
3.3 绘制样式
绘制点图层,并设置样式:
scene.on('loaded', () => {
    fetch('./all.csv')
        .then(res => res.text())
        .then(data => {
        const pointLayer = new L7.PointLayer({})
        .source(data, {
            parser: {
                type: 'csv',
                y: 'lat',
                x: 'lng'
            }
        })
        .size(0.5)
        .color('#080298');

        scene.addLayer(pointLayer);
    });
});
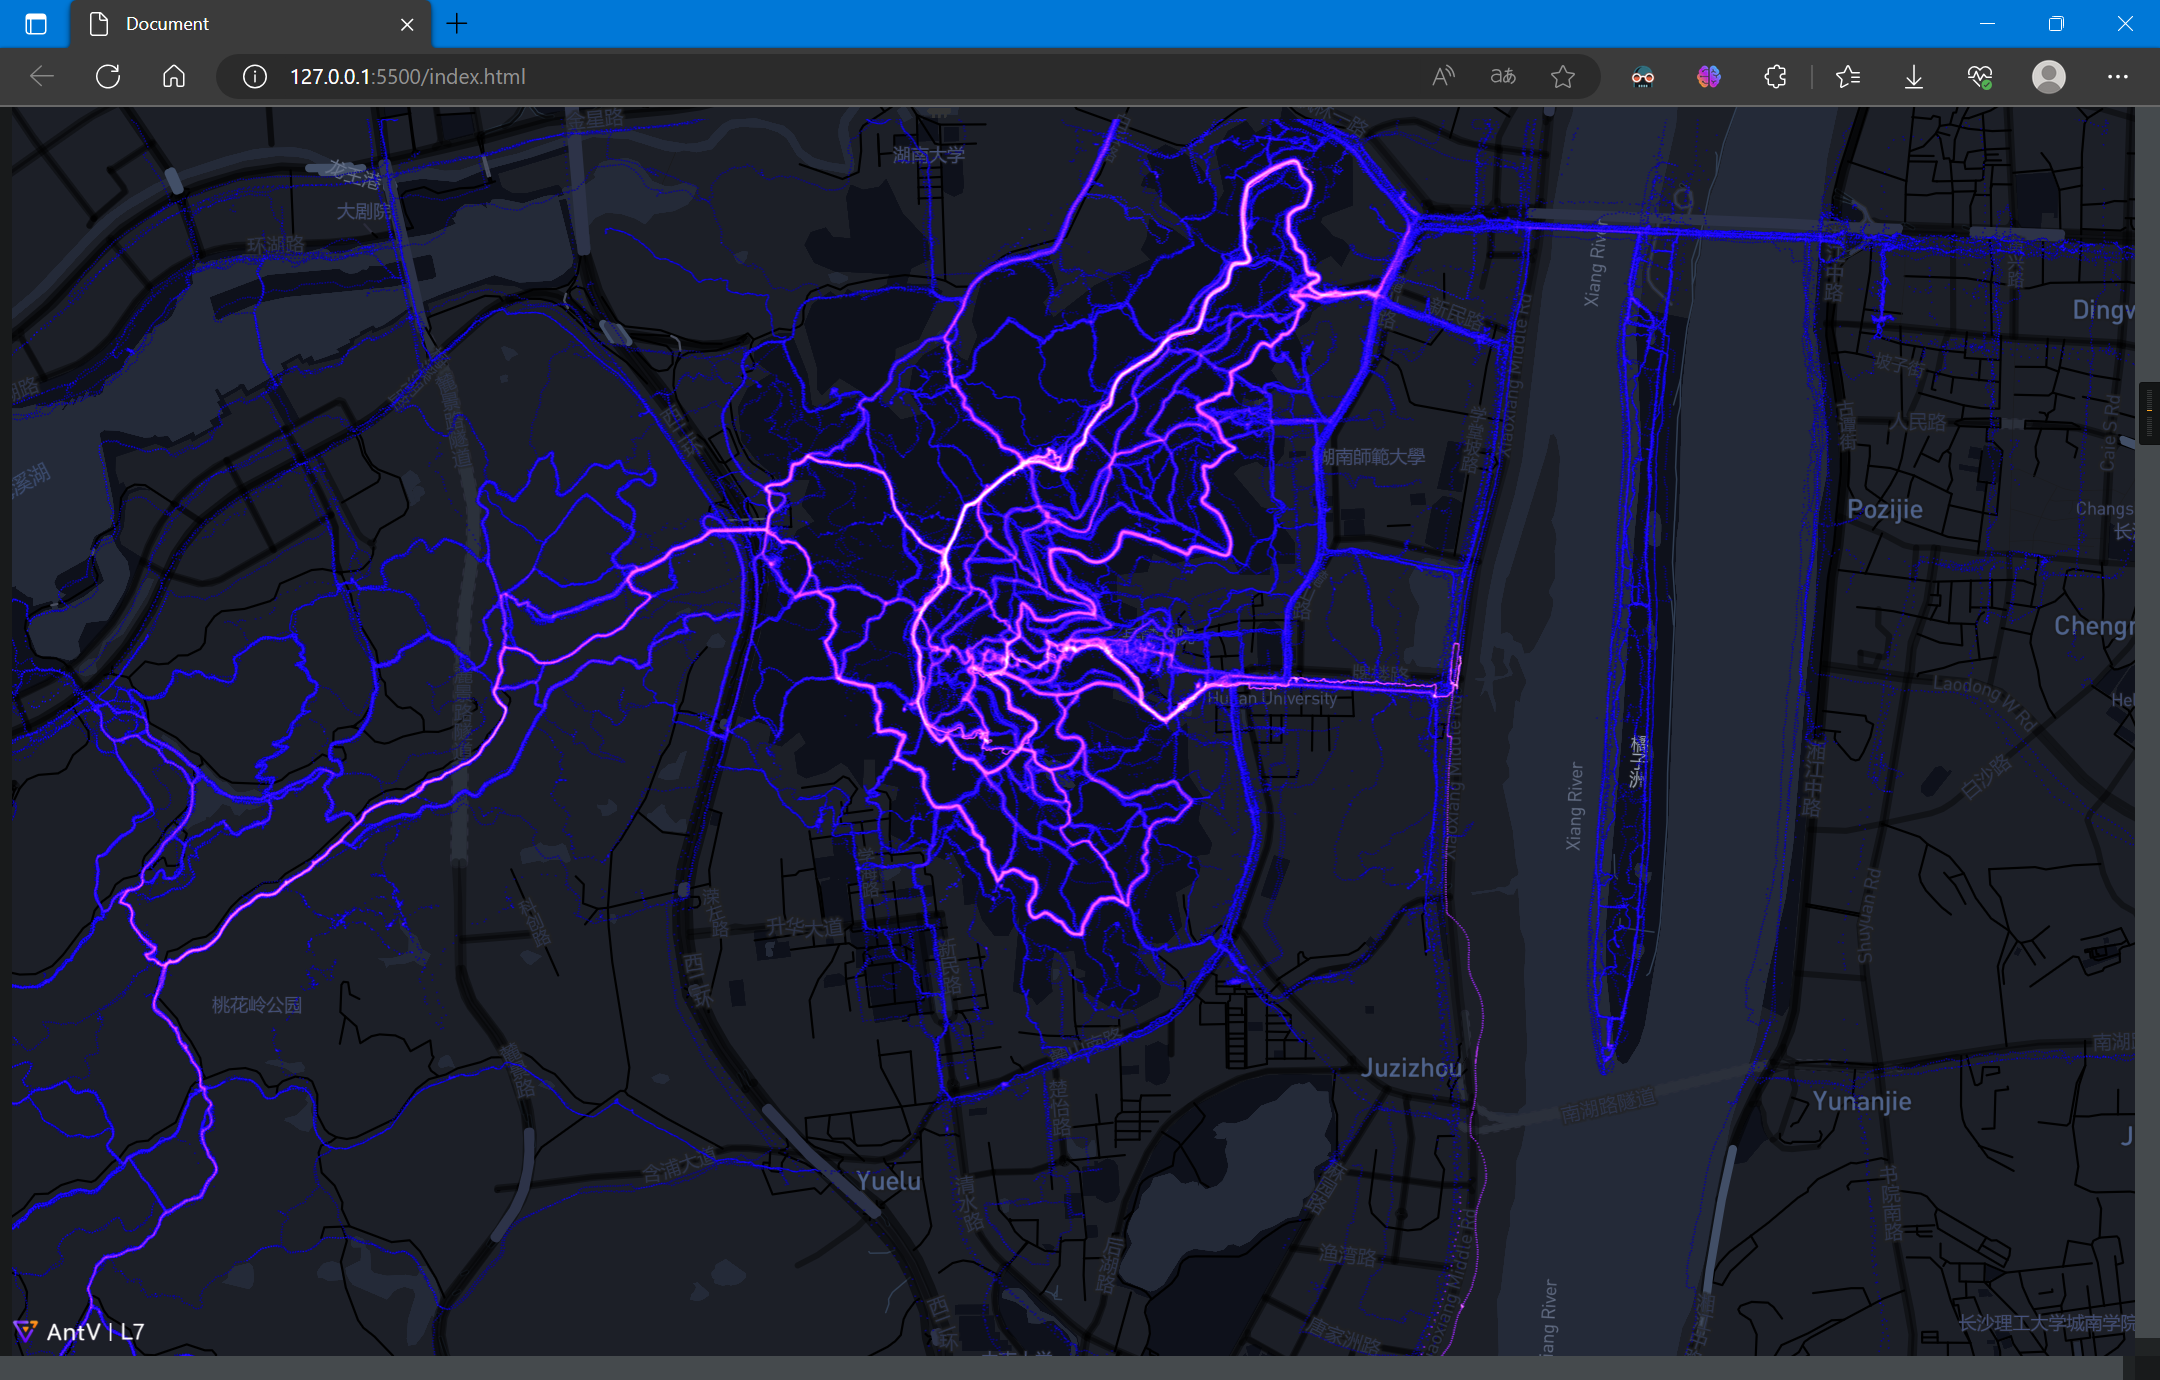
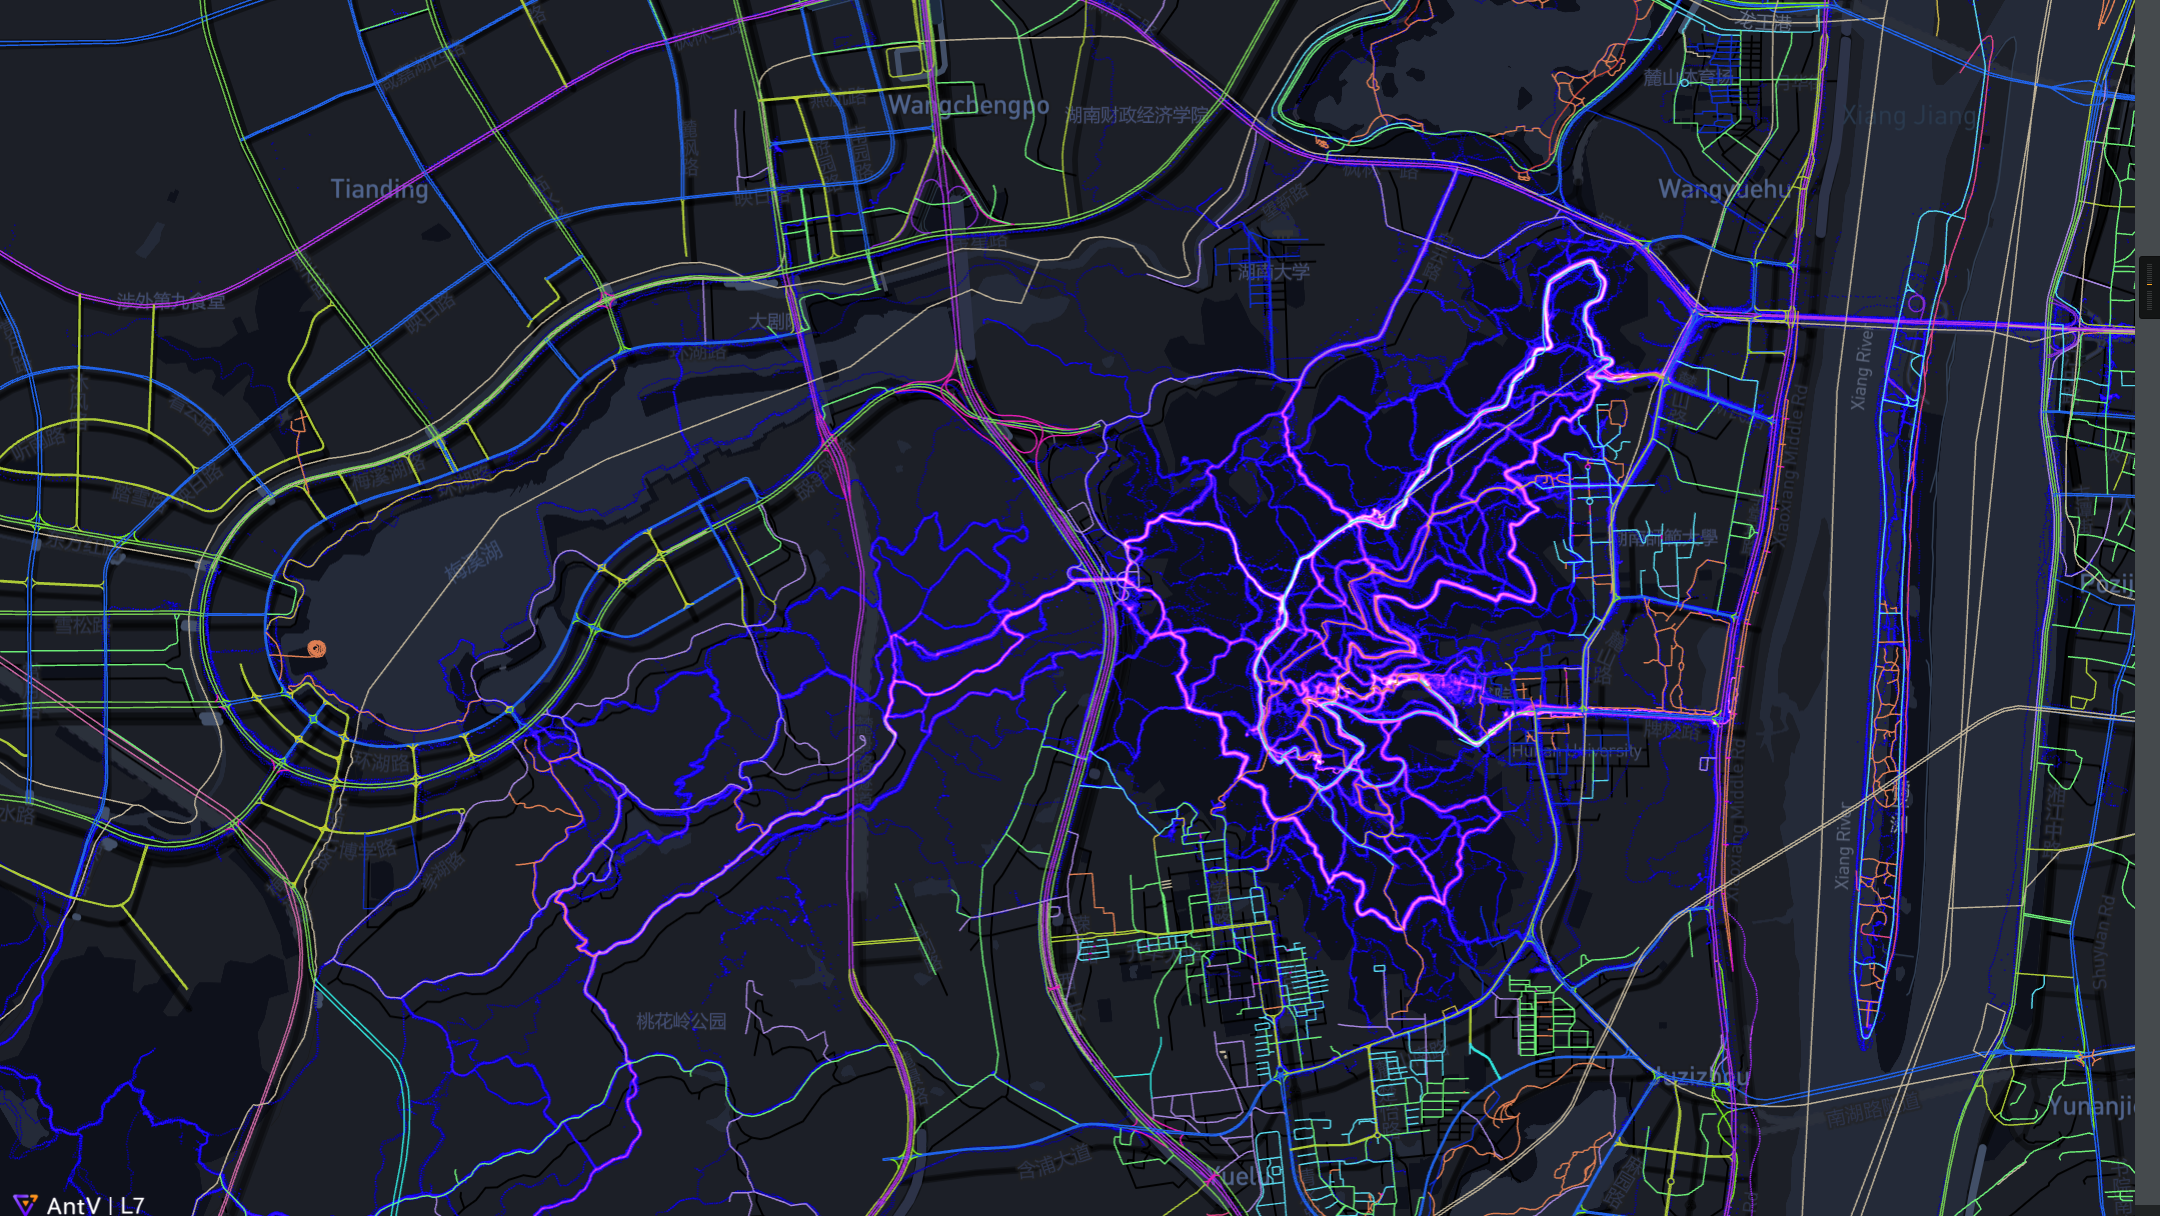
从图中可以看出主要的路线,即高亮部分
3.4 路网叠加
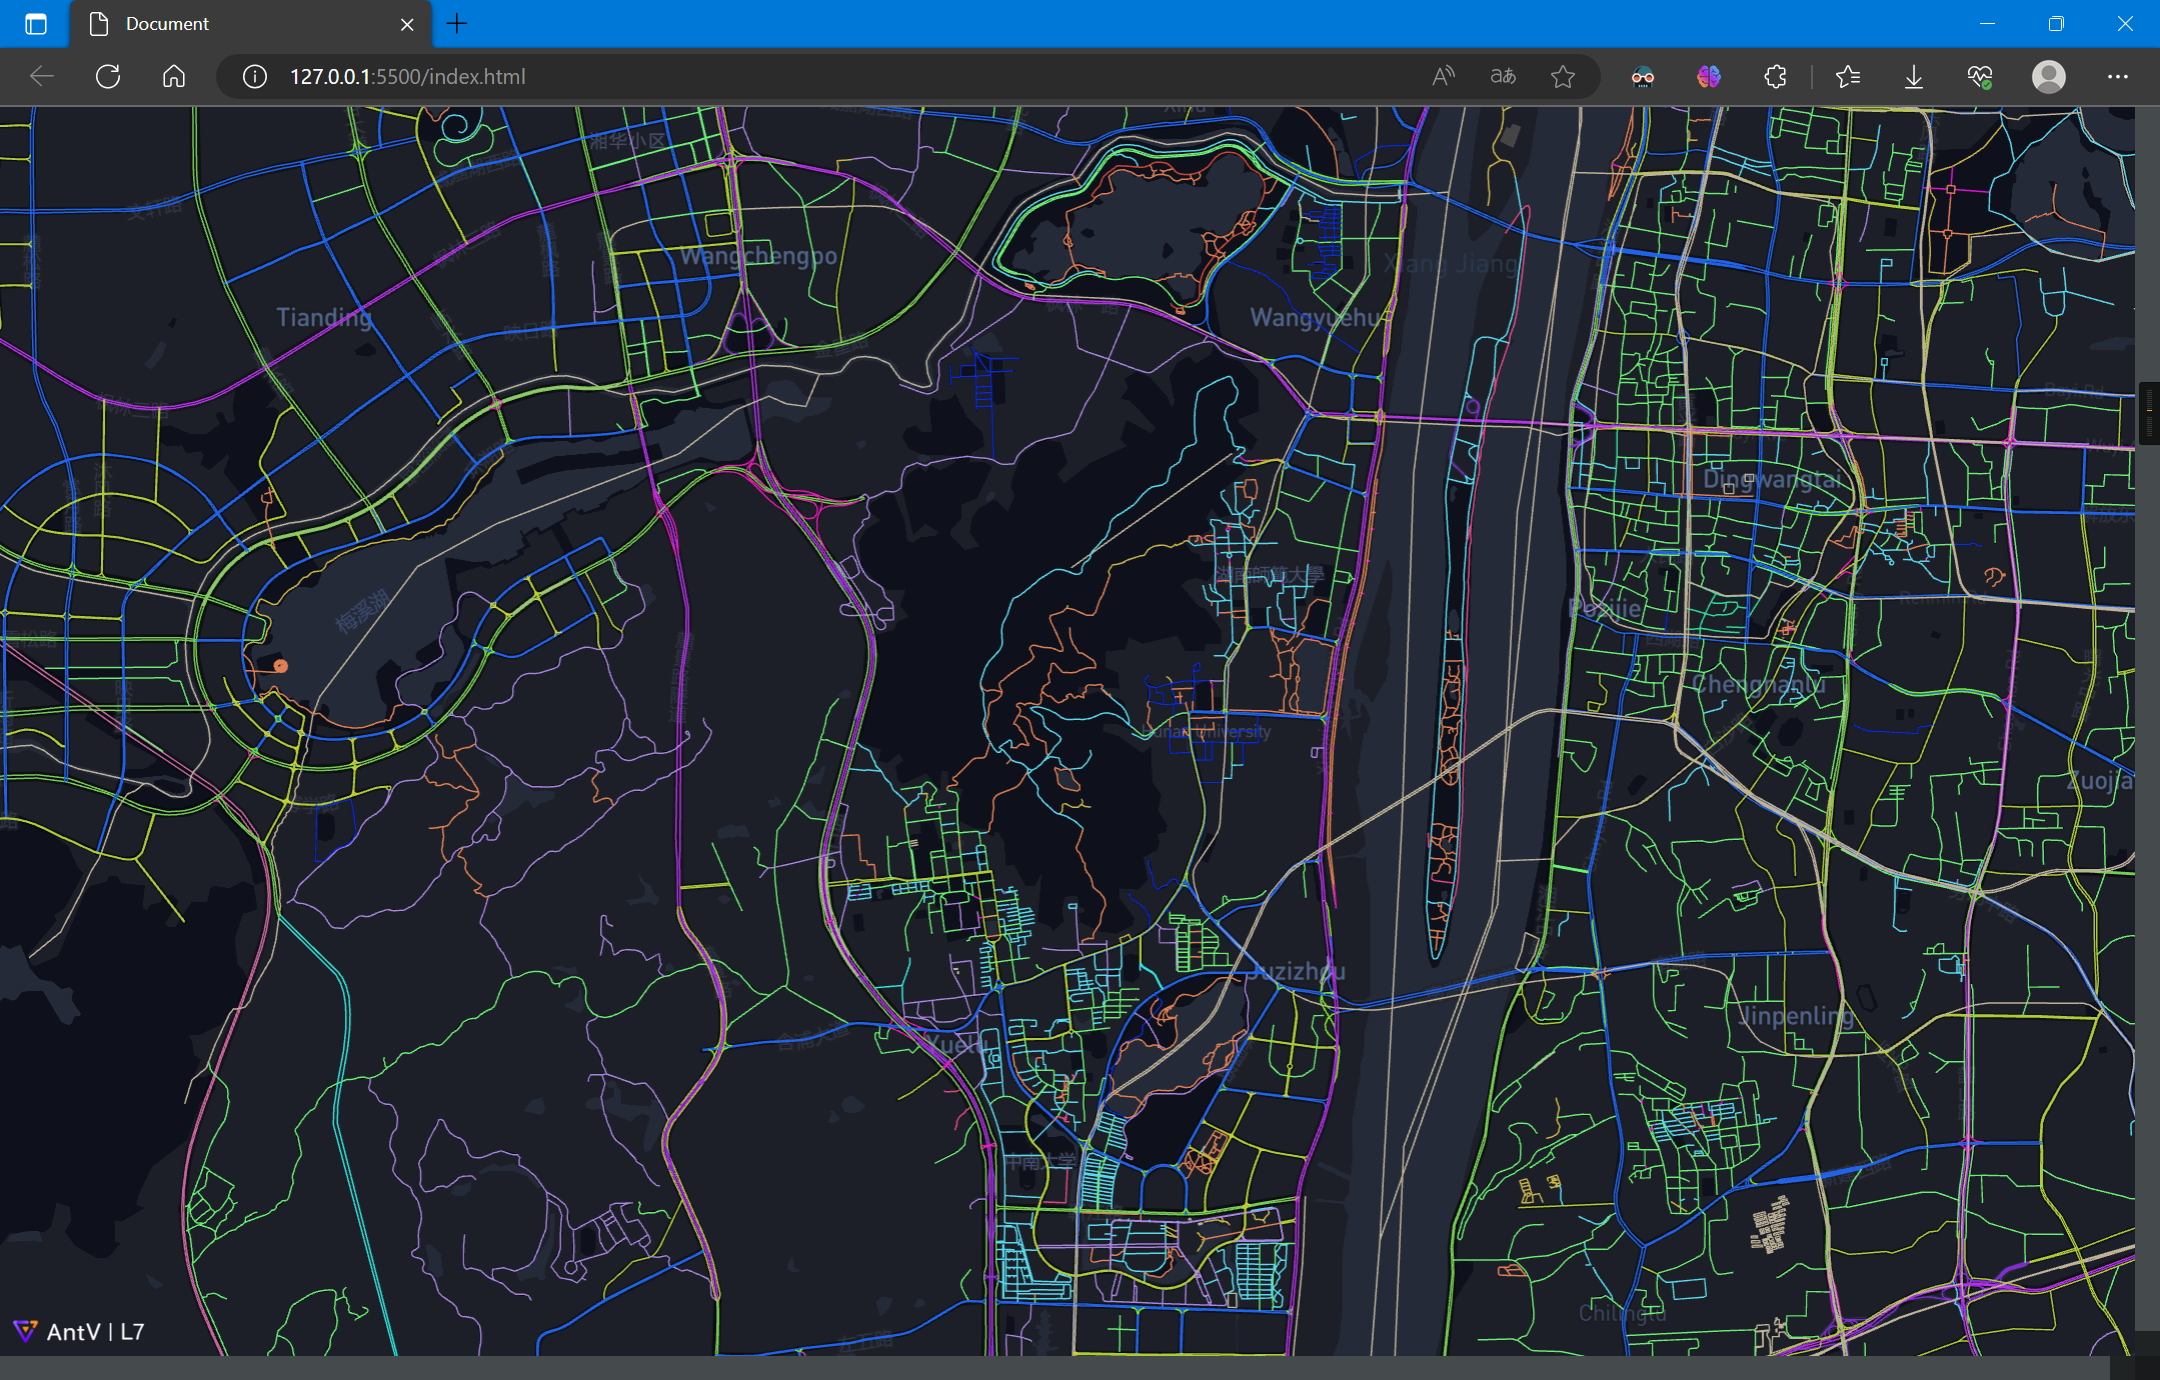
以下对景点及附近的路网数据可视化
路网数据获取与可视化步骤可参考:「AntV」路网数据获取与L7可视化 - 当时明月在曾照彩云归 - 博客园 (cnblogs.com)
叠加图层:
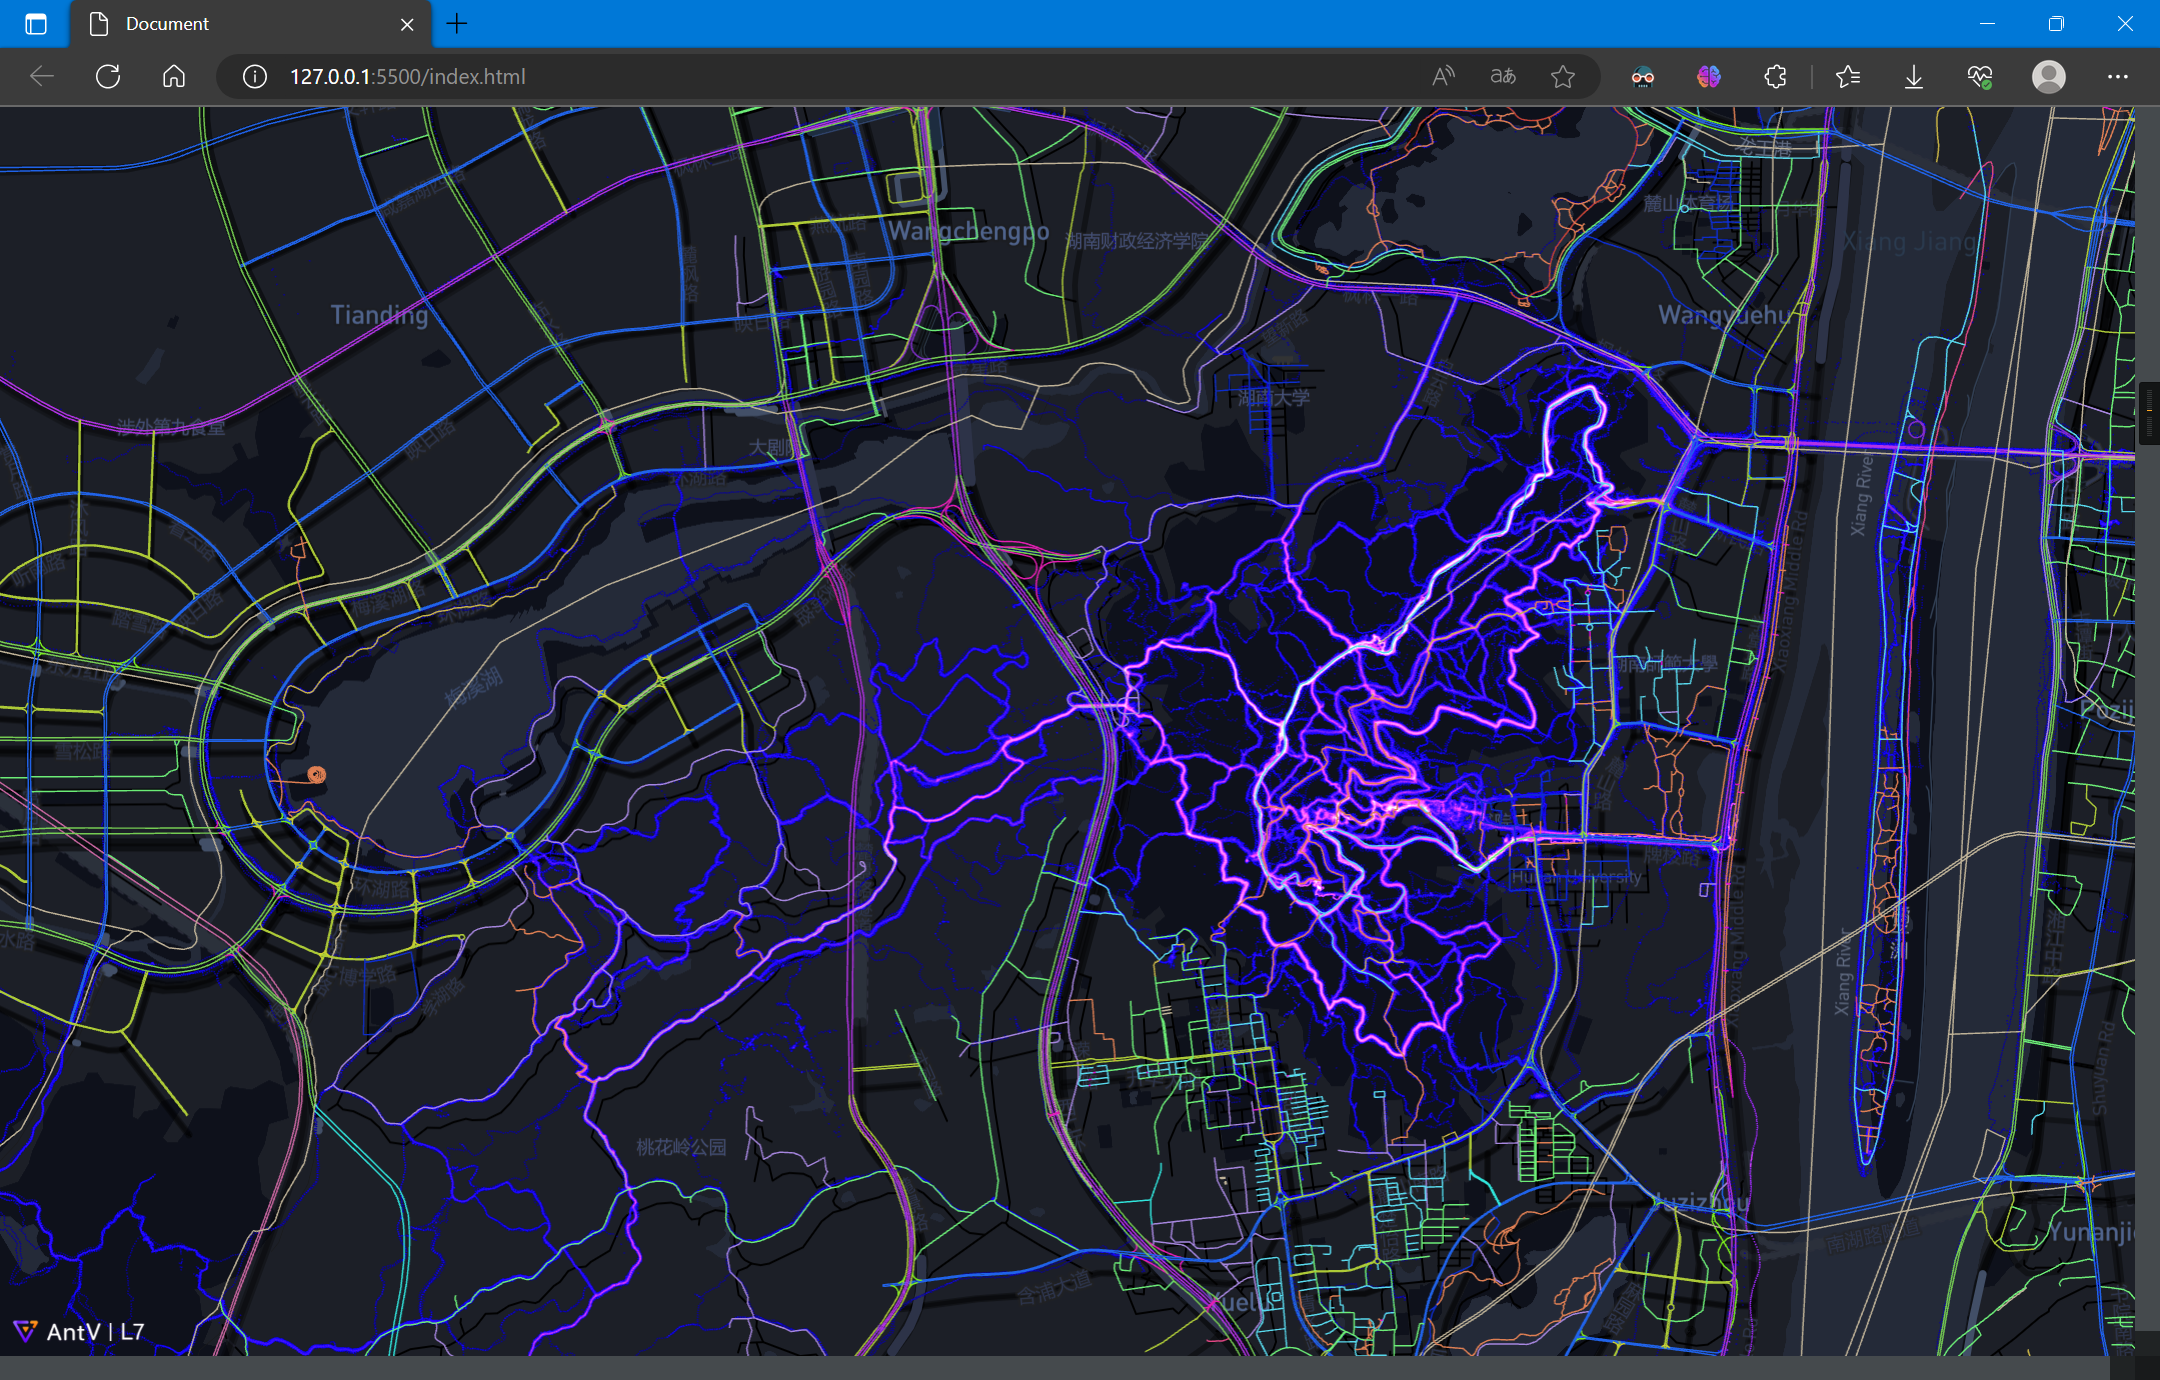
可以看到,在景区的轨迹信息比路网信息更为完善和直观
3.5 路网提取
从上图不难看出,虽然有的地方在路网上不显示,这些道路可能只是景区小道,但它确实也是一种特殊的道路,尤其是对于行人、旅行者而言
当足够数量的轨迹点显示在一起时,这些亮度图似乎就是路网图,更进一步的,可以从这些轨迹数据中提取去路网
这里不做具体研究阐述,可以参考下列文章:
- (PDF) 基于众源轨迹数据的行人路网提取 (researchgate.net)
- (PDF) Pedestrian network generation based on crowdsourced tracking data (researchgate.net)
- Map Inference in the Face of Noise and Disparity
- ......
这里使用的是《Map Inference in the Face of Noise and Disparity》中所提出的算法进行提取路网,并提取GPS轨迹数据中的三维信息,构建为三维路网
《Map Inference in the Face of Noise and Disparity》中所提出的算法可以在以下地址下载:
- haidaoxiaofei/mapinference-gis12-upgrade (github.com)
- qcri/gpsmap: Real time map creation and update using gps data (github.com)
另外,还有多种路网提取算法,可以在下列网站中查看并使用:
3.6 二维路网可视化
经过一系列的数据预处理、路网提取、数据后处理,从上述的轨迹数据得到了以下路网数据:
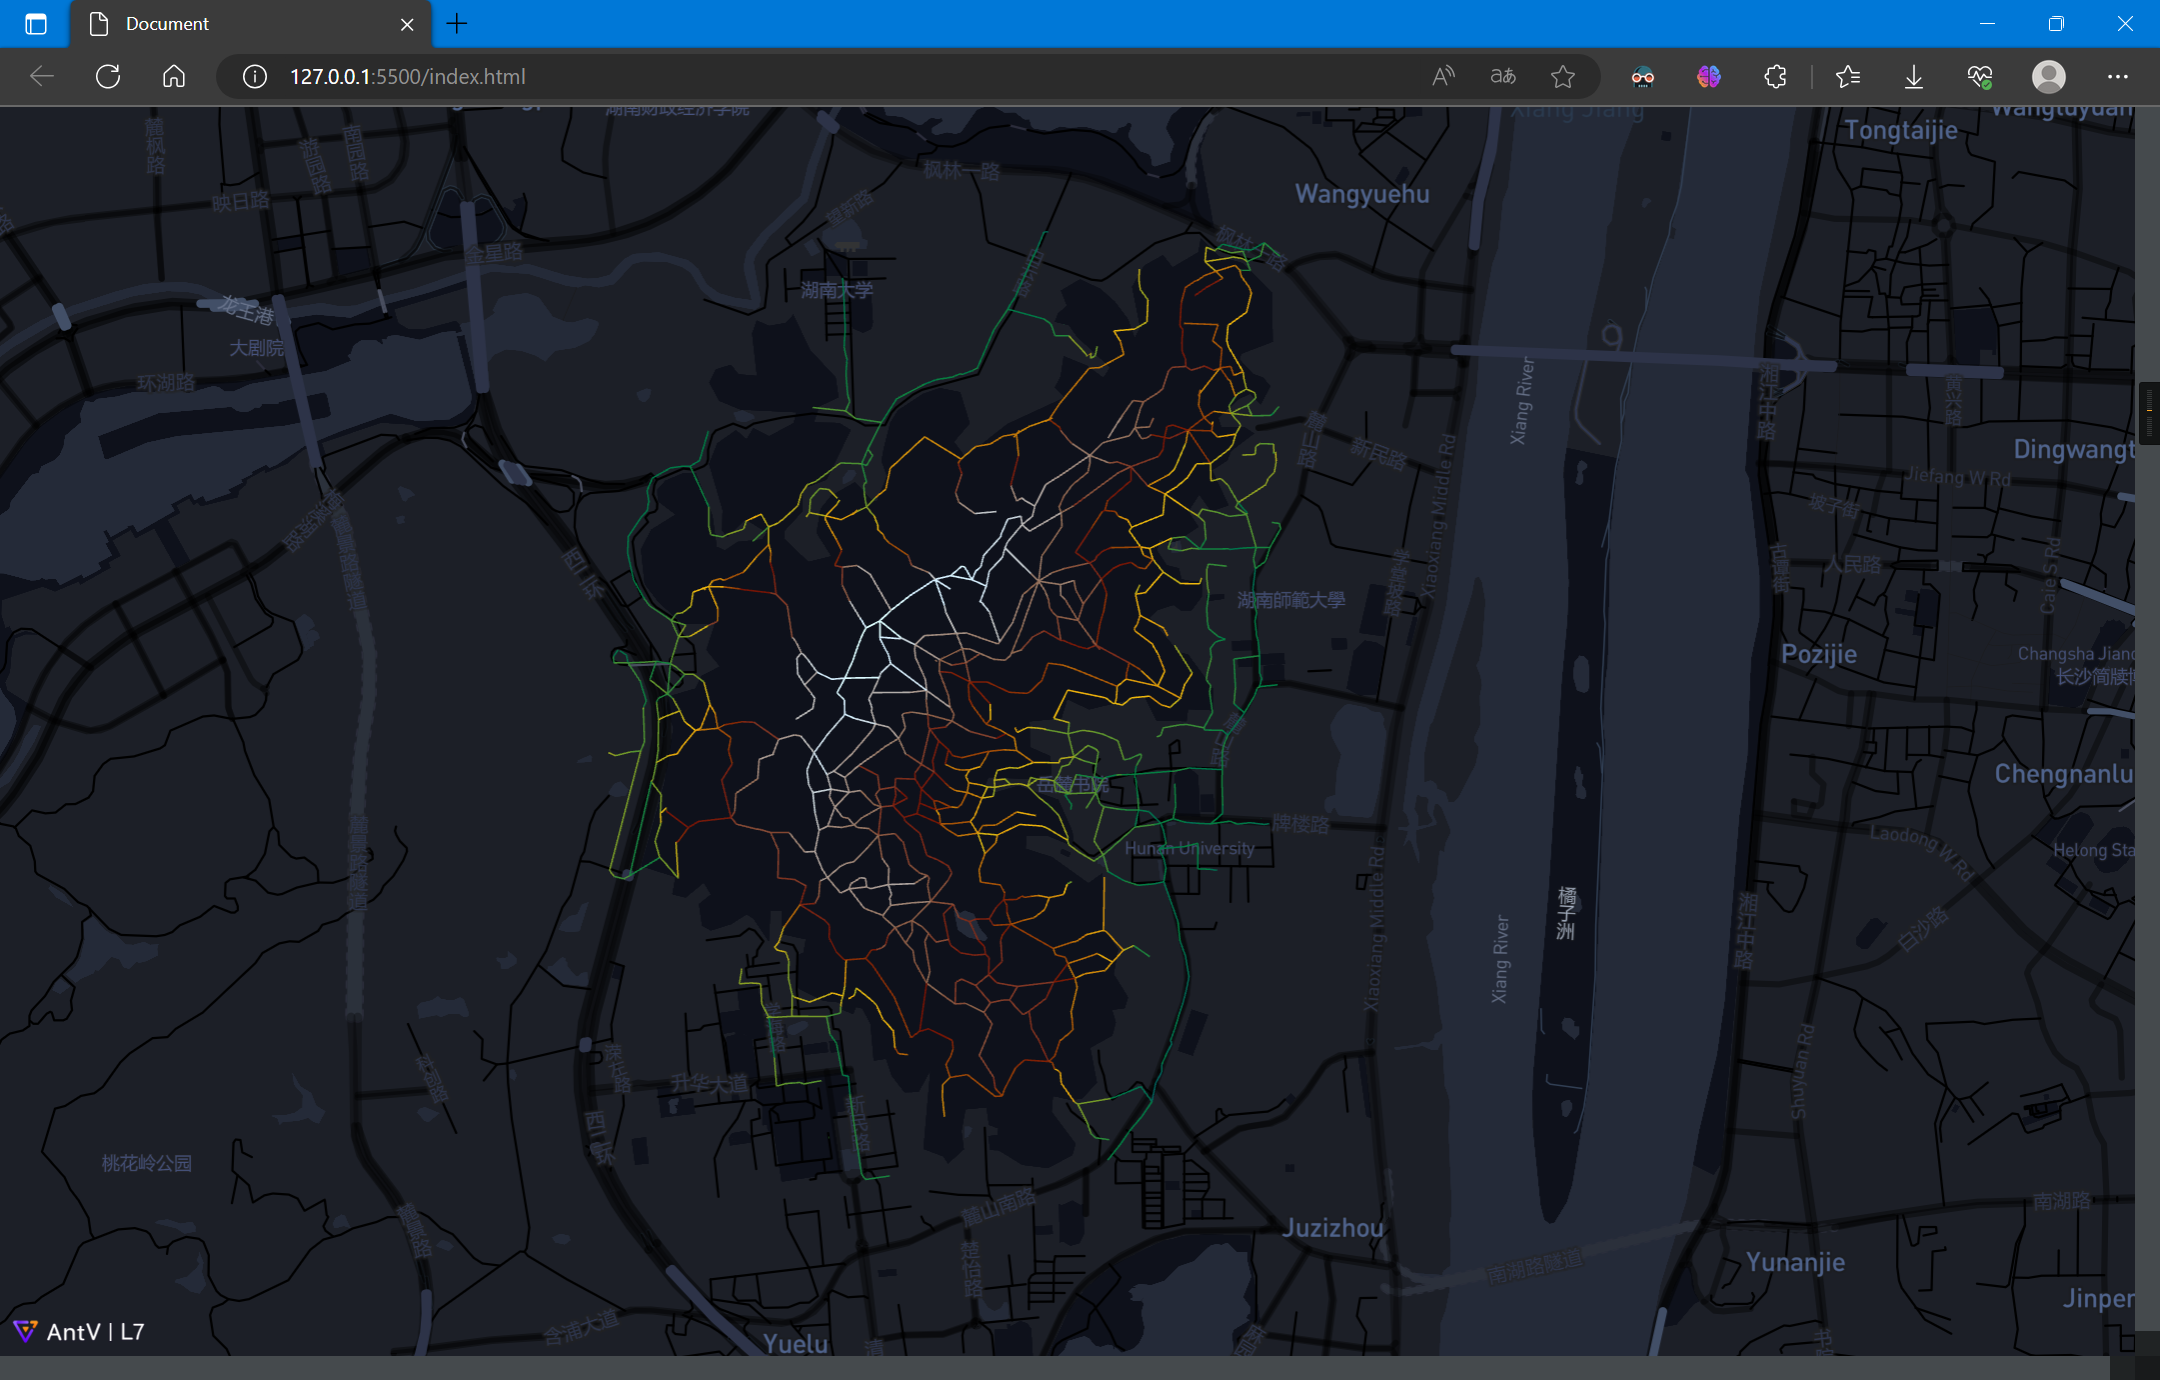
其中,海拔渐变色带由低到高为:
由图中可以看出岳麓山景点路网数据的相对高度
绘制的代码如下:
<!DOCTYPE html>
<html lang="en">

<head>
  <meta charset="UTF-8">
  <meta http-equiv="X-UA-Compatible" content="IE=edge">
  <meta name="viewport" content="width=device-width, initial-scale=1.0">
  <title>Document</title>
  <script src='https://api.mapbox.com/mapbox-gl-js/v2.15.0/mapbox-gl.js'></script>
  <link href='https://api.mapbox.com/mapbox-gl-js/v2.15.0/mapbox-gl.css' rel='stylesheet' />
  <script src='https://unpkg.com/@antv/l7'></script>
  <style>
    body,
    #map {
      height: 100vh;
      width: 100vw;
      margin: 0;
    }
  </style>
</head>

<body>
  <div id="map"></div>
  <script>
    const scene = new L7.Scene({
      id: 'map',
      map: new L7.Mapbox({
        style: 'dark',
        center: [112.9448, 28.1708],
        zoom: 12,
        token: 'pk.eyJ1IjoieWFuZ2ppYW4iLCJhIjoiY2phaG1neno0MXFkNDMzbWhwNWw0bWM4aiJ9.CFmrh0LVWAbmVeed-Xr7wA'
      })
    });

    scene.on('loaded', () => {
      fetch('./Yuelushan.geojson')
        .then(res => res.json())
        .then(data => {
          const layer = new L7.LineLayer({
            zIndex: 2,
          })
            .source(data)
            .size(0.5)
            .active(true)
            .color('z1', ['#0b8040', '#f2b90c', '#751304', '#8c644c', '#b8b8b8']);
          scene.addLayer(layer);
        });
    });

  </script>
</body>
3.7 三维路网可视化
路网数据的格式如下:
{
  "type": "FeatureCollection",
  "name": "Yuelushan",
  "crs": {
    "type": "name",
    "properties": {
      "name": "urn:ogc:def:crs:OGC:1.3:CRS84"
    }
  },
  "features": [
    {
      "type": "Feature",
      "properties": {
        "id": 0,
        "z1": 74.72296906,
        "z2": 74.72296906
      },
      "geometry": {
        "type": "MultiLineString",
        "coordinates": [
          [
            [
              112.918952568856085,
              28.182139289691705,
              74.72296906
            ],
            [
              112.918964283127451,
              28.182139382193309,
              74.72296906
            ]
          ]
        ]
      }
    },
    ......
由示例数据可知,每个点坐标是由经纬度和高程组成,而L7默认支持路网数据高程显示:

3.8 坡度信息图
利用高程信息,可以制作出坡度信息图
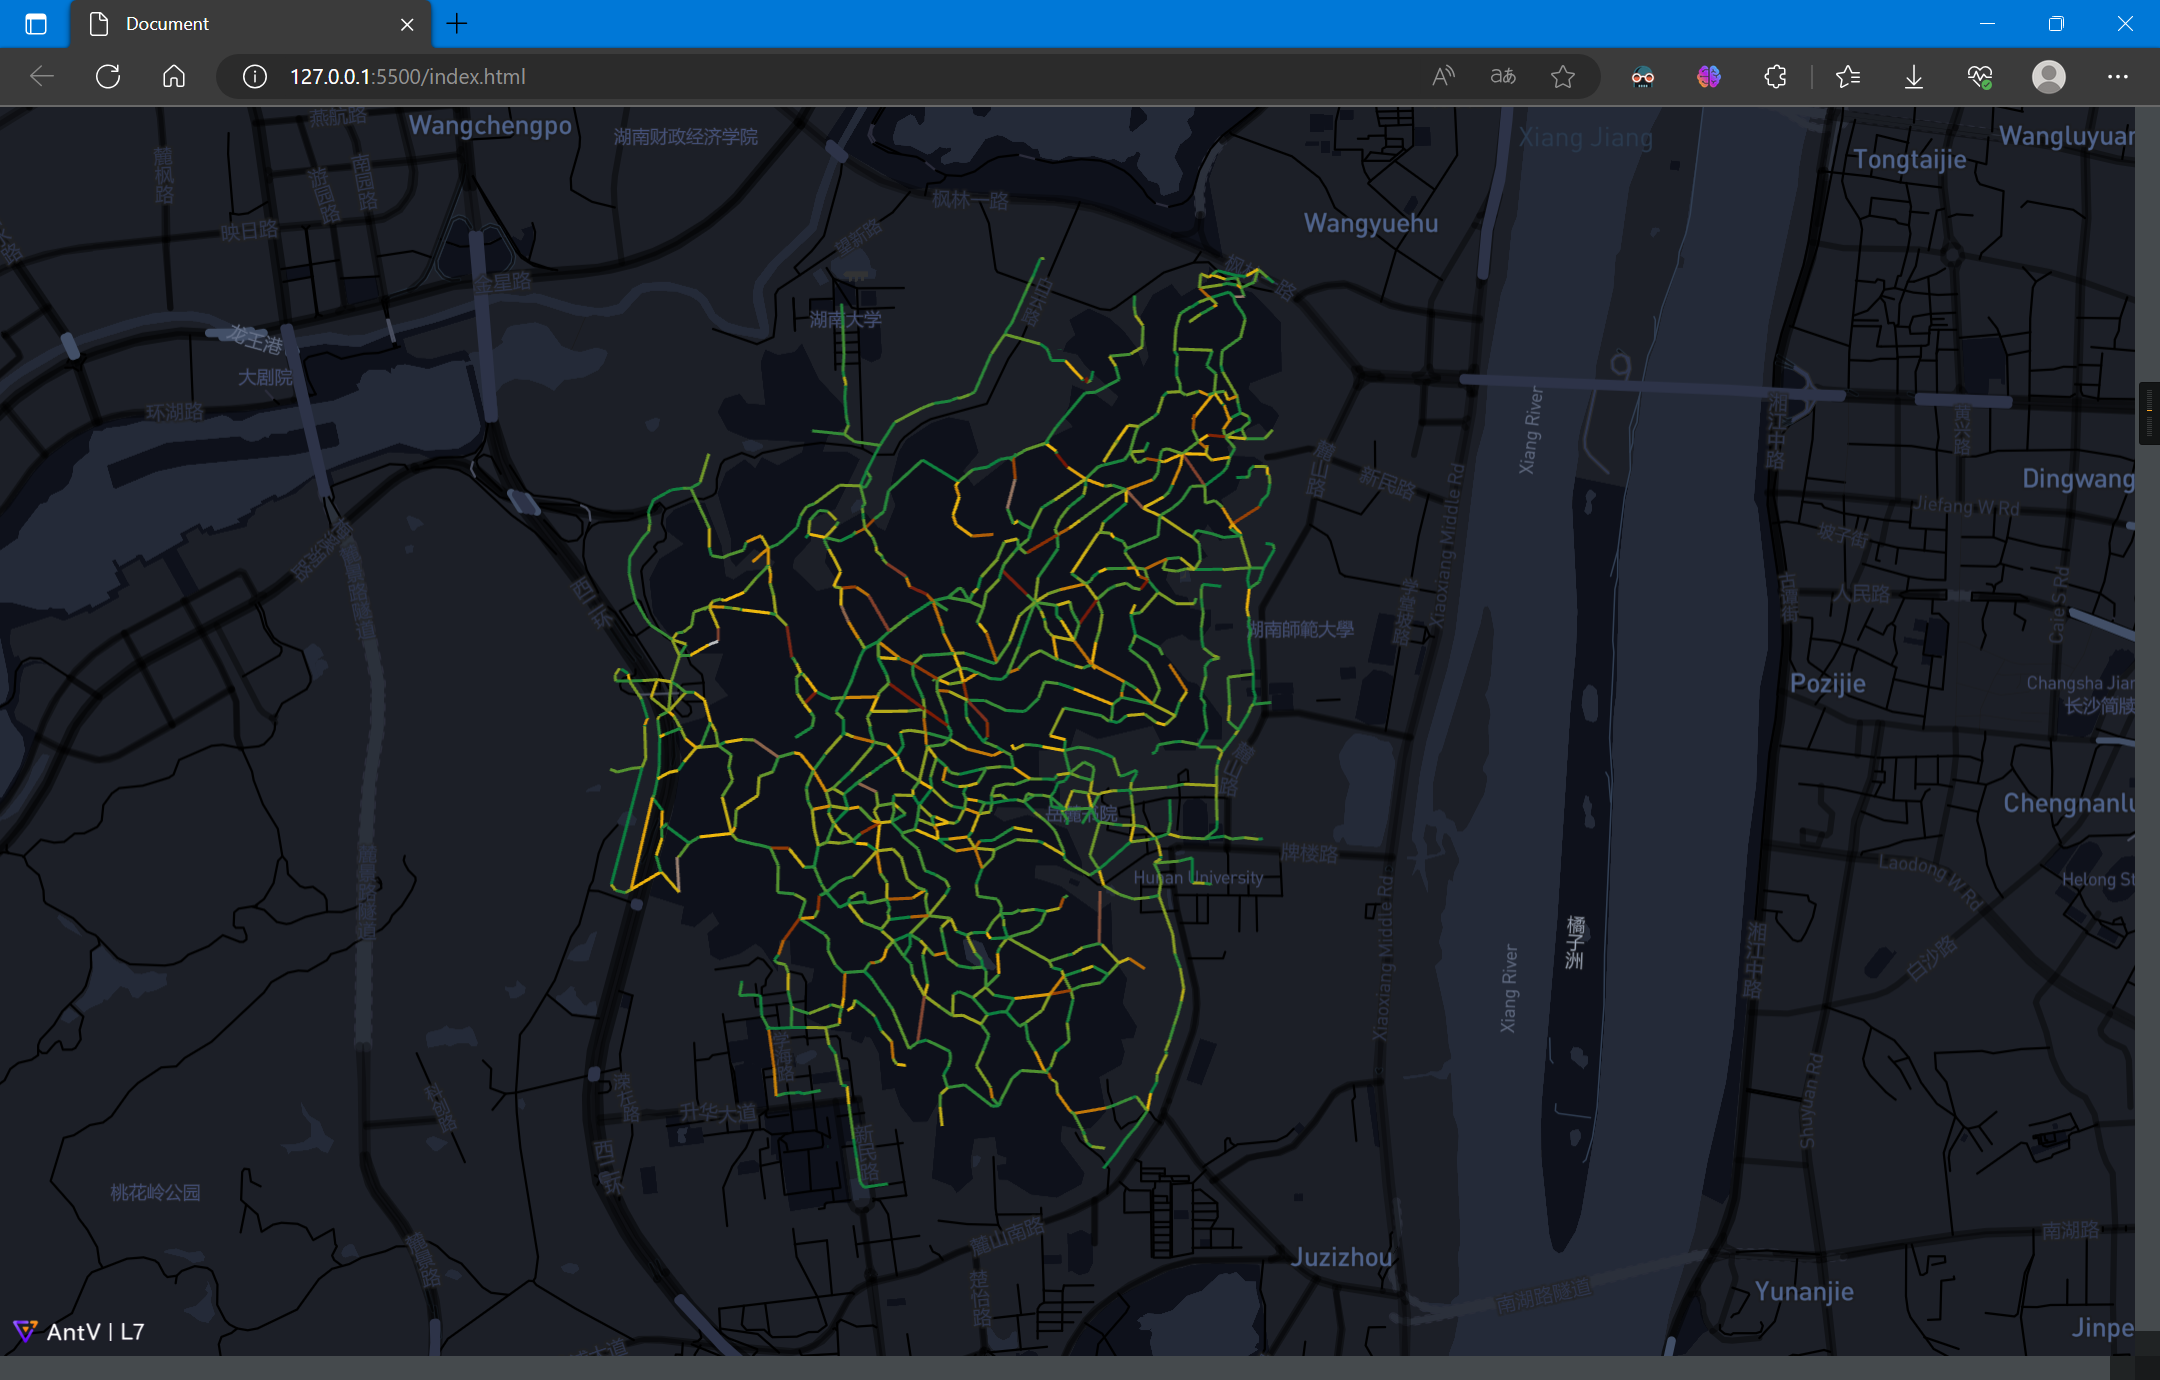
利用坡度信息,可以帮助行人选择道路,实现代码如下:
<!DOCTYPE html>
<html lang="en">

<head>
  <meta charset="UTF-8">
  <meta http-equiv="X-UA-Compatible" content="IE=edge">
  <meta name="viewport" content="width=device-width, initial-scale=1.0">
  <title>Document</title>
  <script src='https://api.mapbox.com/mapbox-gl-js/v2.15.0/mapbox-gl.js'></script>
  <link href='https://api.mapbox.com/mapbox-gl-js/v2.15.0/mapbox-gl.css' rel='stylesheet' />
  <script src='https://unpkg.com/@antv/l7'></script>
  <style>
    body,
    #map {
      height: 100vh;
      width: 100vw;
      margin: 0;
    }
  </style>
</head>

<body>
  <div id="map"></div>
  <script>
    const scene = new L7.Scene({
      id: 'map',
      map: new L7.Mapbox({
        style: 'dark',
        center: [112.9448, 28.1708],
        zoom: 12,
        token: 'pk.eyJ1IjoieWFuZ2ppYW4iLCJhIjoiY2phaG1neno0MXFkNDMzbWhwNWw0bWM4aiJ9.CFmrh0LVWAbmVeed-Xr7wA'
      })
    });

    scene.on('loaded', () => {
      fetch('./Yuelushan.geojson')
        .then(res => res.json())
        .then(data => {
          data.features.forEach(element => {
            element.properties.slope = Math.abs(element.properties.z1 - element.properties.z2);
          });
          const layer = new L7.LineLayer({
            zIndex: 2,
          })
            .source(data)
            .size(1)
            .active(true)
            .color('slope', ['#0b8040', '#f2b90c', '#751304', '#8c644c', '#b8b8b8']);
          scene.addLayer(layer);
        });
    });

  </script>
</body>
4. 参考资料
[3] 场景 Scene | L7 (antgroup.com)


 本文描述使用L7对长沙岳麓山景点游客轨迹数据进行可视化并构建三维路网

