「AntV」全球AQI数据获取与L7可视化
1. 引言
L7 地理空间数据可视分析引擎是一种基于 WebGL 技术的地理空间数据可视化引擎,可以用于实现各种地理空间数据可视化应用。L7 引擎支持多种数据源和数据格式,包括 GeoJSON、CSV等,可以快速加载和渲染大规模地理空间数据。L7 引擎还提供了丰富的可视化效果和交互功能,包括热力图、等高线图、鼠标交互等,可以帮助用户更好地理解和分析地理空间数据。
L7 官网:蚂蚁地理空间数据可视化 | AntV (antgroup.com)
L7 GitHub 仓库:antvis/L7: 🌎 Large-scale WebGL-powered Geospatial Data Visualization analysis engine (github.com)
L7 官方教程:简介 | L7 (antgroup.com)
L7 官方示例:所有图表 | L7 (antgroup.com)
L7 API文档:场景 Scene | L7 (antgroup.com)
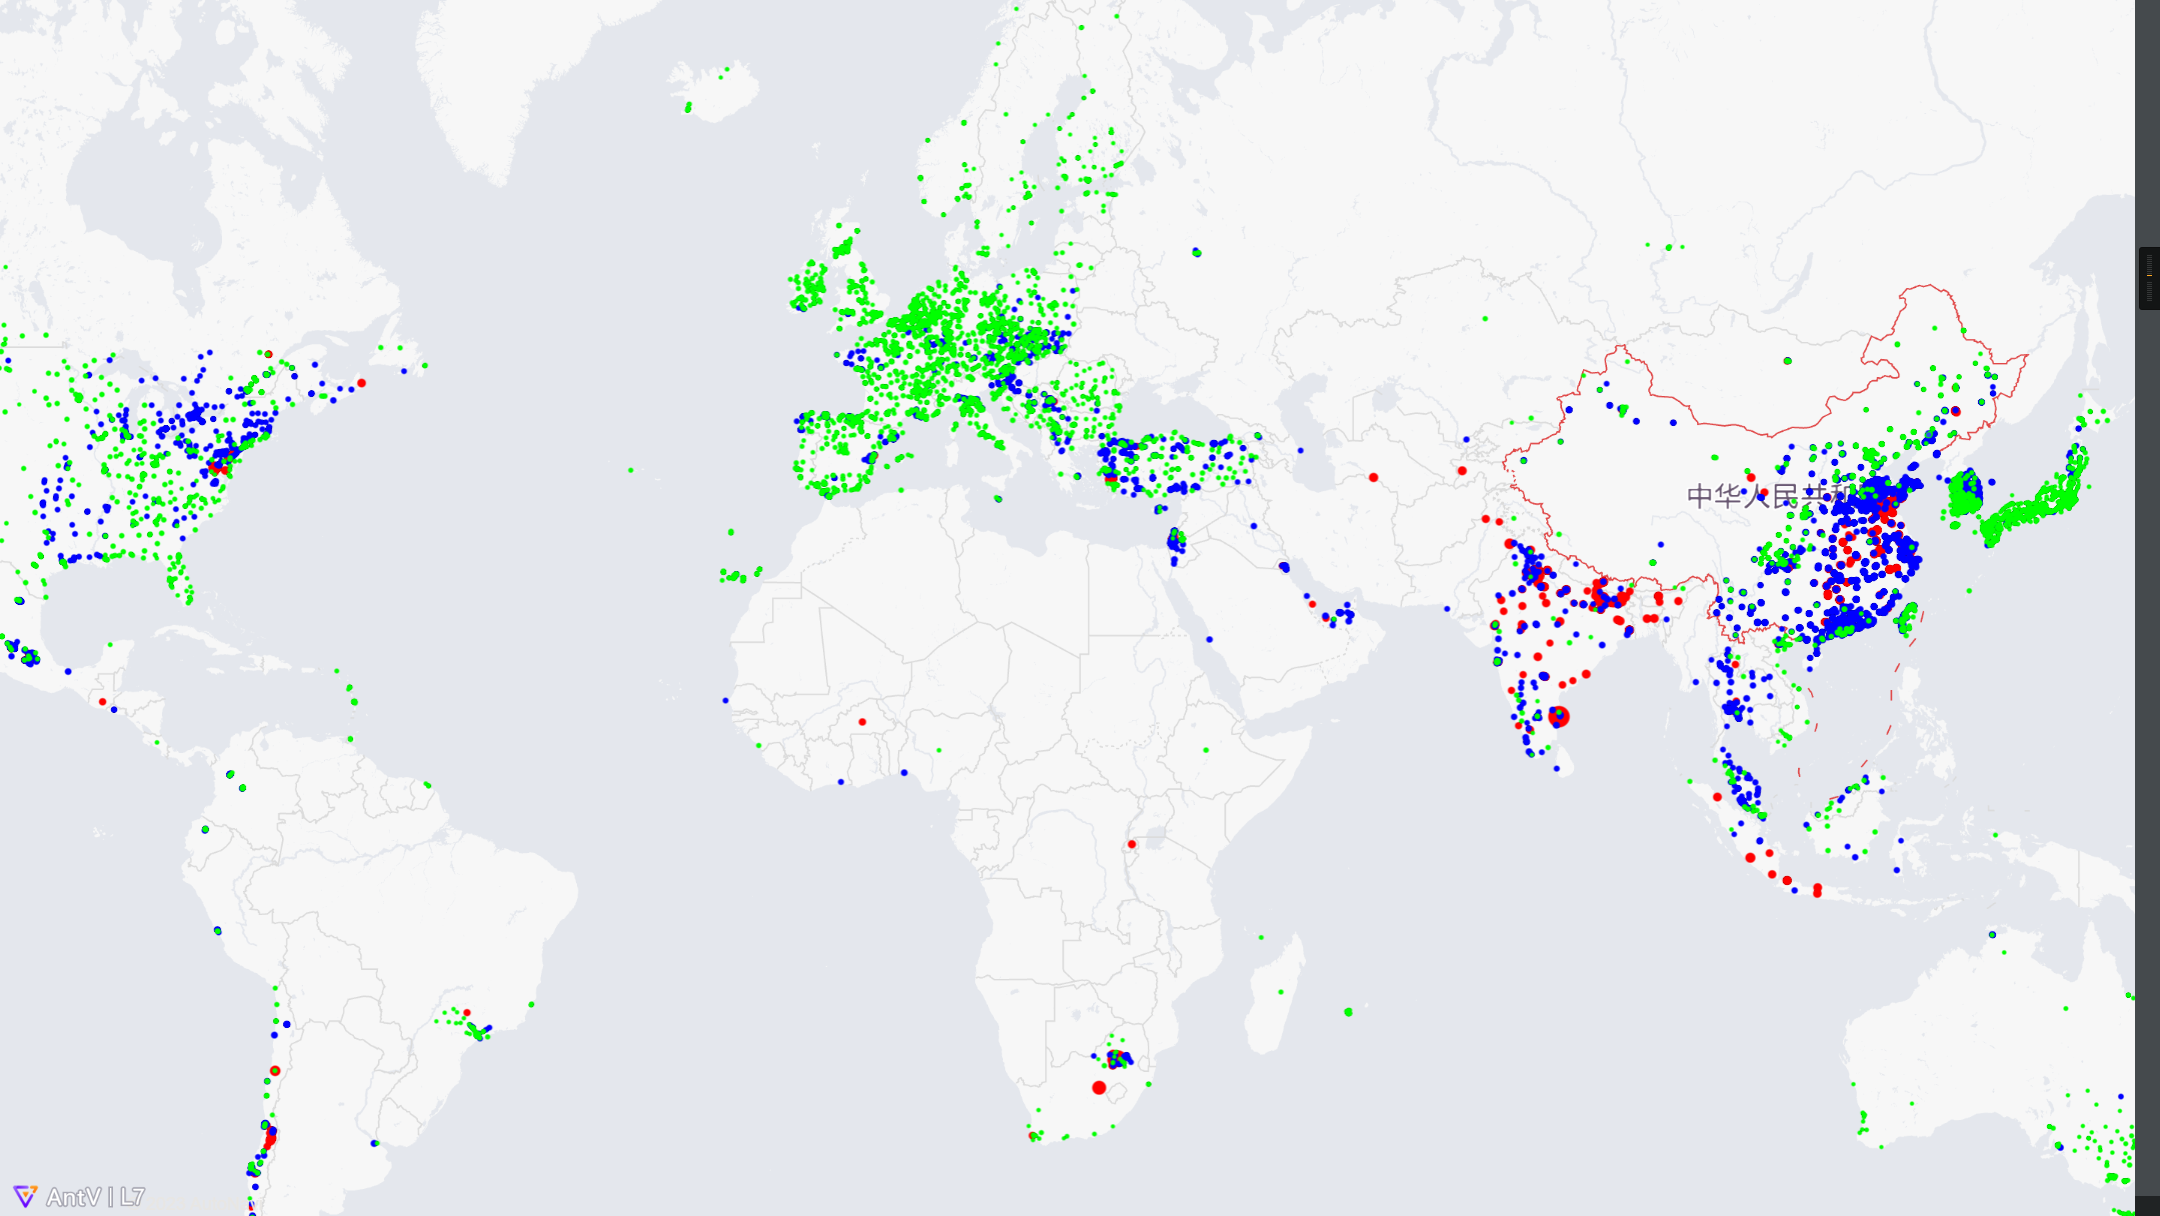
本文描述使用L7对全球AQI数据进行可视化
2. 数据获取
全球AQI数据可从这个网站获取:World's Air Pollution: Real-time Air Quality Index (waqi.info)
进入这个网站后打开控制台,刷新网页重新加载,找到000.json
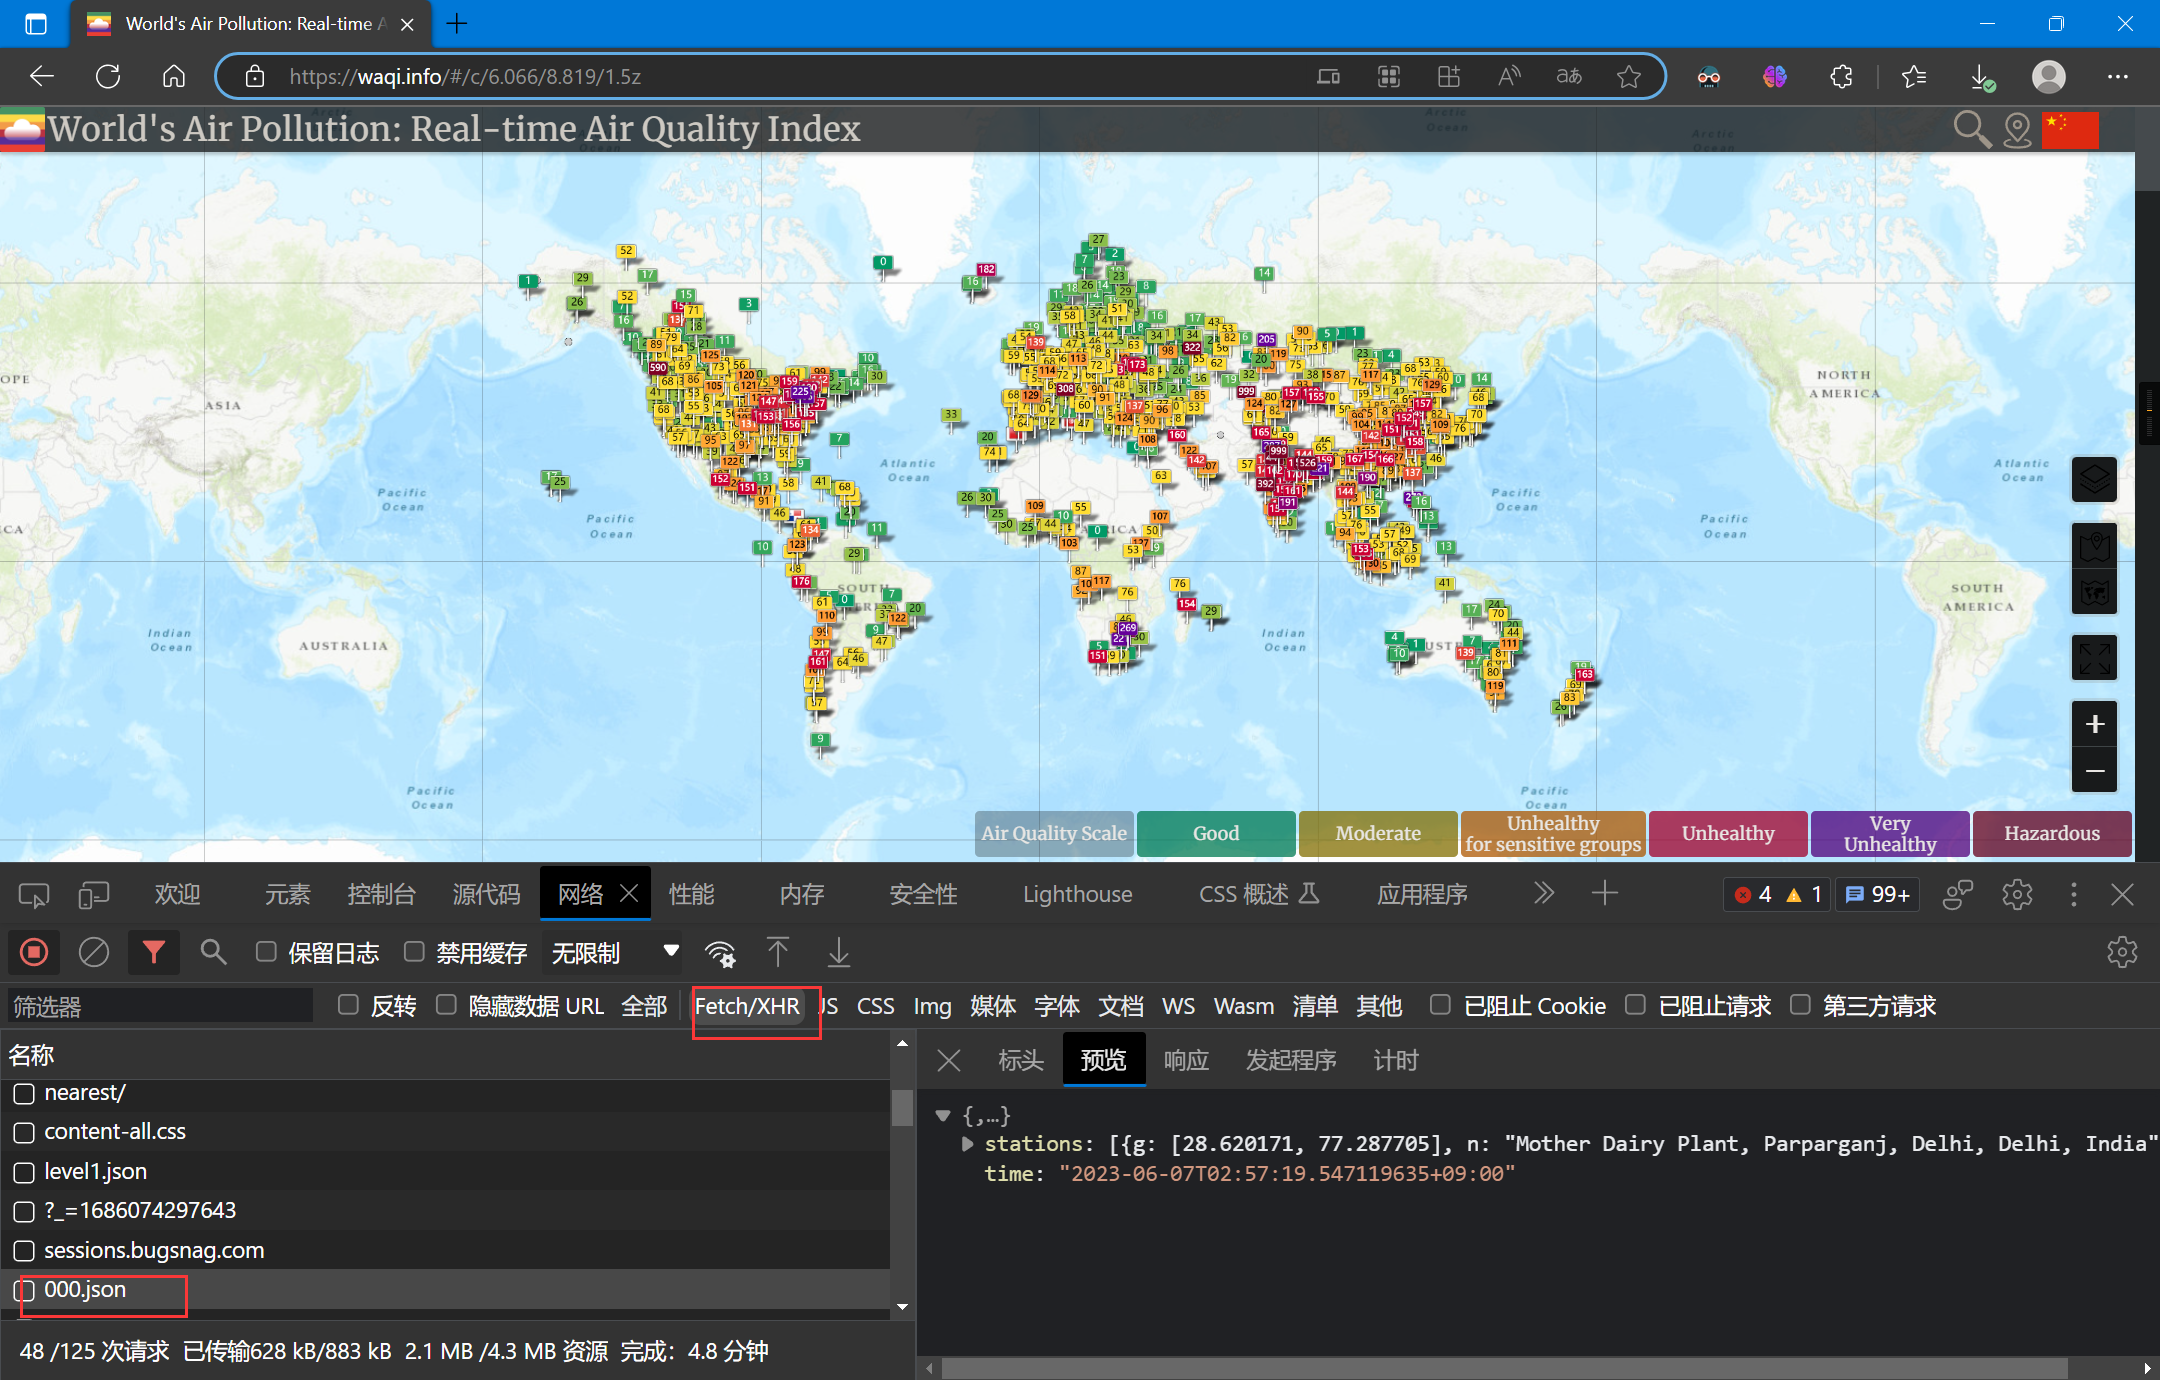
在000.json上右键并在新标签页中打开:
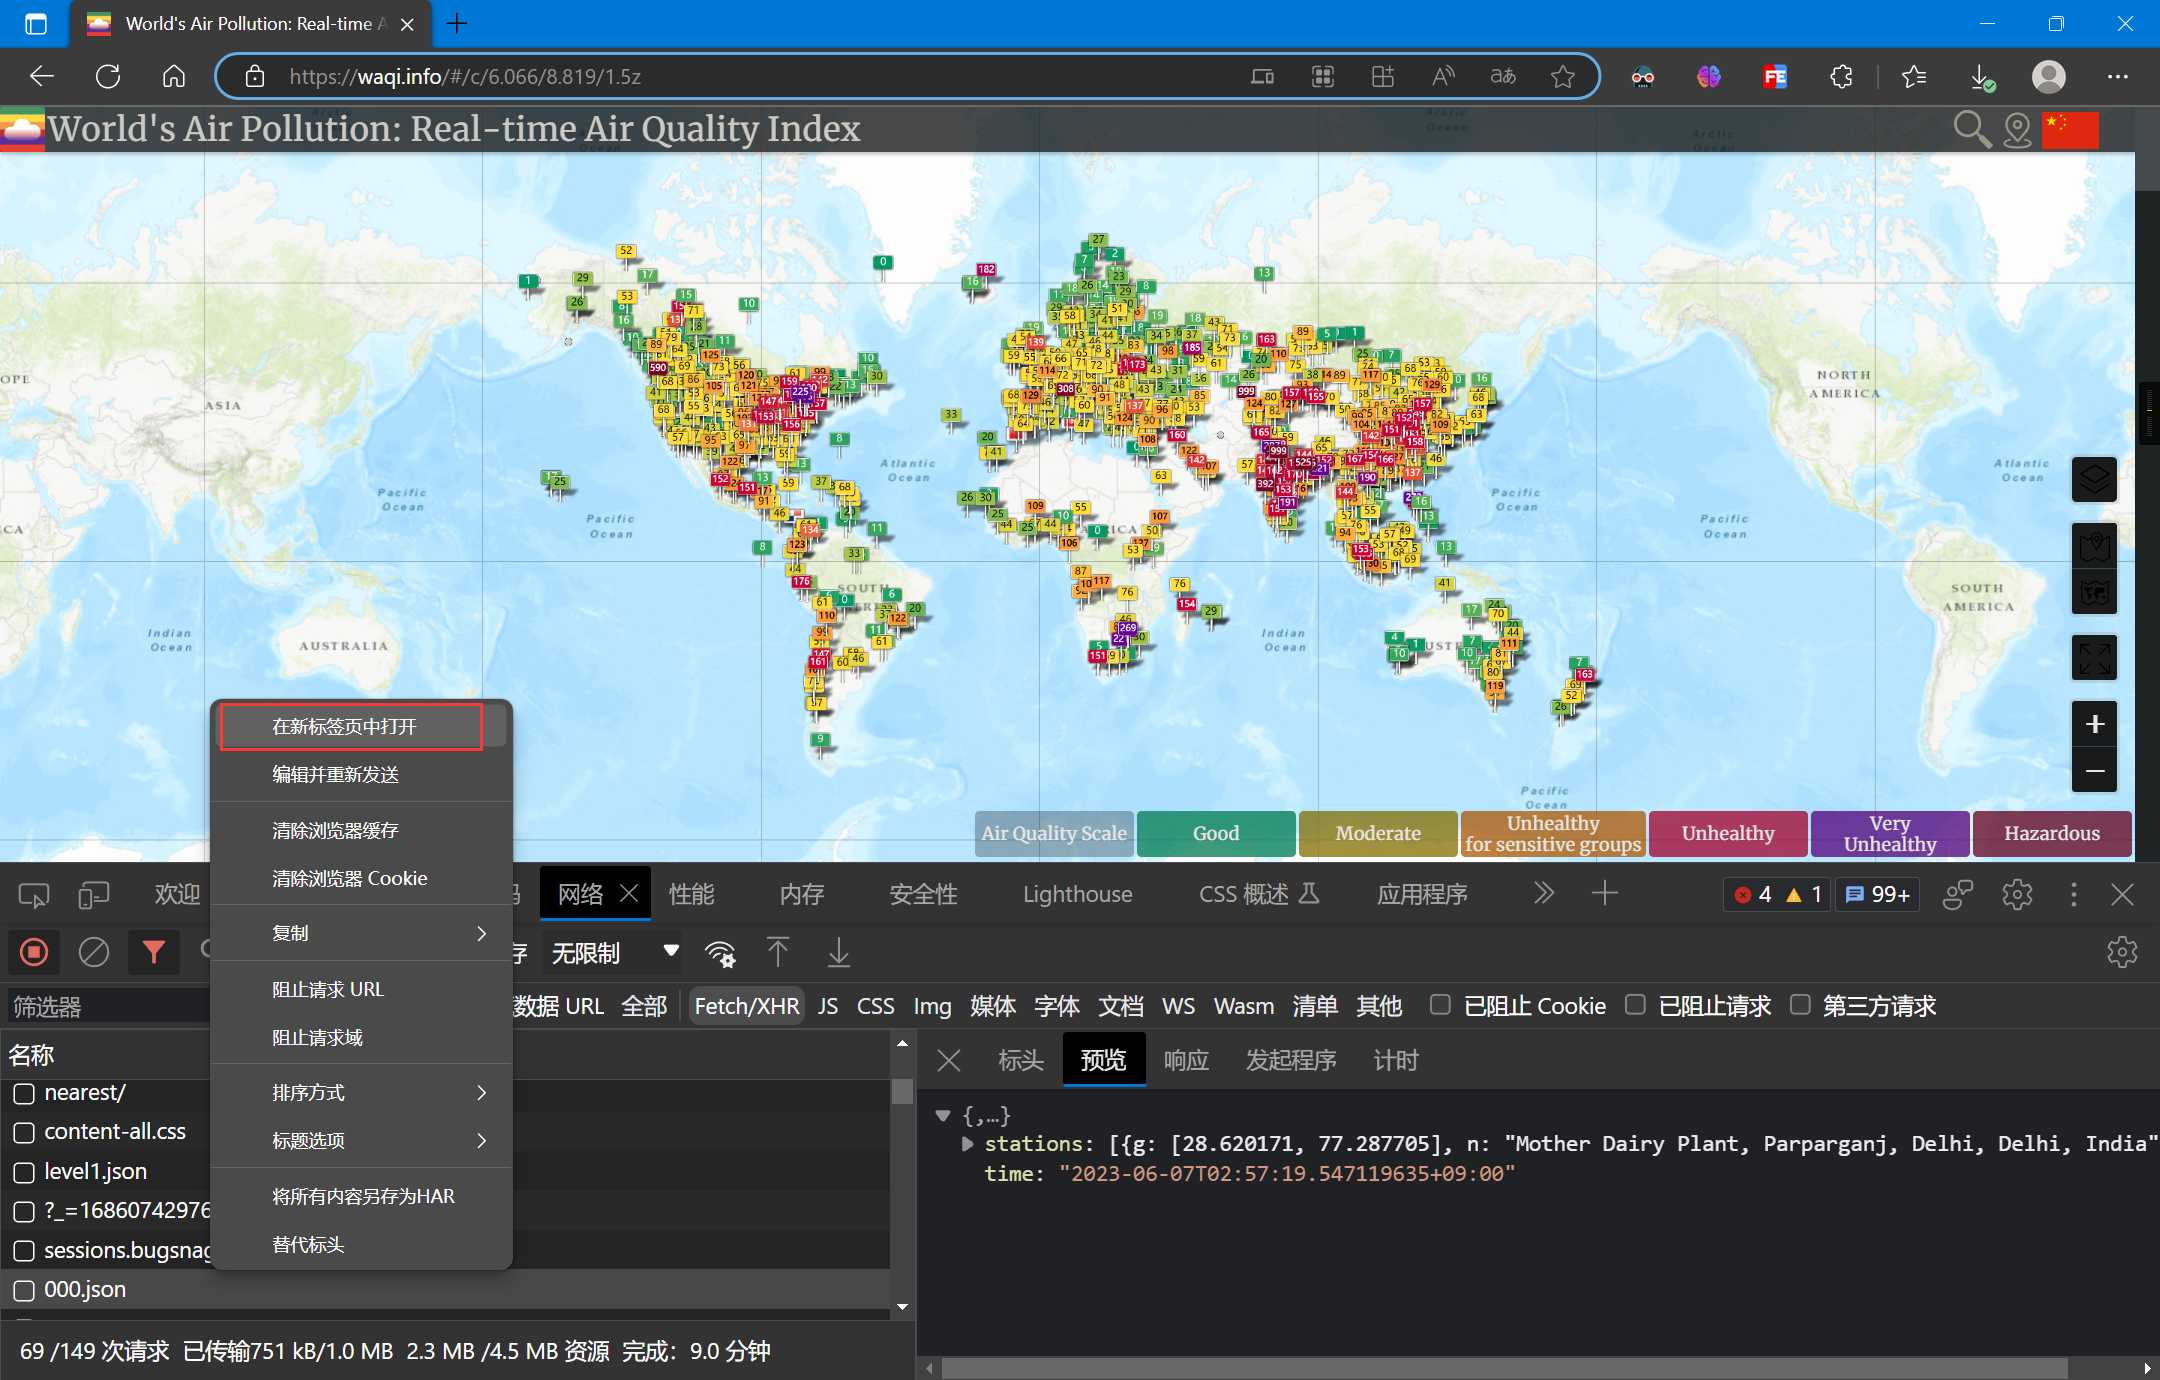
在新标签页中右键并另存为:
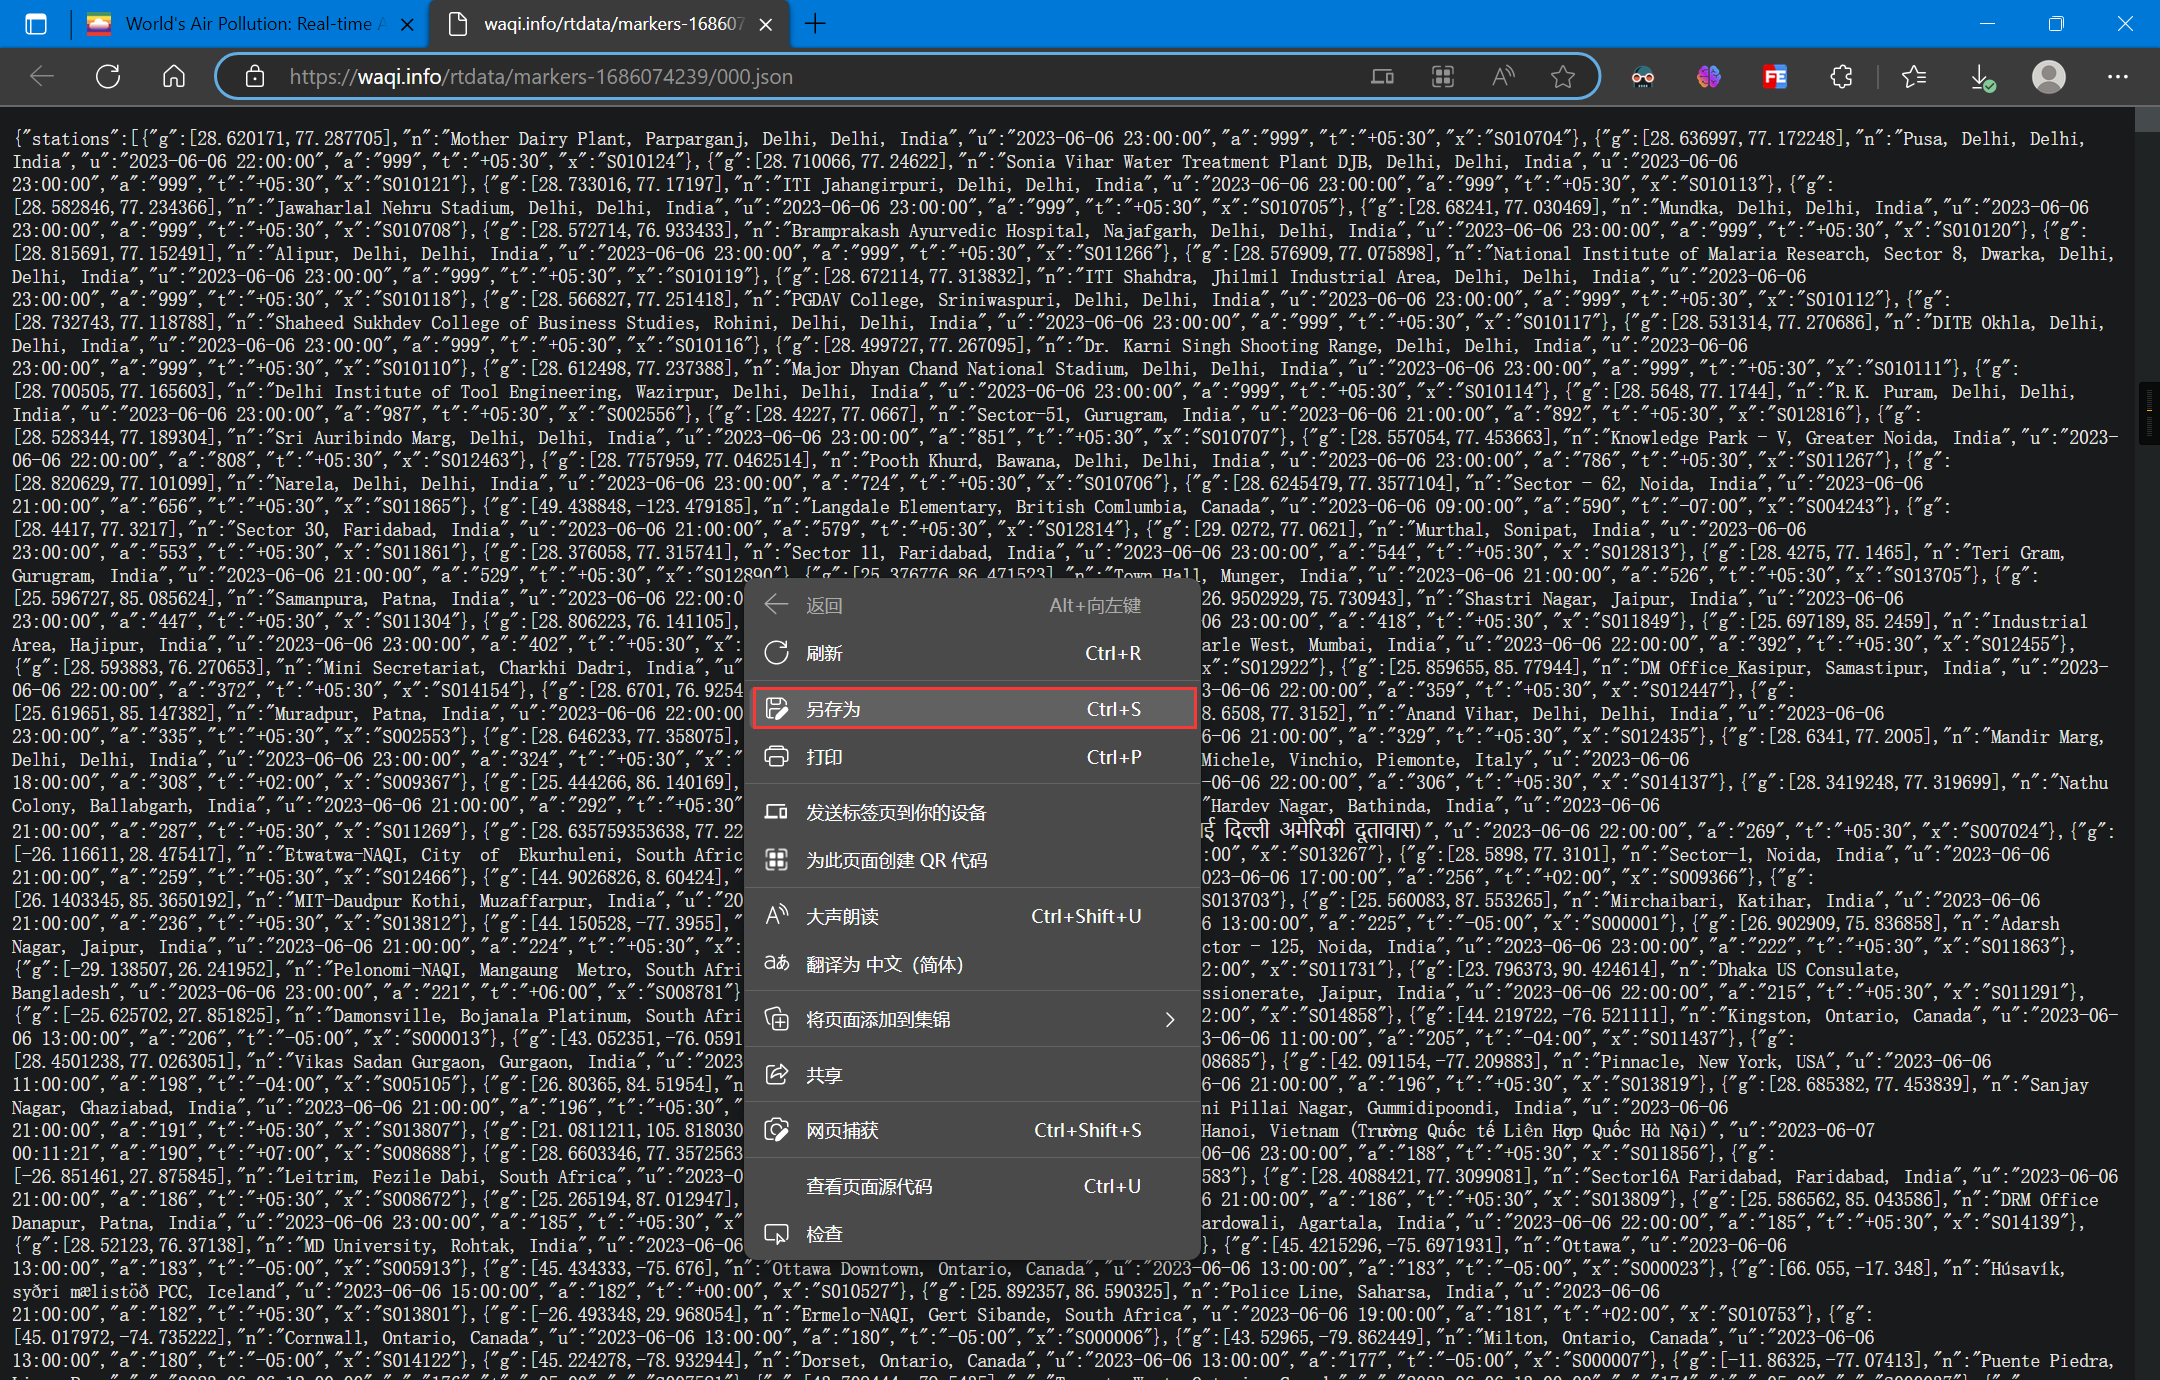
即可获得JSON数据
3. L7可视化
可参考官方散点图样例:简单点 | L7 (antgroup.com)
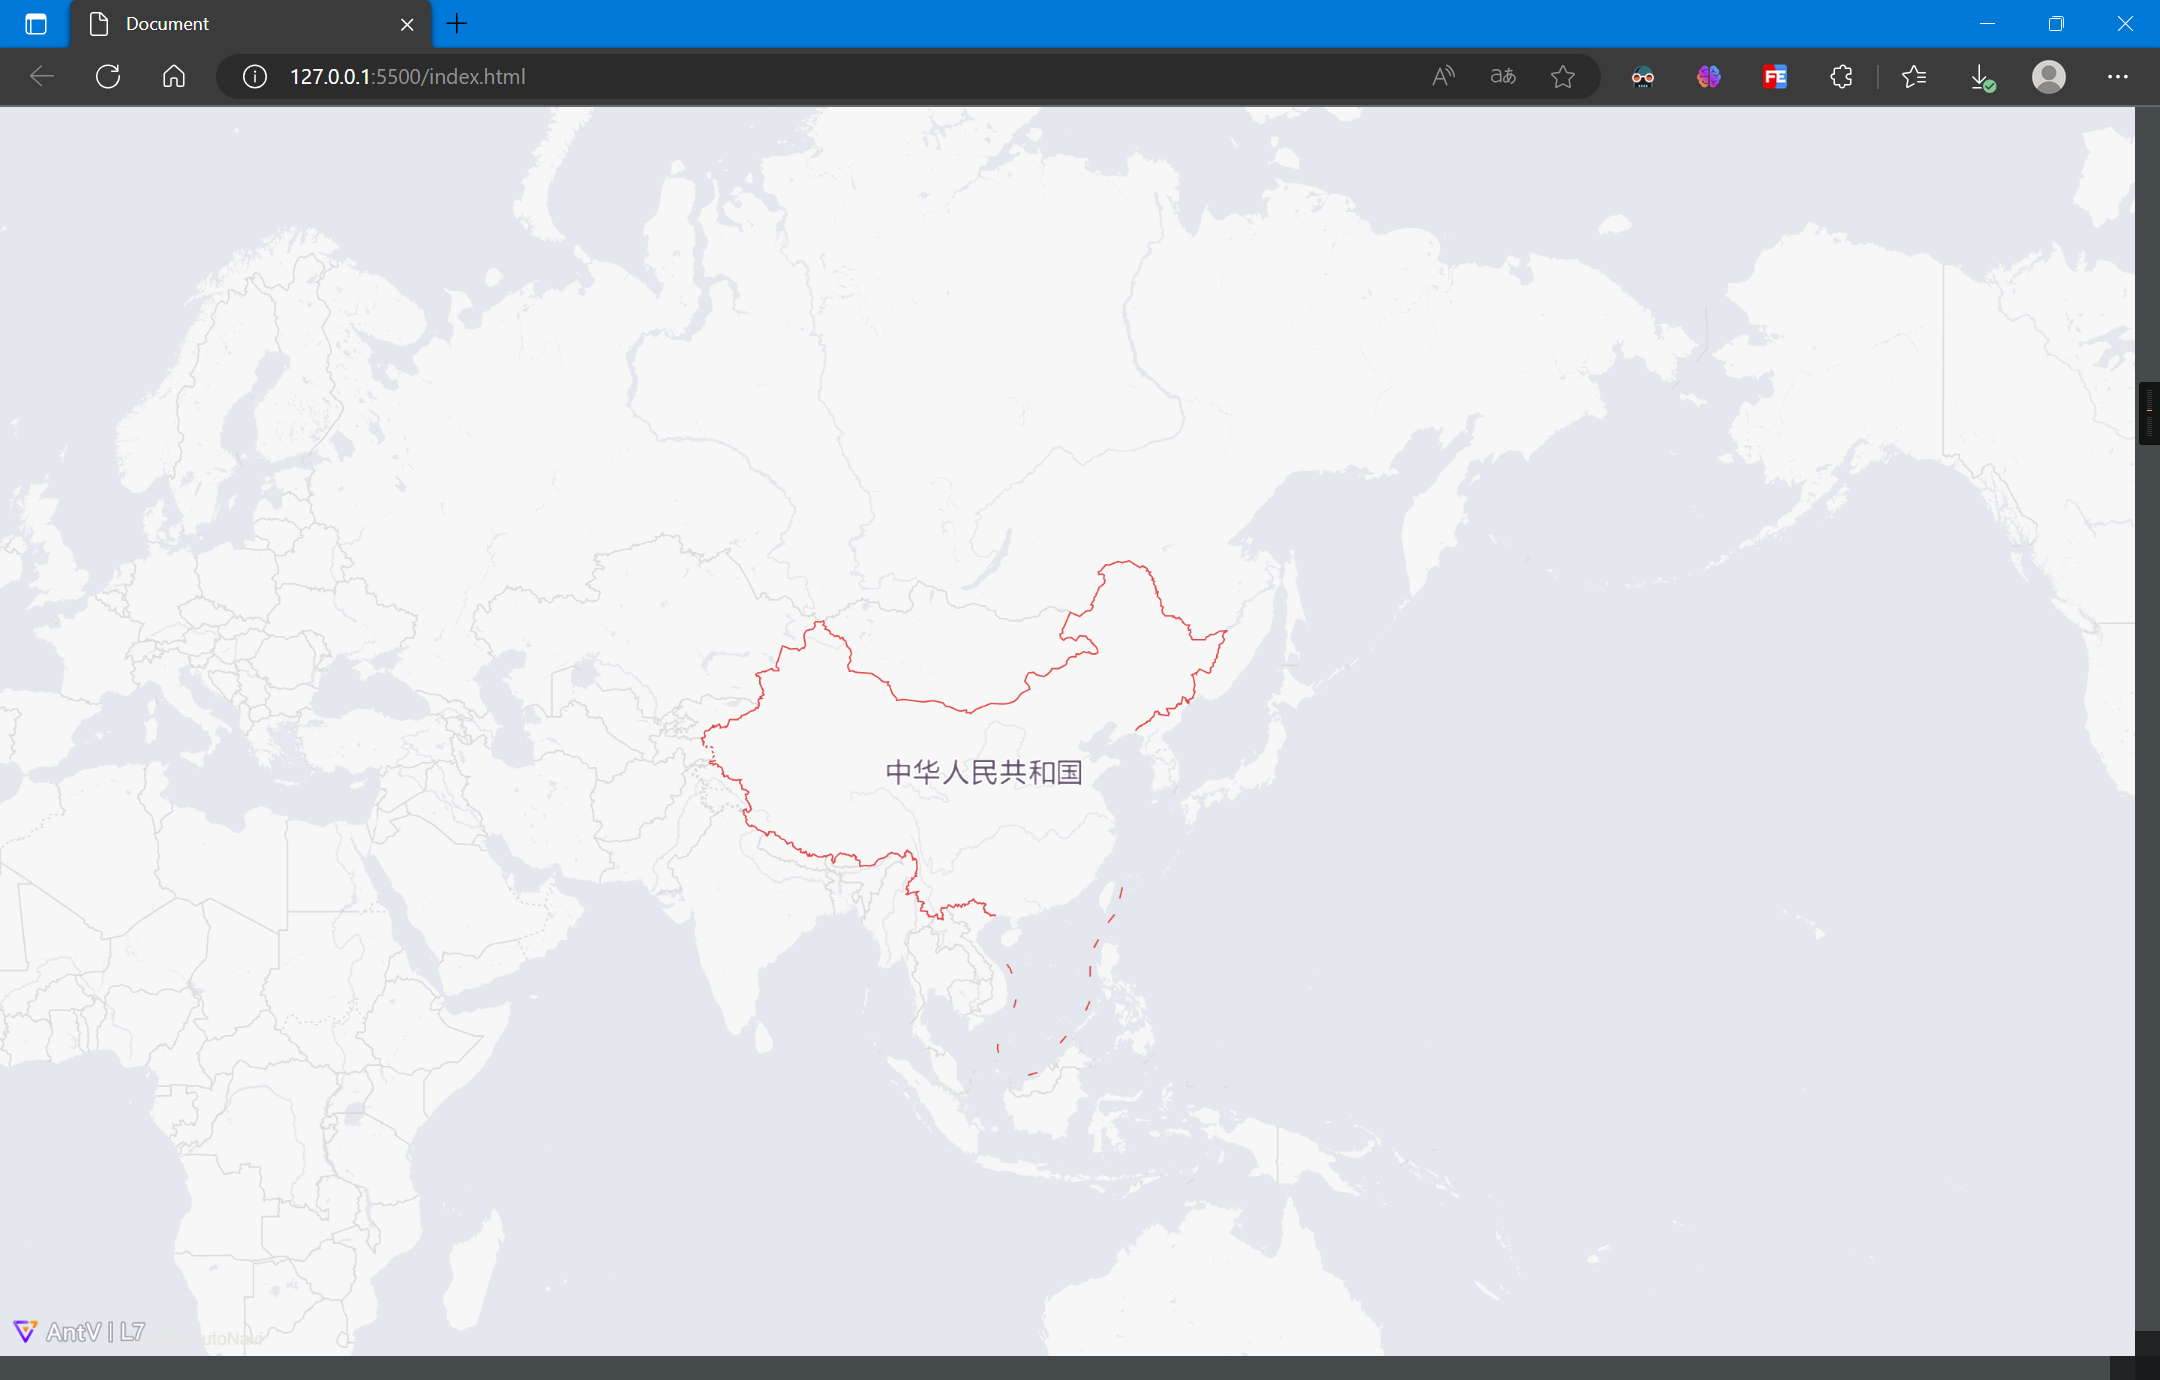
3.1 加载底图
加载高德地图
<!DOCTYPE html>
<html lang="en">

<head>
  <meta charset="UTF-8">
  <meta http-equiv="X-UA-Compatible" content="IE=edge">
  <meta name="viewport" content="width=device-width, initial-scale=1.0">
  <title>Document</title>
  <script src='https://unpkg.com/@antv/l7'></script>
  <style>
    body,
    #map {
      height: 100vh;
      width: 100vw;
      margin: 0;
    }
  </style>
</head>

<body>
  <div id="map"></div>
  <script>
    const scene = new L7.Scene({
      id: 'map',
      map: new L7.GaodeMap({
        center: [116.3956, 39.9392],
        zoom: 2,
        style: 'light'
      })
    });
  </script>
</body>

</html>
3.2 加载数据并解析
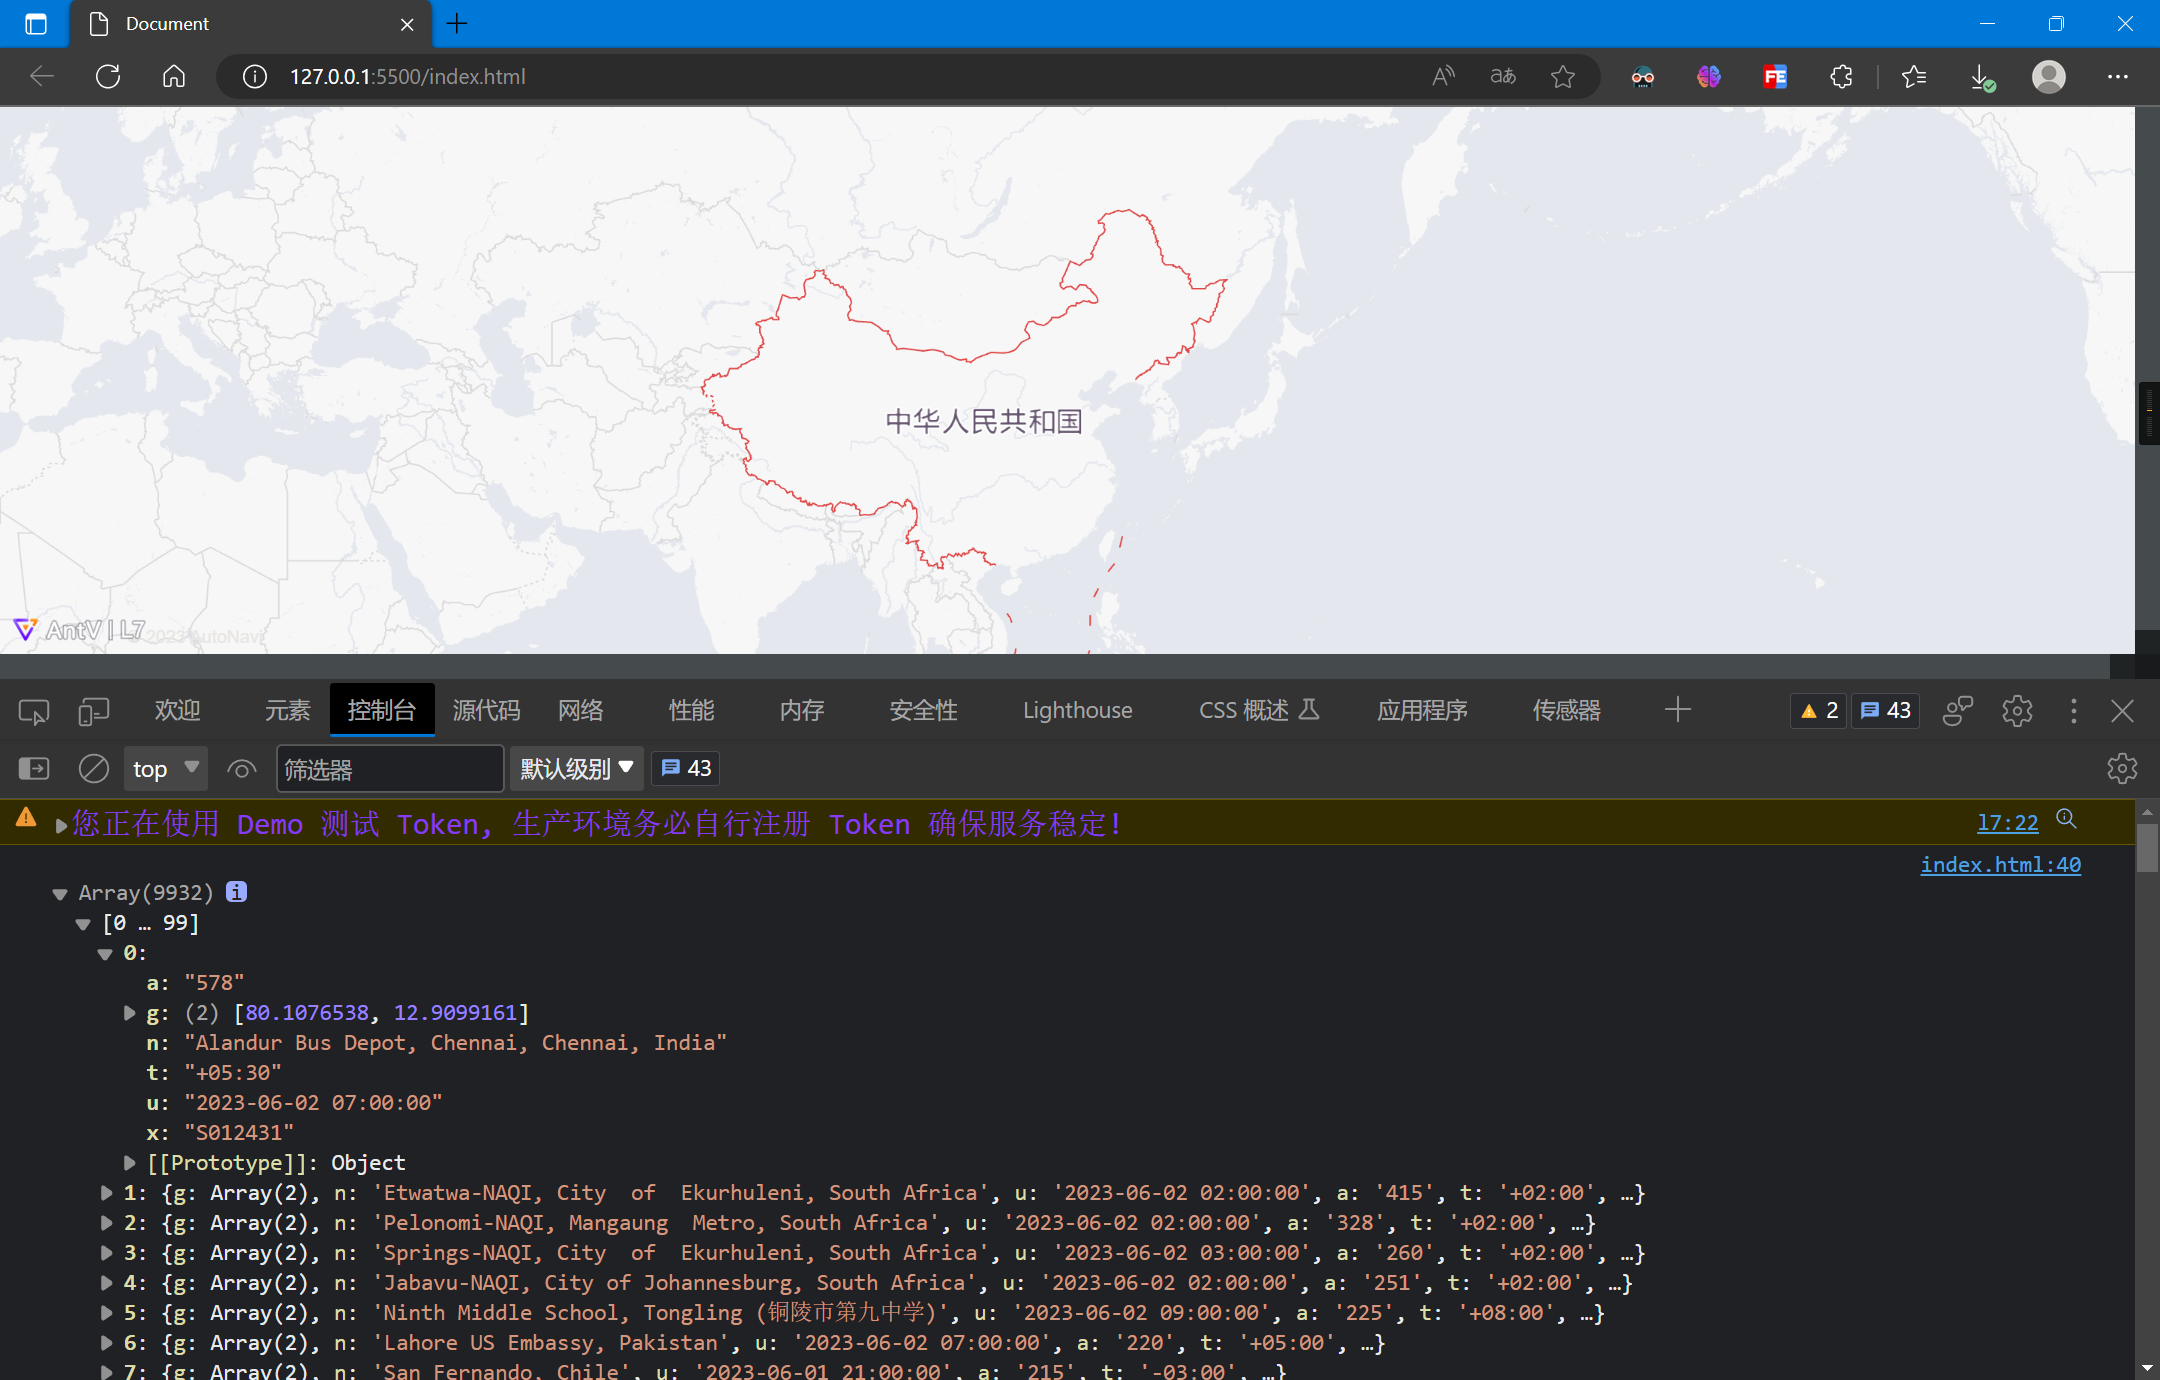
根据数据内容,将经纬度数组转置以符合L7的数据格式:
scene.on('loaded', () => {
    fetch('./000.json')
        .then(res => res.json())
        .then(data => {
        data = data.stations
        data.forEach(item => {
            item.g.reverse()
        })
        console.log(data);
    })
});
3.3 绘制样式
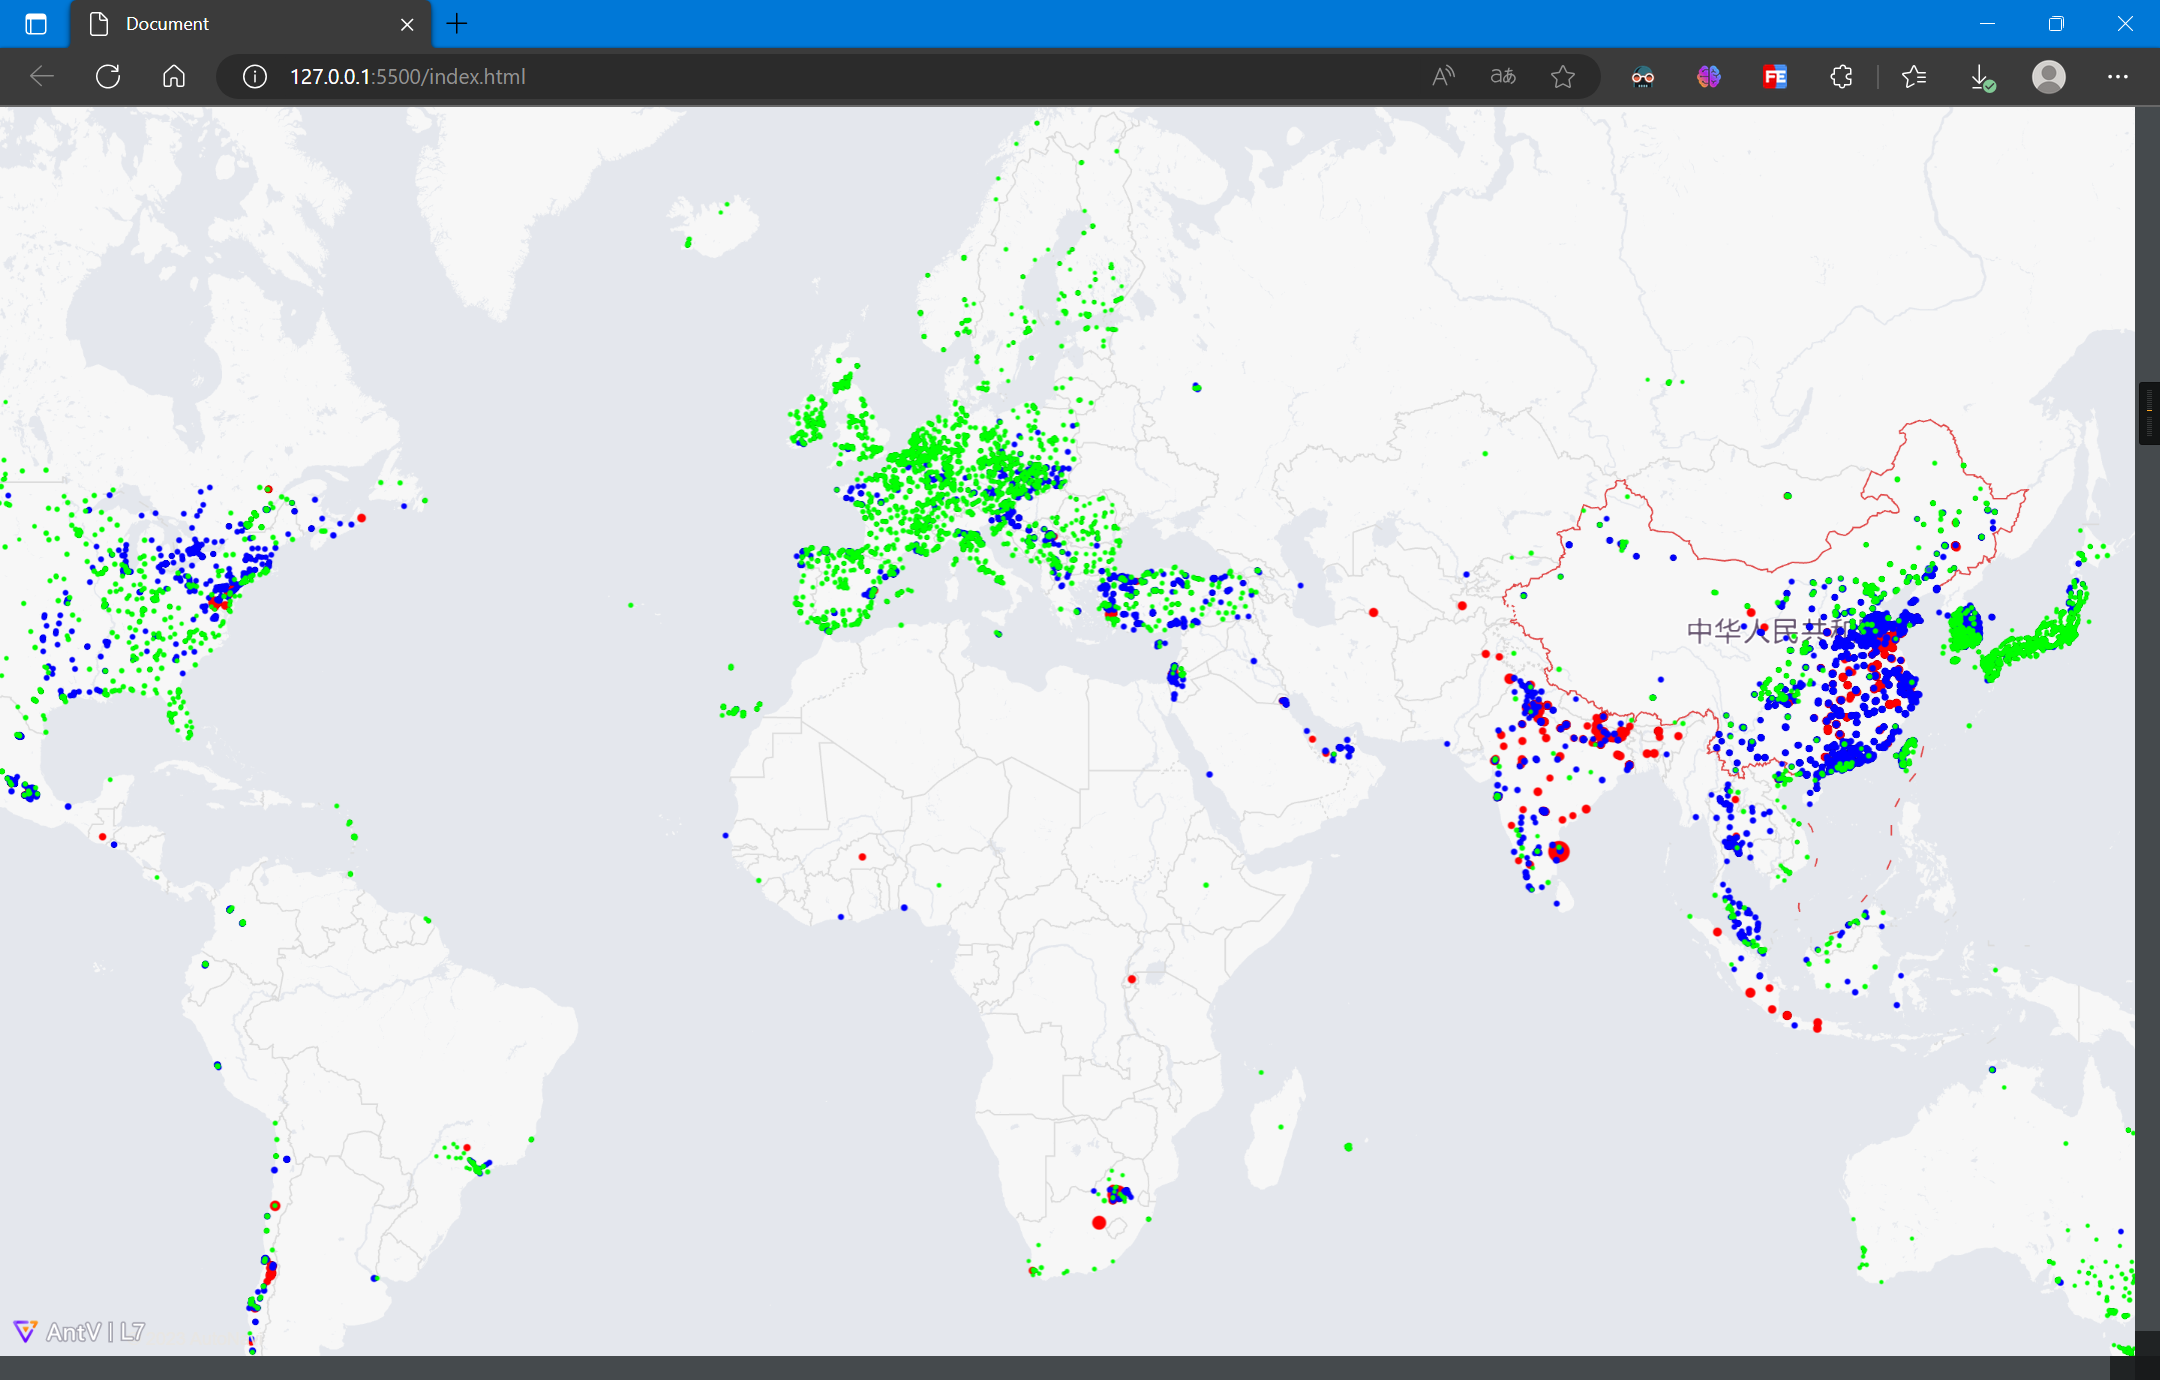
绘制点图层,并设置样式:
const layer = new L7.PointLayer()
    .source(data, {
        parser: {
            type: 'json',
            coordinates: 'g'
        }
    })
    .shape('circle')
    .color('a', (value) => {
        // 大于0小于50的绿色
        if (value > 0 && value < 50) {
            return '#00ff00'
        } else if (value > 50 && value < 100) {
            // 大于50小于100的蓝色
            return '#0000ff'
        } else if (value > 100) {
            // 大于100的红色
            return '#ff0000'
        }
    })
    .size('a', (value) => {
        // 根据value值设置点的大小
        let a = value / 100 + 2;
        return a;
    })
    .active(true);
scene.addLayer(layer);
3.4 完整代码
完整代码如下:
<!DOCTYPE html>
<html lang="en">

<head>
  <meta charset="UTF-8">
  <meta http-equiv="X-UA-Compatible" content="IE=edge">
  <meta name="viewport" content="width=device-width, initial-scale=1.0">
  <title>Document</title>
  <script src='https://unpkg.com/@antv/l7'></script>
  <style>
    body,
    #map {
      height: 100vh;
      width: 100vw;
      margin: 0;
    }
  </style>
</head>

<body>
  <div id="map"></div>
  <script>
    const scene = new L7.Scene({
      id: 'map',
      map: new L7.GaodeMap({
        center: [116.3956, 39.9392],
        zoom: 2,
        style: 'light'
      })
    });

    scene.on('loaded', () => {
      fetch('./000.json')
        .then(res => res.json())
        .then(data => {
          data = data.stations
          data.forEach(item => {
            item.g.reverse()
          })
          // console.log(data);
          const layer = new L7.PointLayer()
            .source(data, {
              parser: {
                type: 'json',
                coordinates: 'g'
              }
            })
            .shape('circle')
            .color('a', (value) => {
                // 大于0小于50的绿色
              if (value > 0 && value < 50) {
                return '#00ff00'
              } else if (value > 50 && value < 100) {
                // 大于50小于100的蓝色
                return '#0000ff'
              } else if (value > 100) {
                // 大于100的红色
                return '#ff0000'
              }
            })
            .size('a', (value) => {
              // 根据value值设置点的大小
              let a = value / 100 + 2;
              return a;
            })
            .active(true);
          scene.addLayer(layer);
        });
    });
  </script>
</body>

</html>


 本文描述使用L7对全球AQI数据进行可视化
