OpenLayers点聚合
1. 引言
当页面加载的数据量过大时,拖拽、缩放时往往会产生卡顿
然而,页面实现的内容是有限的,人眼可见范围也是有限的,过于微小的部分是可以不予显示的
聚合是解决这种问题的一个办法,当数据比较多,单个又太小时,将多个数据合并为一个显示
OpenLayers提供了聚合的API,参考:
OpenLayers提供了聚合的示例,参考:
本文基于OpenLayers的Cluster API,实现点聚合效果
2. 环境准备
OpenLayers版本为最新版6.15.1,CDN引入:
<link rel="stylesheet" href="https://cdn.jsdelivr.net/gh/openlayers/openlayers.github.io@master/en/v6.15.1/css/ol.css" type="text/css"> <script src="https://cdn.jsdelivr.net/gh/openlayers/openlayers.github.io@master/en/v6.15.1/build/ol.js"></script>
数据来源自OpenLayers的聚合示例种的数据,地址为:
3. 点聚合
构建一个基础页面,加载底图:
<!DOCTYPE html> <html lang="en"> <head> <meta charset="UTF-8"> <meta http-equiv="X-UA-Compatible" content="IE=edge"> <meta name="viewport" content="width=device-width, initial-scale=1.0"> <title>Document</title> <link rel="stylesheet" href="https://cdn.jsdelivr.net/gh/openlayers/openlayers.github.io@master/en/v6.15.1/css/ol.css" type="text/css"> <script src="https://cdn.jsdelivr.net/gh/openlayers/openlayers.github.io@master/en/v6.15.1/build/ol.js"></script> <style> html, body { height: 100%; } body { margin: 0; padding: 0; } #map { height: 100%; } </style> </head> <body> <div id="map"></div> <script> const map = new ol.Map({ target: 'map', layers: [], view: new ol.View({ center: [16.35, 48.20], zoom: 12, projection: 'EPSG:4326' }) }) map.addLayer(new ol.layer.WebGLTile({ source: new ol.source.OSM() })); </script> </body> </html>
加载JSON数据,创建聚合数据源:
const source = new ol.source.Vector({ url: 'https://openlayers.org/en/latest/examples/data/geojson/photovoltaic.json', format: new ol.format.GeoJSON() }) const clusterSource = new ol.source.Cluster({ source: source, }) const vectorLayer = new ol.layer.Vector({ source: clusterSource, }) map.addLayer(vectorLayer);
参考官方API文档:
默认的聚合范围为20
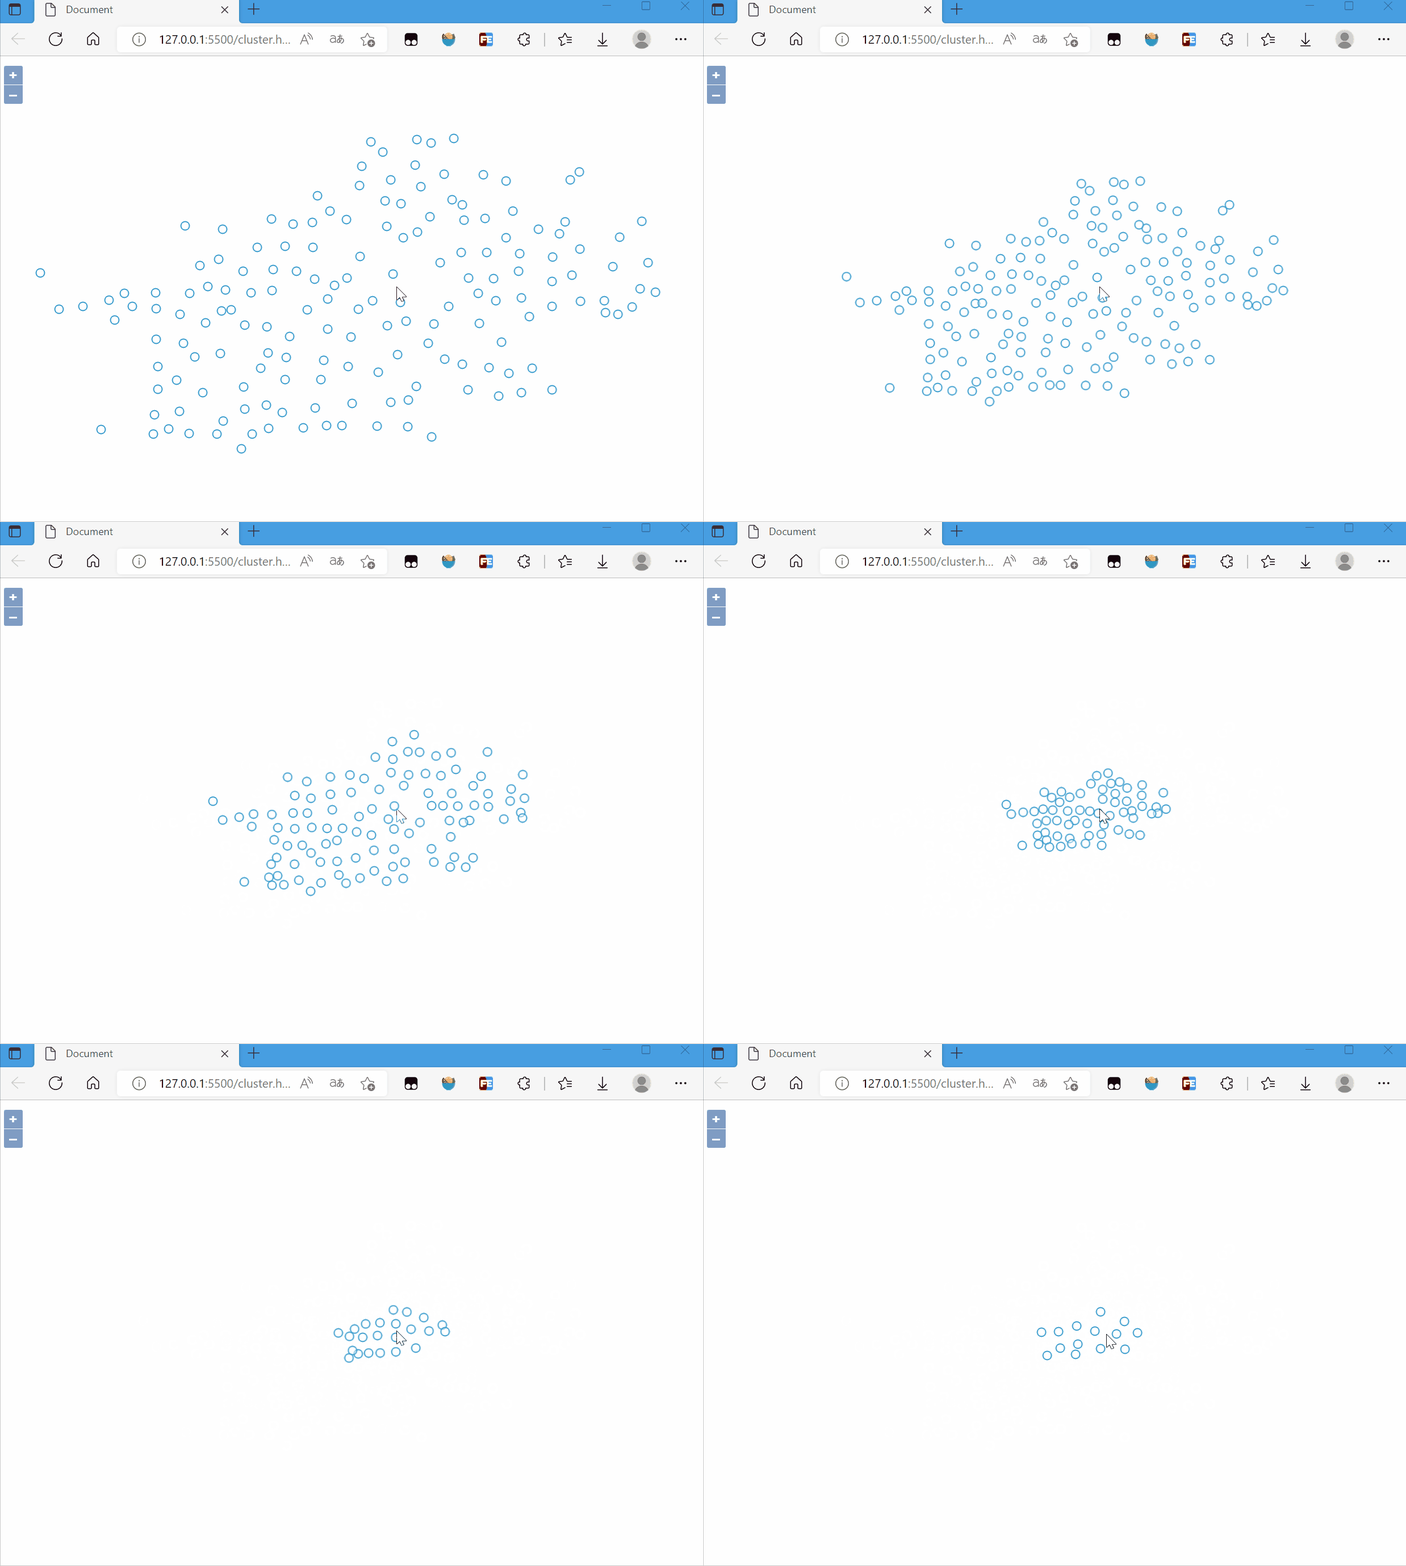
实现的效果:

添加聚合样式:
const vectorLayer = new ol.layer.Vector({ source: clusterSource, // 聚合样式 style: function (feature) { // 点的个数 const size = feature.get('features').length return new ol.style.Style({ image: new ol.style.Circle({ // 圆形 radius: 15, // 半径 stroke: new ol.style.Stroke({ // 边框 color: '#fff' }), fill: new ol.style.Fill({ // 填充 color: '#3399CC' }) }), text: new ol.style.Text({ // 文字样式 font: '15px sans-serif', text: size.toString(), fill: new ol.style.Fill({ color: '#fff' }) }) }) } })
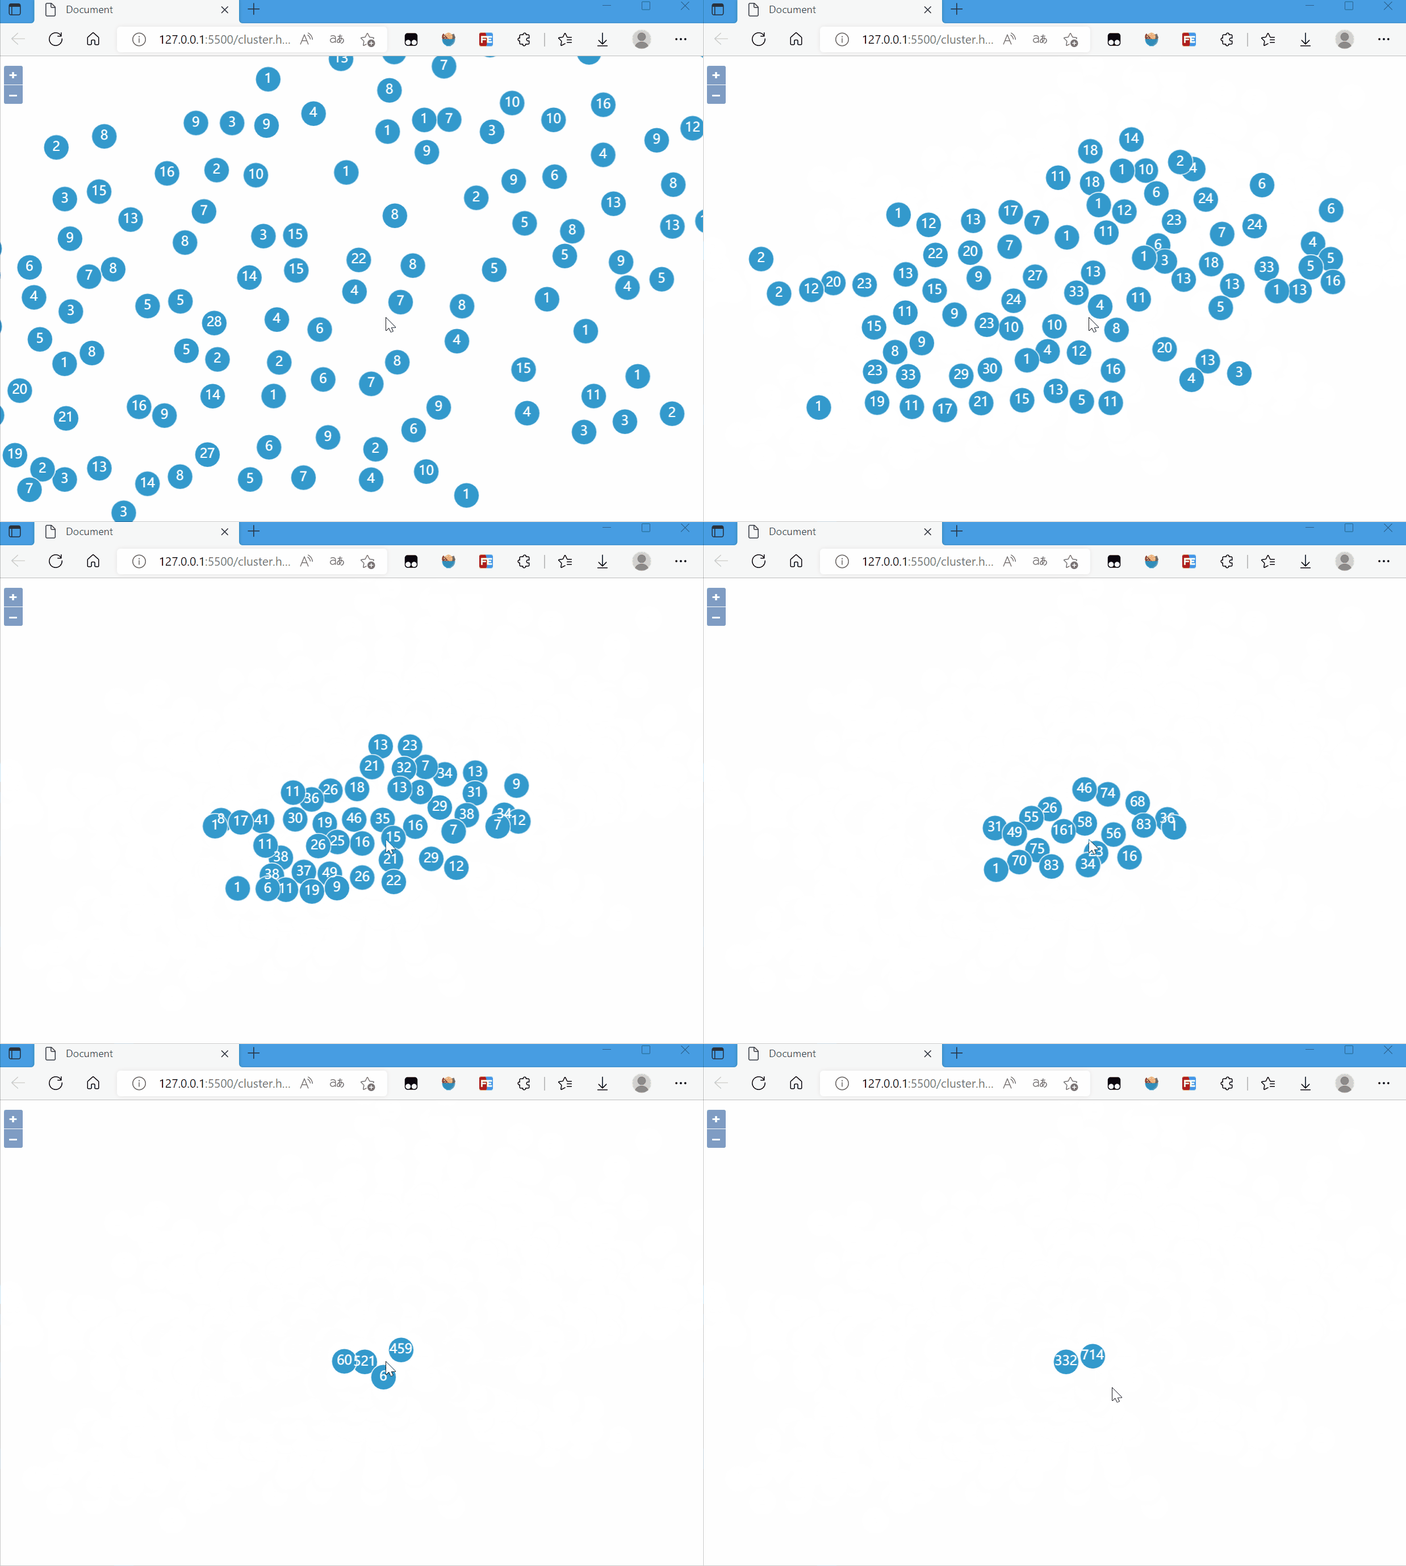
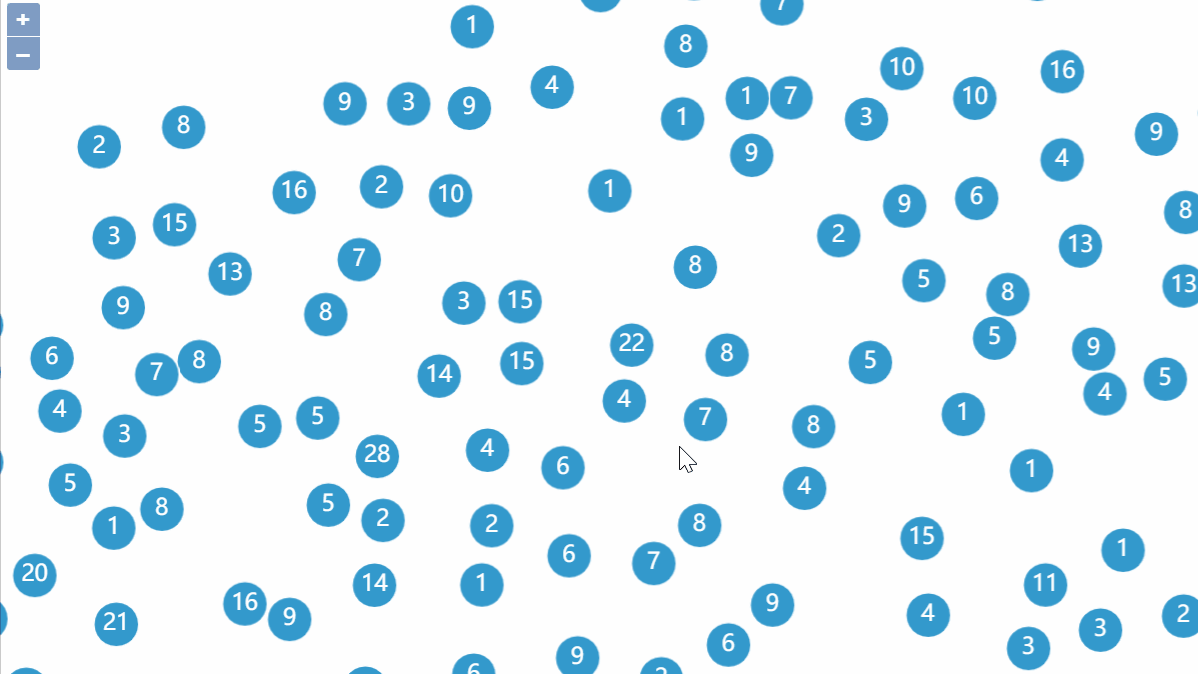
实现效果:

4. 完整代码
完整代码如下:
<!DOCTYPE html> <html lang="en"> <head> <meta charset="UTF-8"> <meta http-equiv="X-UA-Compatible" content="IE=edge"> <meta name="viewport" content="width=device-width, initial-scale=1.0"> <title>Document</title> <link rel="stylesheet" href="https://cdn.jsdelivr.net/gh/openlayers/openlayers.github.io@master/en/v6.15.1/css/ol.css" type="text/css"> <script src="https://cdn.jsdelivr.net/gh/openlayers/openlayers.github.io@master/en/v6.15.1/build/ol.js"></script> <style> html, body { height: 100%; } body { margin: 0; padding: 0; } #map { height: 100%; } </style> </head> <body> <div id="map"></div> <script> const map = new ol.Map({ target: 'map', layers: [], view: new ol.View({ center: [16.35, 48.20], zoom: 12, projection: 'EPSG:4326' }) }) // map.addLayer(new ol.layer.WebGLTile({ // source: new ol.source.OSM() // })); const source = new ol.source.Vector({ url: 'https://openlayers.org/en/latest/examples/data/geojson/photovoltaic.json', format: new ol.format.GeoJSON() }) const clusterSource = new ol.source.Cluster({ source: source, distance: 40, }) const vectorLayer = new ol.layer.Vector({ source: clusterSource, // 聚合样式 style: function (feature) { // 点的个数 const size = feature.get('features').length return new ol.style.Style({ image: new ol.style.Circle({ // 圆形 radius: 15, // 半径 stroke: new ol.style.Stroke({ // 边框 color: '#fff' }), fill: new ol.style.Fill({ // 填充 color: '#3399CC' }) }), text: new ol.style.Text({ // 文字样式 font: '15px sans-serif', text: size.toString(), fill: new ol.style.Fill({ color: '#fff' }) }) }) } }) map.addLayer(vectorLayer); </script> </body> </html>
5. 参考资料
[1]Dynamic clusters (openlayers.org)
[2]OpenLayers v6.15.1 API - Class: Cluster
[3]openlayers学习——9、openlayers聚合效果Cluster_WangConvey的博客-CSDN博客_openlayers 聚合


 本文基于OpenLayers的Cluster API,实现点聚合效果


【推荐】国内首个AI IDE,深度理解中文开发场景,立即下载体验Trae
【推荐】编程新体验,更懂你的AI,立即体验豆包MarsCode编程助手
【推荐】抖音旗下AI助手豆包,你的智能百科全书,全免费不限次数
【推荐】轻量又高性能的 SSH 工具 IShell:AI 加持,快人一步
· Manus爆火,是硬核还是营销?
· 终于写完轮子一部分:tcp代理 了,记录一下
· 别再用vector<bool>了!Google高级工程师:这可能是STL最大的设计失误
· 单元测试从入门到精通
· 震惊!C++程序真的从main开始吗?99%的程序员都答错了