
基于PostGIS使用GeoServer发布数据量大的GPS轨迹路线图
 本文讲述了基于PostGIS使用GeoServer发布大量GPS轨迹路线的地图服务并使用OpenLayers加载服务
1. 引言
人类在行走或者驾驶过程中产生的GPS轨迹,是道路的一种采样,根据GPS轨迹路线,我们可以推知道路的存在,根据轨迹的密度,可以推知道路的热度以及重要性。如何才能在地图中显示大量的轨迹,这是一个值得思考的问题。诚然,可以直接加载原始轨迹数据,但是这会造成极大的网络压力。地图切片技术可以有效地解决这一问题,GIS服务器在一定比例下对地图进行切片,然后返回给客户端需要的部分,这对于地图底图(比如遥感影像)有着不错的效果
更详细的信息可参考:地图切片的原理、基于地图切片WebGIS原理及其优缺点、发布地图服务时缓存切片设置_CassyChu的博客-CSDN博客_地图切片的原理
这里,笔者使用装载PostGIS插件的PostgreSQL存储GPS轨迹矢量数据,然后使用GeoServer发布WMS地图服务,最后使用OpenLayers可视化结果
2. 环境准备
GeoServer的Windows版本安装极为简单,直接去官网GeoServer下载下来,运行start.bat脚本即可,管理员初始账户为admin,密码为geoserver
PostgreSQL+PostGIS安装可参考:PostgreSQL+PostGIS安装教程_Oruizn的博客-CSDN博客_postgresql安装postgis
- 作为实验,也可使用docker直接pull一个安装好PostgreSQL+PostGIS的镜像
- 数据库安装好后可使用数据库管理软件(如dbeaver、navicat)测试连接,并创建一个新的数据库(笔者这里创建
travel-map)
GPS数据的获取可参考:GPS地图生成03之数据获取 - 当时明月在曾照彩云归 - 博客园 (cnblogs.com)
笔者这里使用Python对数据库进行操作,Python版本为3.6(3以上即可),使用到的库有:
- ppygis3
- psycopg2
可使用pip安装:
pip install psycopg2 ppygis3
3. 数据上传至数据库
这里笔者使用的从网站获取的原始JSON数据
获取文件夹下的JSON数据文件:
import os file = os.listdir('./trackdata/origin/') trip_files = [] for trip_file in file: if trip_file.startswith('trackjson'): trip_files.append(trip_file) # print(trip_files)
连接数据库,创建游标:
import psycopg2 from ppygis3 import Point, LineString, Geometry # Connect to an existing spatially enabled database connection = psycopg2.connect(database="travel-map", user="admin", password="root", host="127.0.0.1", port="5432") cursor = connection.cursor()
- 注意:请修改为你的数据库配置
创建表:
cursor.execute('CREATE TABLE IF NOT EXISTS gps_track(tid INT PRIMARY KEY, geometry GEOMETRY)')
数据上载至数据库:
import json dir = './trackdata/origin/' for file in trip_files: trackjson = json.loads(open(dir+file, 'r').read()) tmp = [] for track in trackjson: tmp.append(Point(track[2],track[1],track[3])) geometry = LineString(tmp) cursor.execute('INSERT INTO gps_track VALUES(%s,%s)', (int(file[9:][:-5]),geometry)) connection.commit()
更新空间坐标系:
cursor.execute('update gps_track set geometry = ST_SetSRID(geometry,4326)')
查询是否上传成功:
# Retrieve the table contents and print it cursor.execute('SELECT * FROM gps_track') for row in cursor: print(row[0])
关闭连接:
# Disconnect from the database cursor.close() connection.close()
完整代码如下:
import os file = os.listdir('./trackdata/origin/') trip_files = [] for trip_file in file: if trip_file.startswith('trackjson'): trip_files.append(trip_file) # print(trip_files) trip_files.__len__() import psycopg2 from ppygis3 import Point, LineString, Geometry # Connect to an existing spatially enabled database connection = psycopg2.connect(database="travel-map", user="admin", password="root", host="127.0.0.1", port="5432") cursor = connection.cursor() cursor.execute('CREATE TABLE IF NOT EXISTS gps_track(tid INT PRIMARY KEY, geometry GEOMETRY)') import json dir = './trackdata/origin/' for file in trip_files: trackjson = json.loads(open(dir+file, 'r').read()) tmp = [] for track in trackjson: tmp.append(Point(track[2],track[1],track[3])) geometry = LineString(tmp) cursor.execute('INSERT INTO gps_track VALUES(%s,%s)', (int(file[9:][:-5]),geometry)) connection.commit() # update gps_track set geometry = ST_SetSRID(geometry,3857) # DROP TABLE IF EXISTS gps_track cursor.execute('update gps_track set geometry = ST_SetSRID(geometry,4326)') # Retrieve the table contents and print it cursor.execute('SELECT * FROM gps_track') for row in cursor: print(row[0]) # Disconnect from the database cursor.close() connection.close()
4. GeoServer连接数据库并发布服务
GeoServer的地图发布参考:
- GeoServer速成:安装启动,发布地图,加载QGIS - 知乎 (zhihu.com)
- GeoServer在Linux上源码安装、启动、发布地图服务 - 当时明月在曾照彩云归 - 博客园 (cnblogs.com)
这里笔者直接添加数据源:
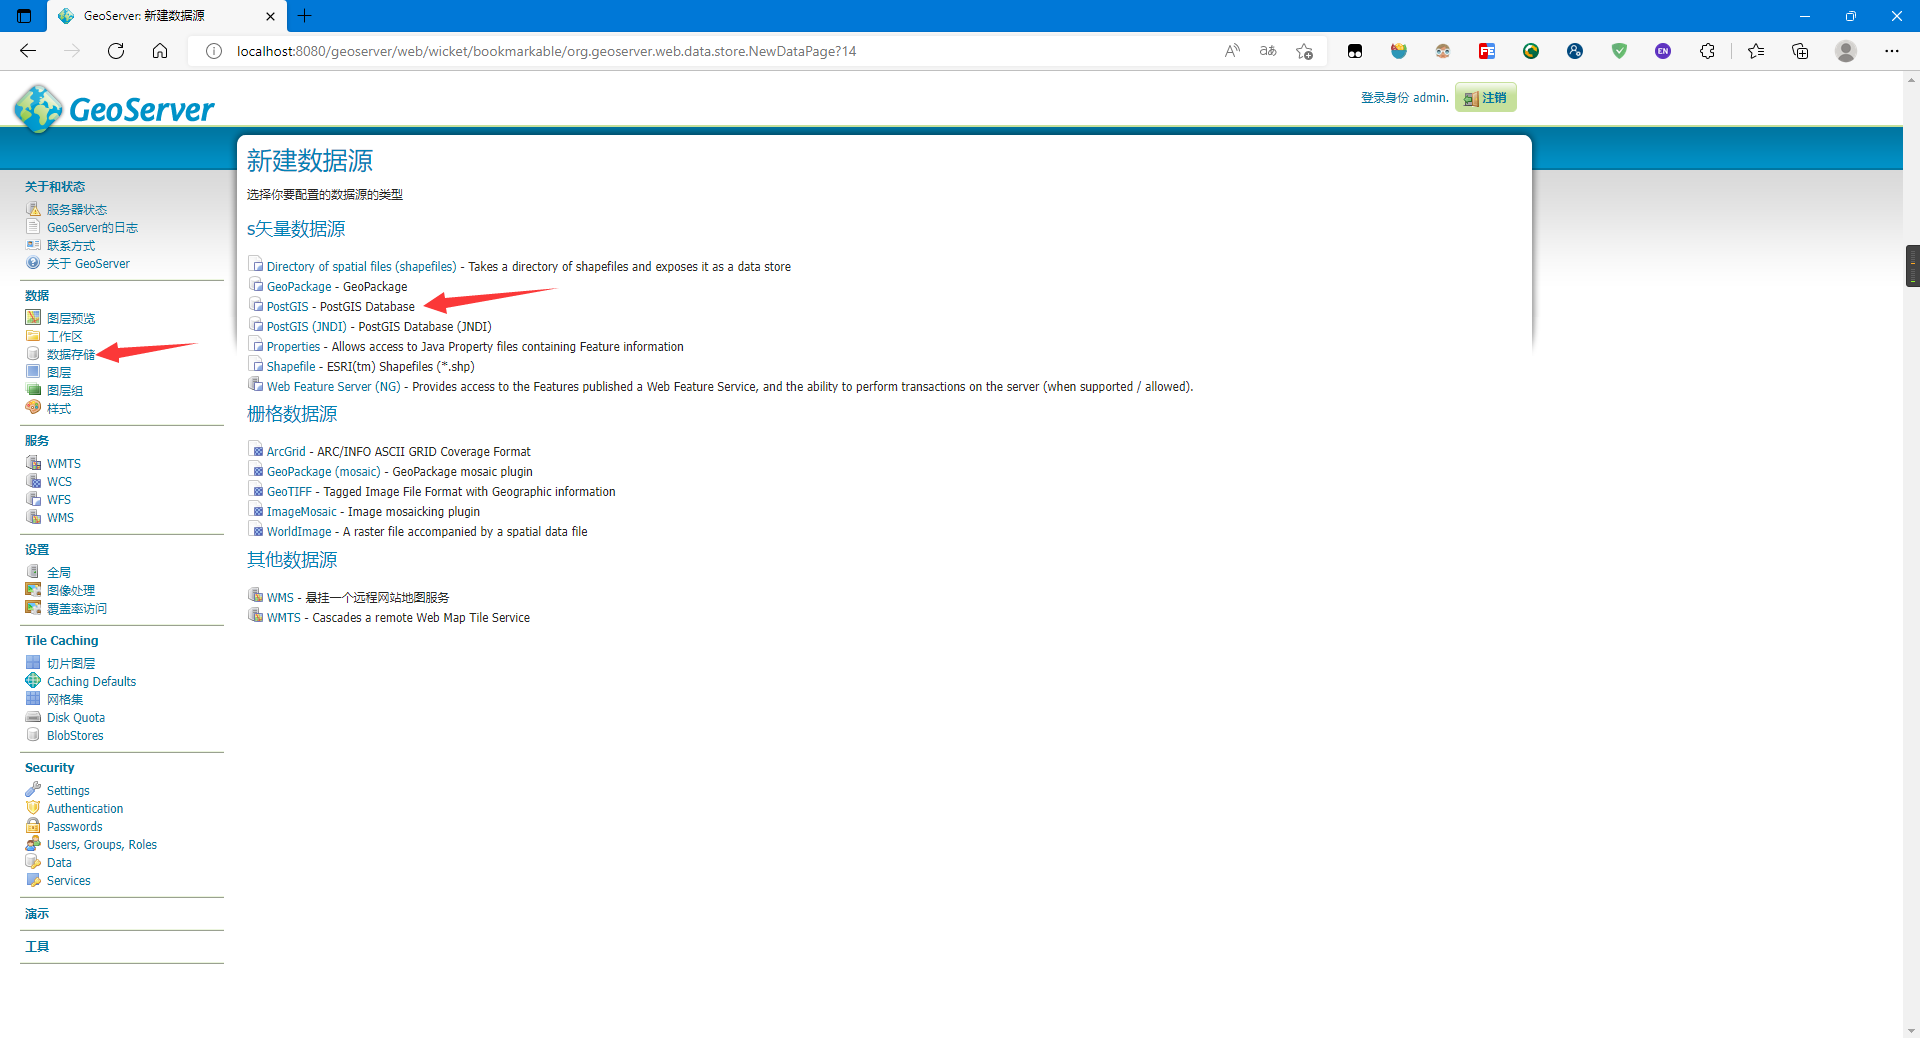
设置好参数,尤其是连接参数:

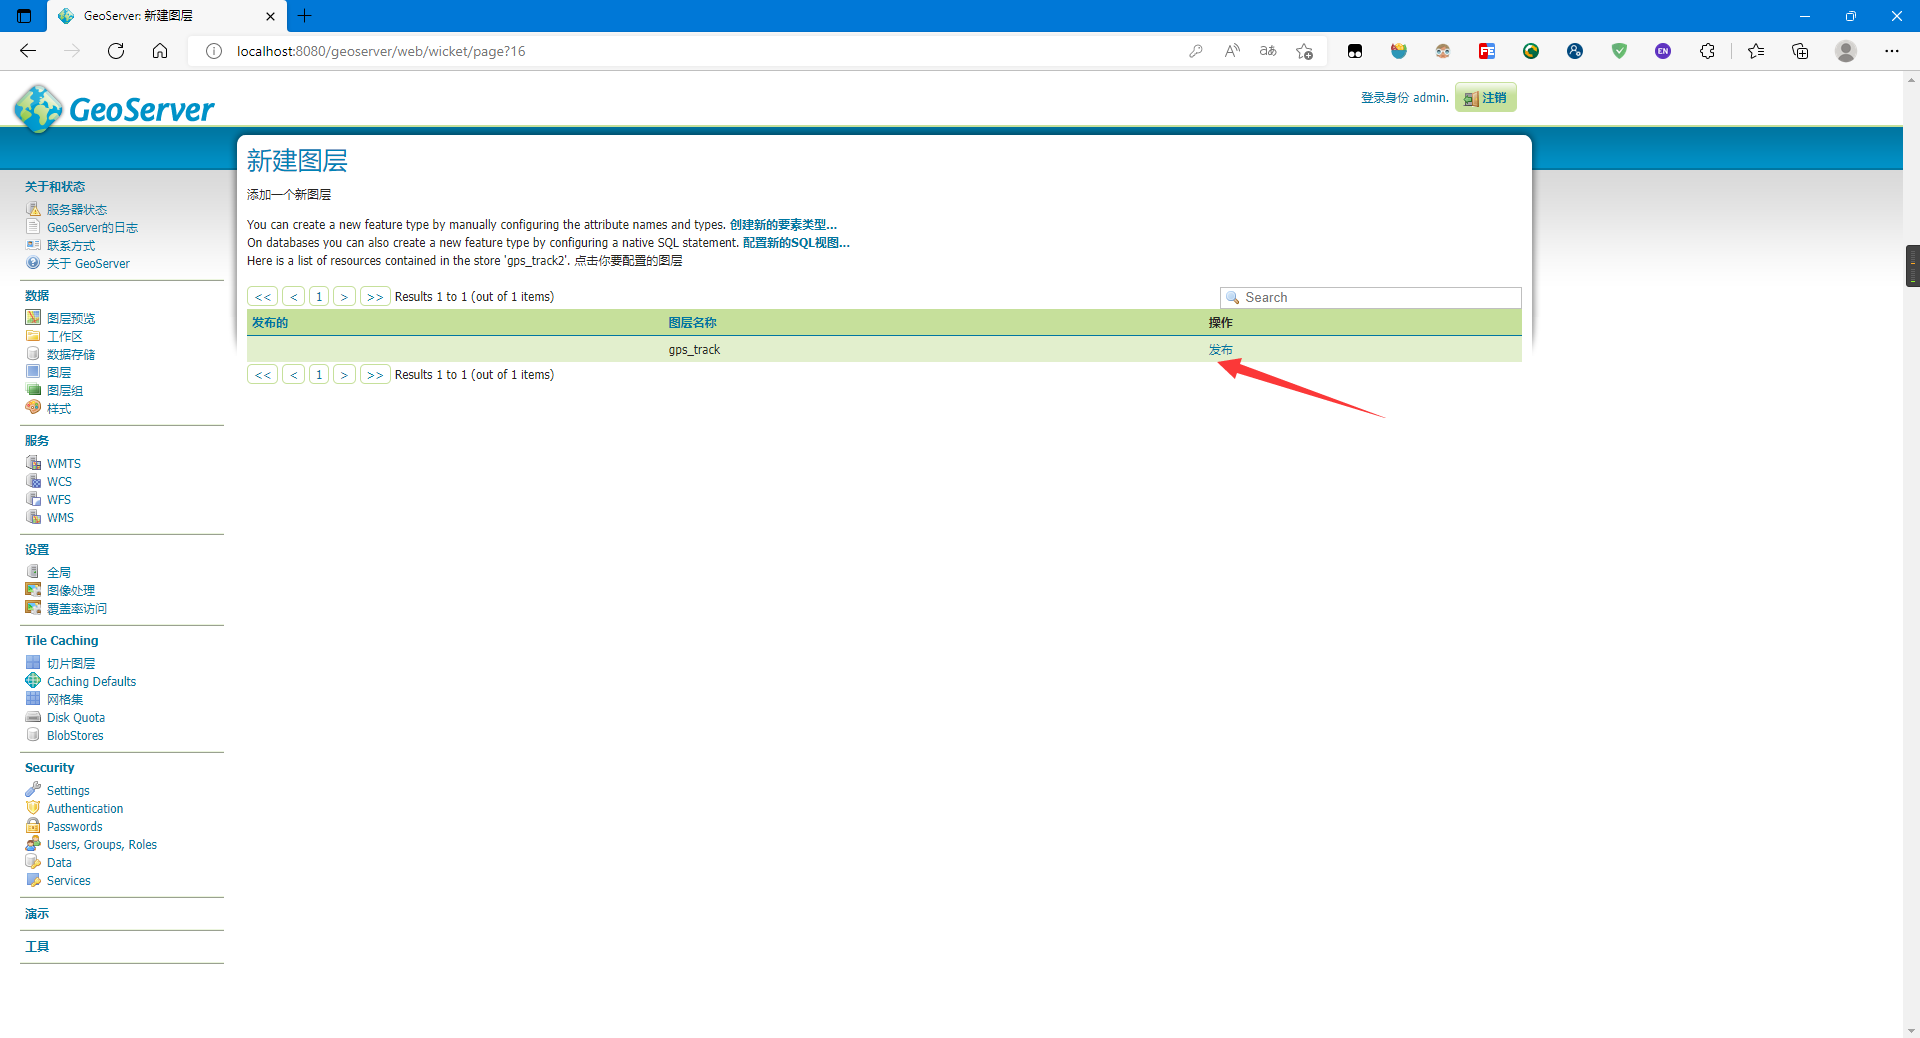
顺利的话点击保存进入发布界面:
设置发布地图的参数,主要是坐标系与范围:
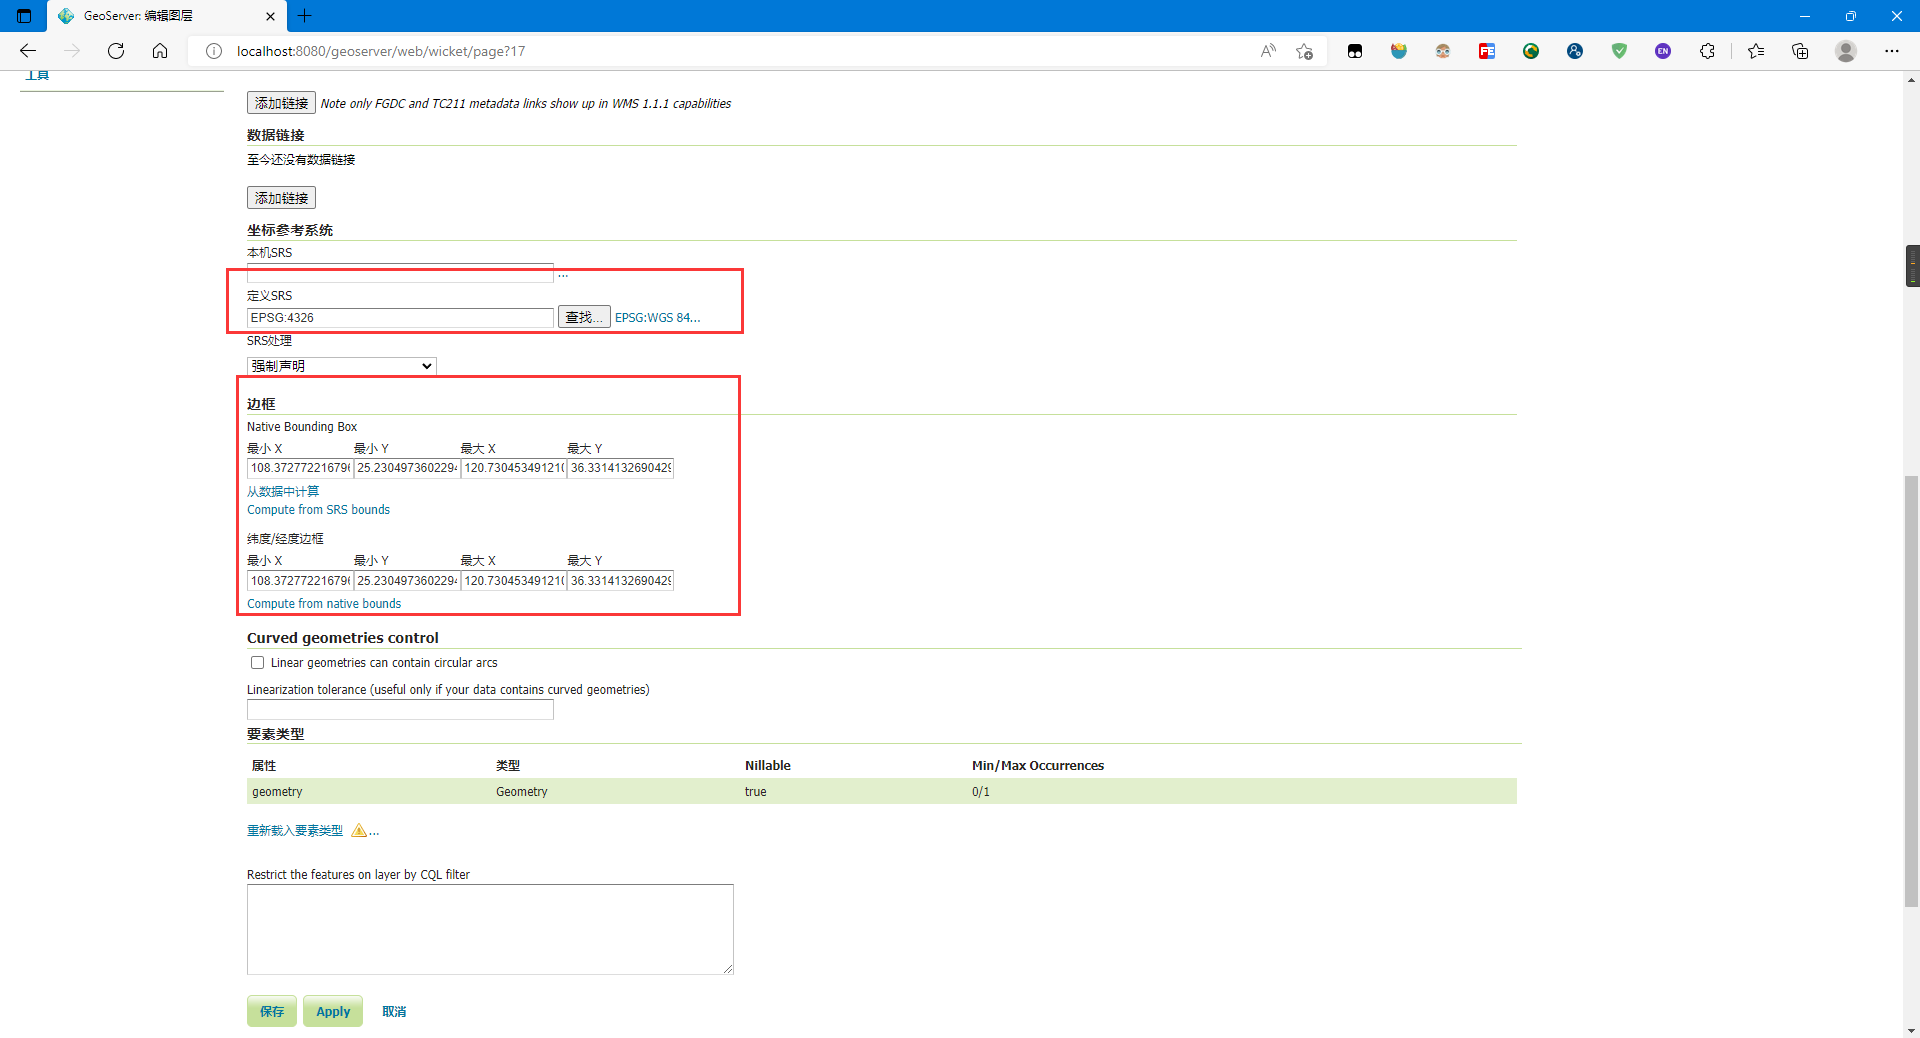
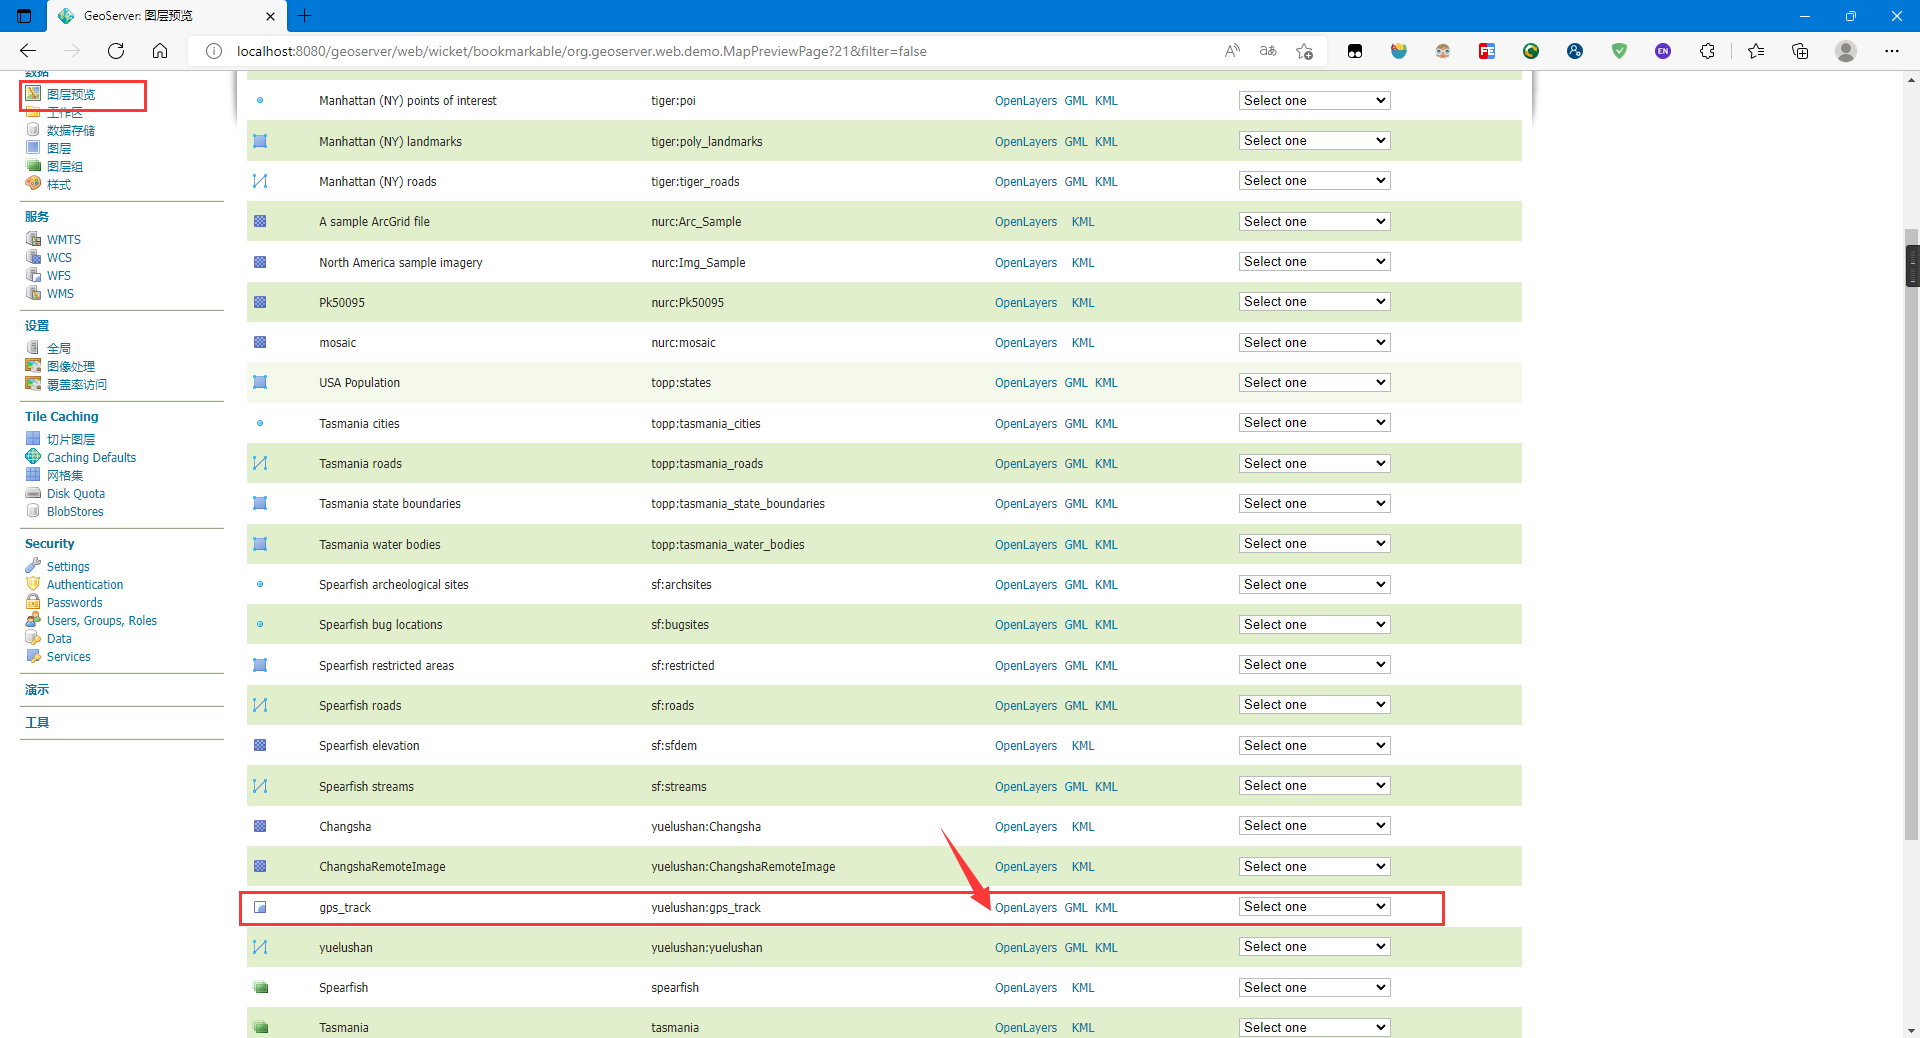
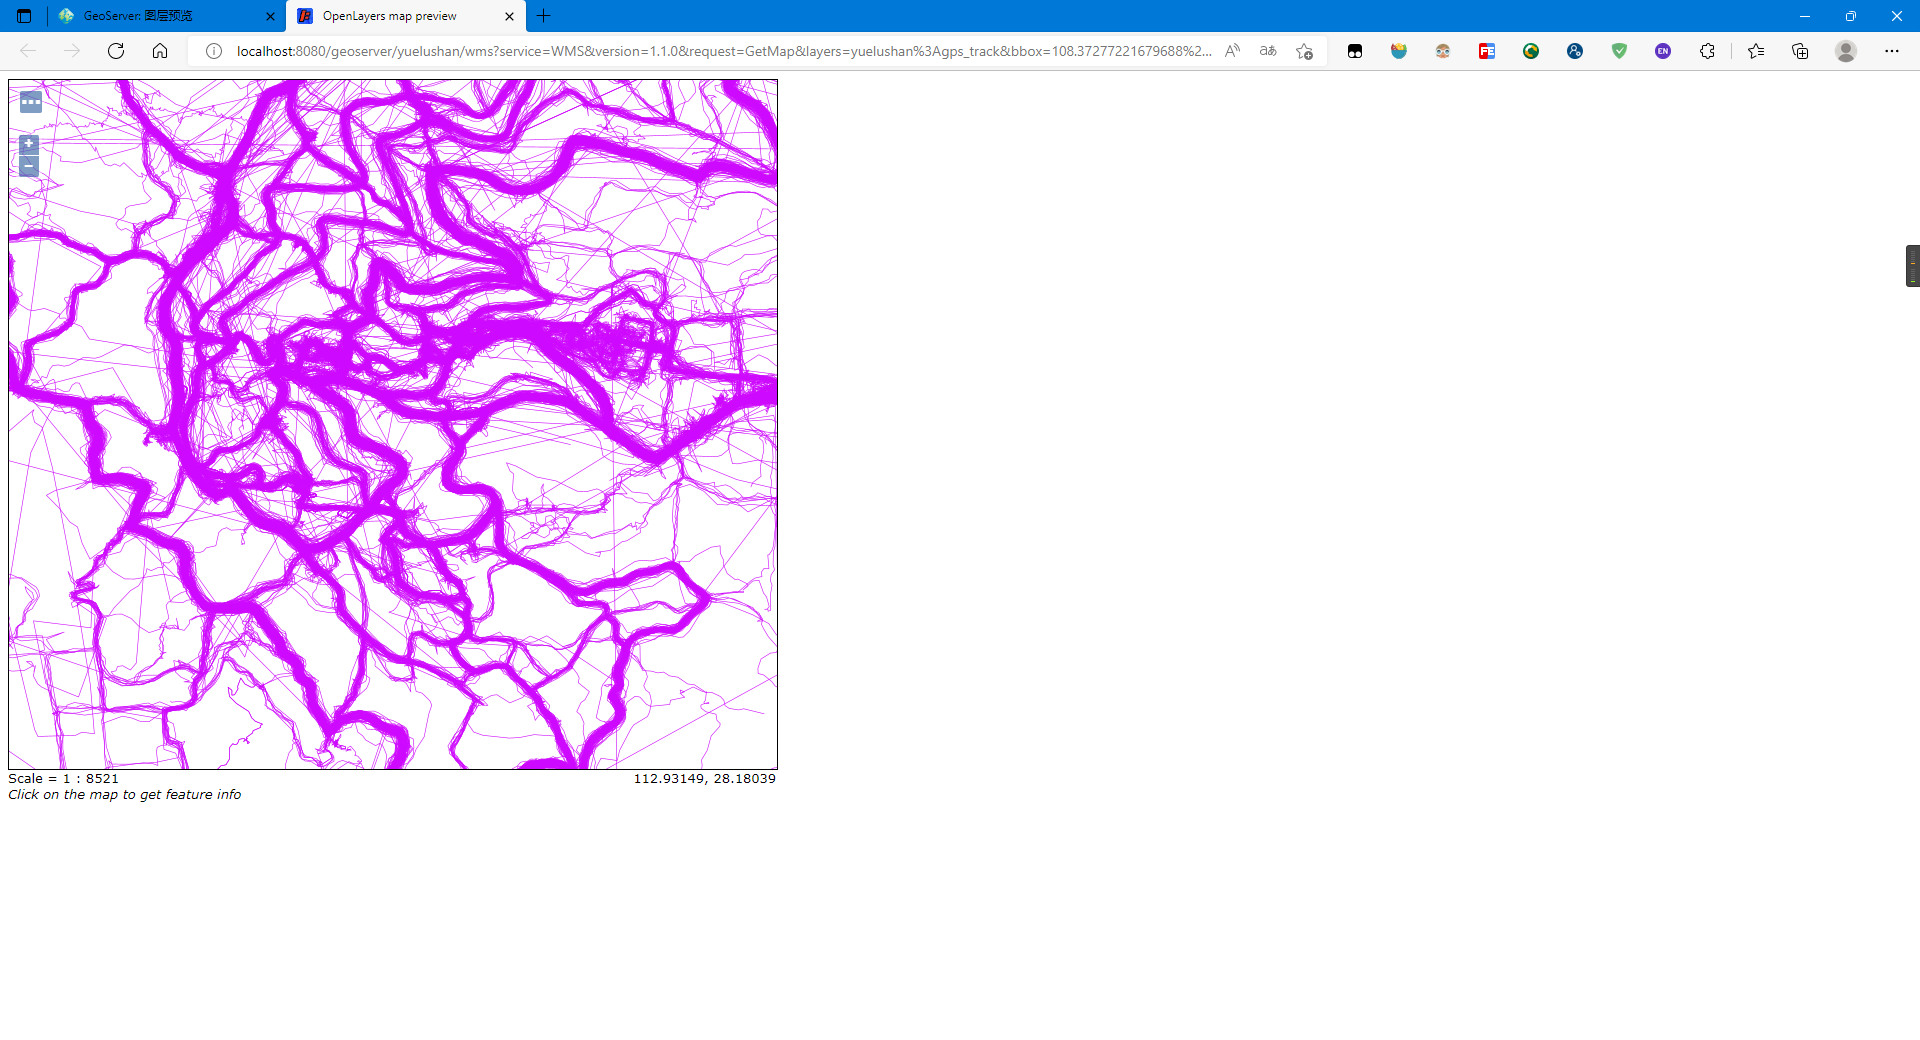
点击保存,可点击图层预览预览刚才上传的数据:
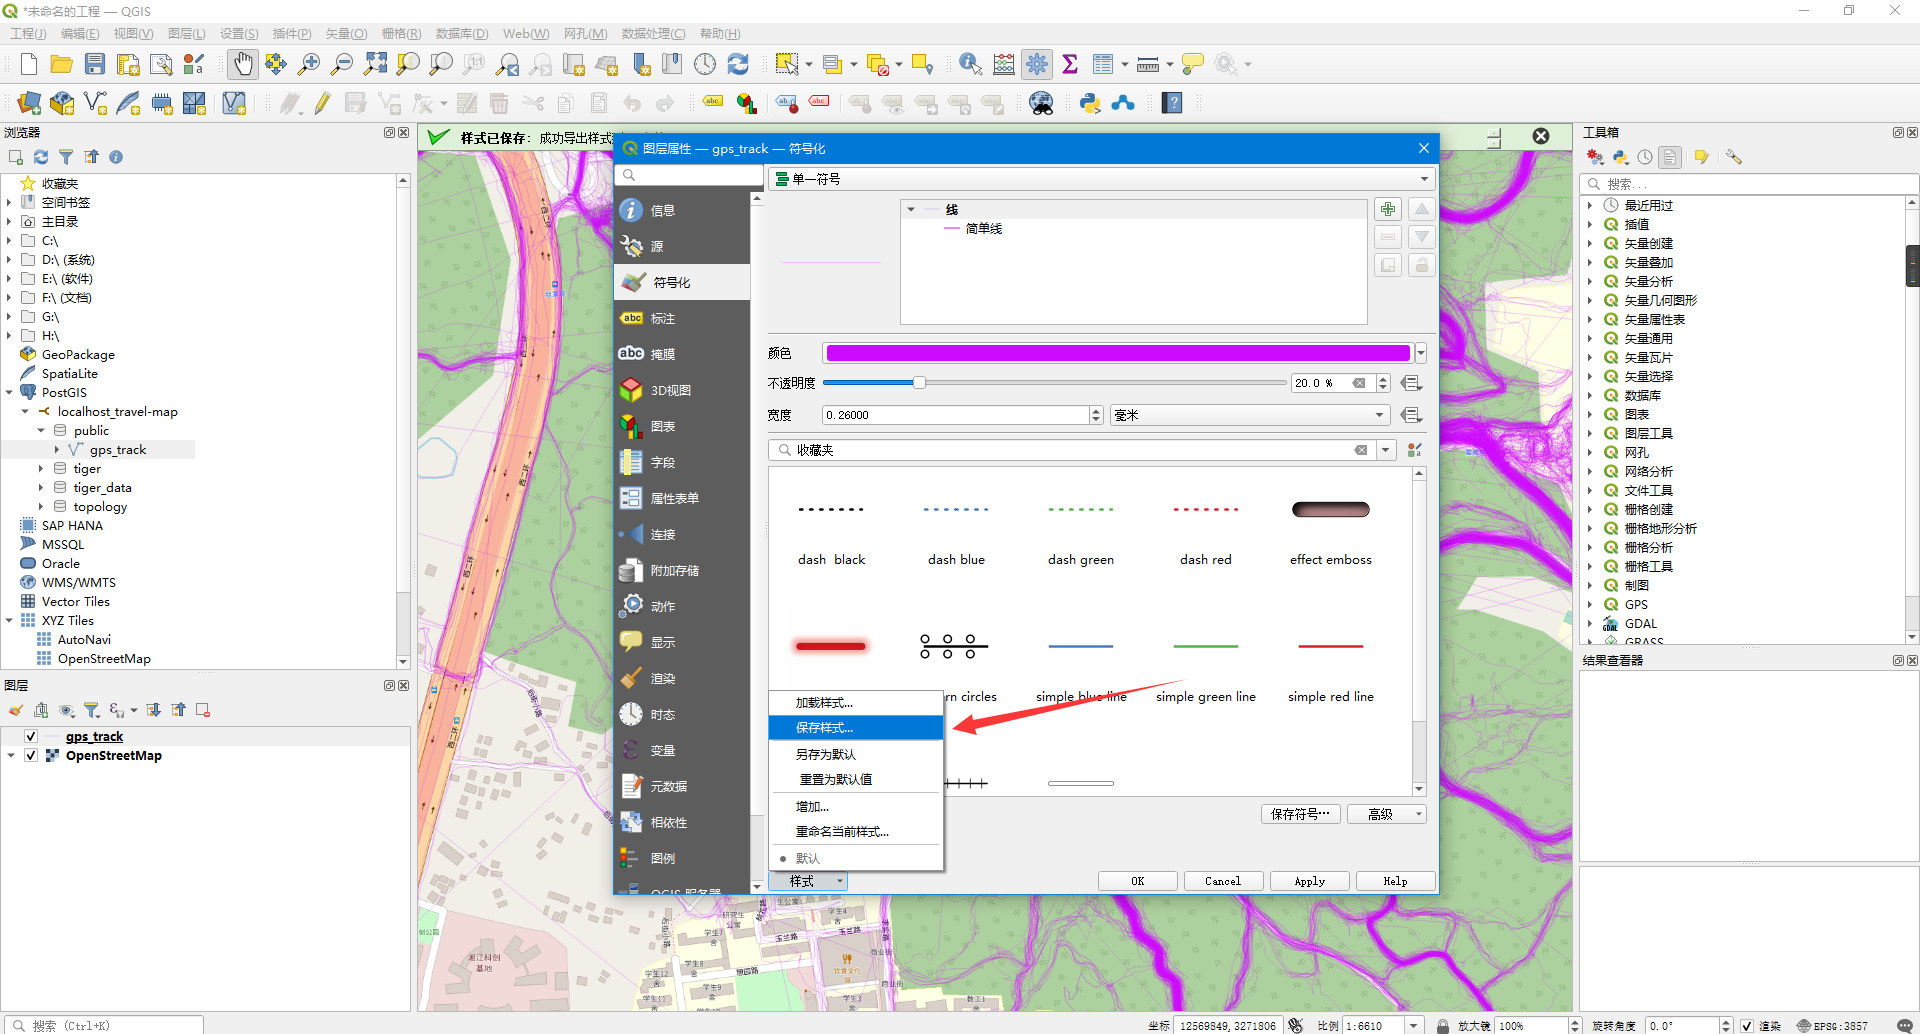
以下是设置地图样式的步骤
这里笔者使用QGIS设置样式并导出SLD样式:
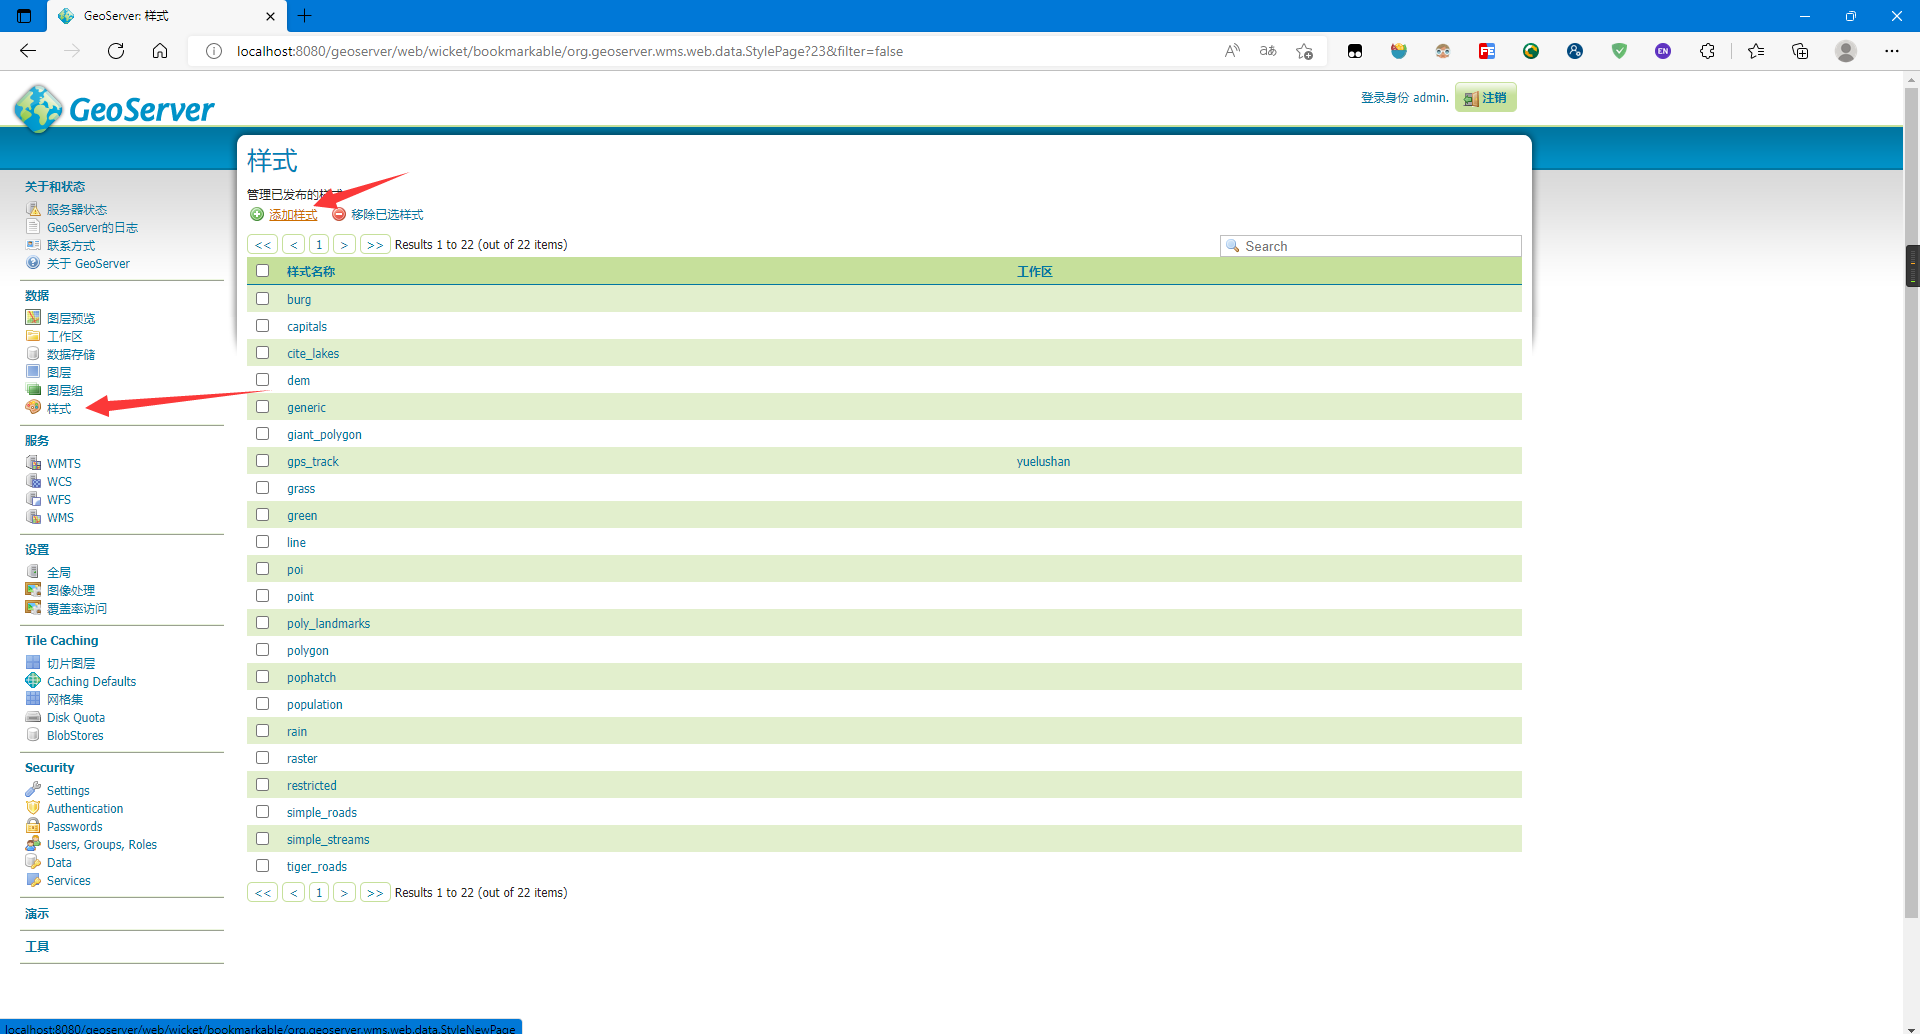
点击样式,添加样式:
设置参数,上传SLD文件,并点击upload:
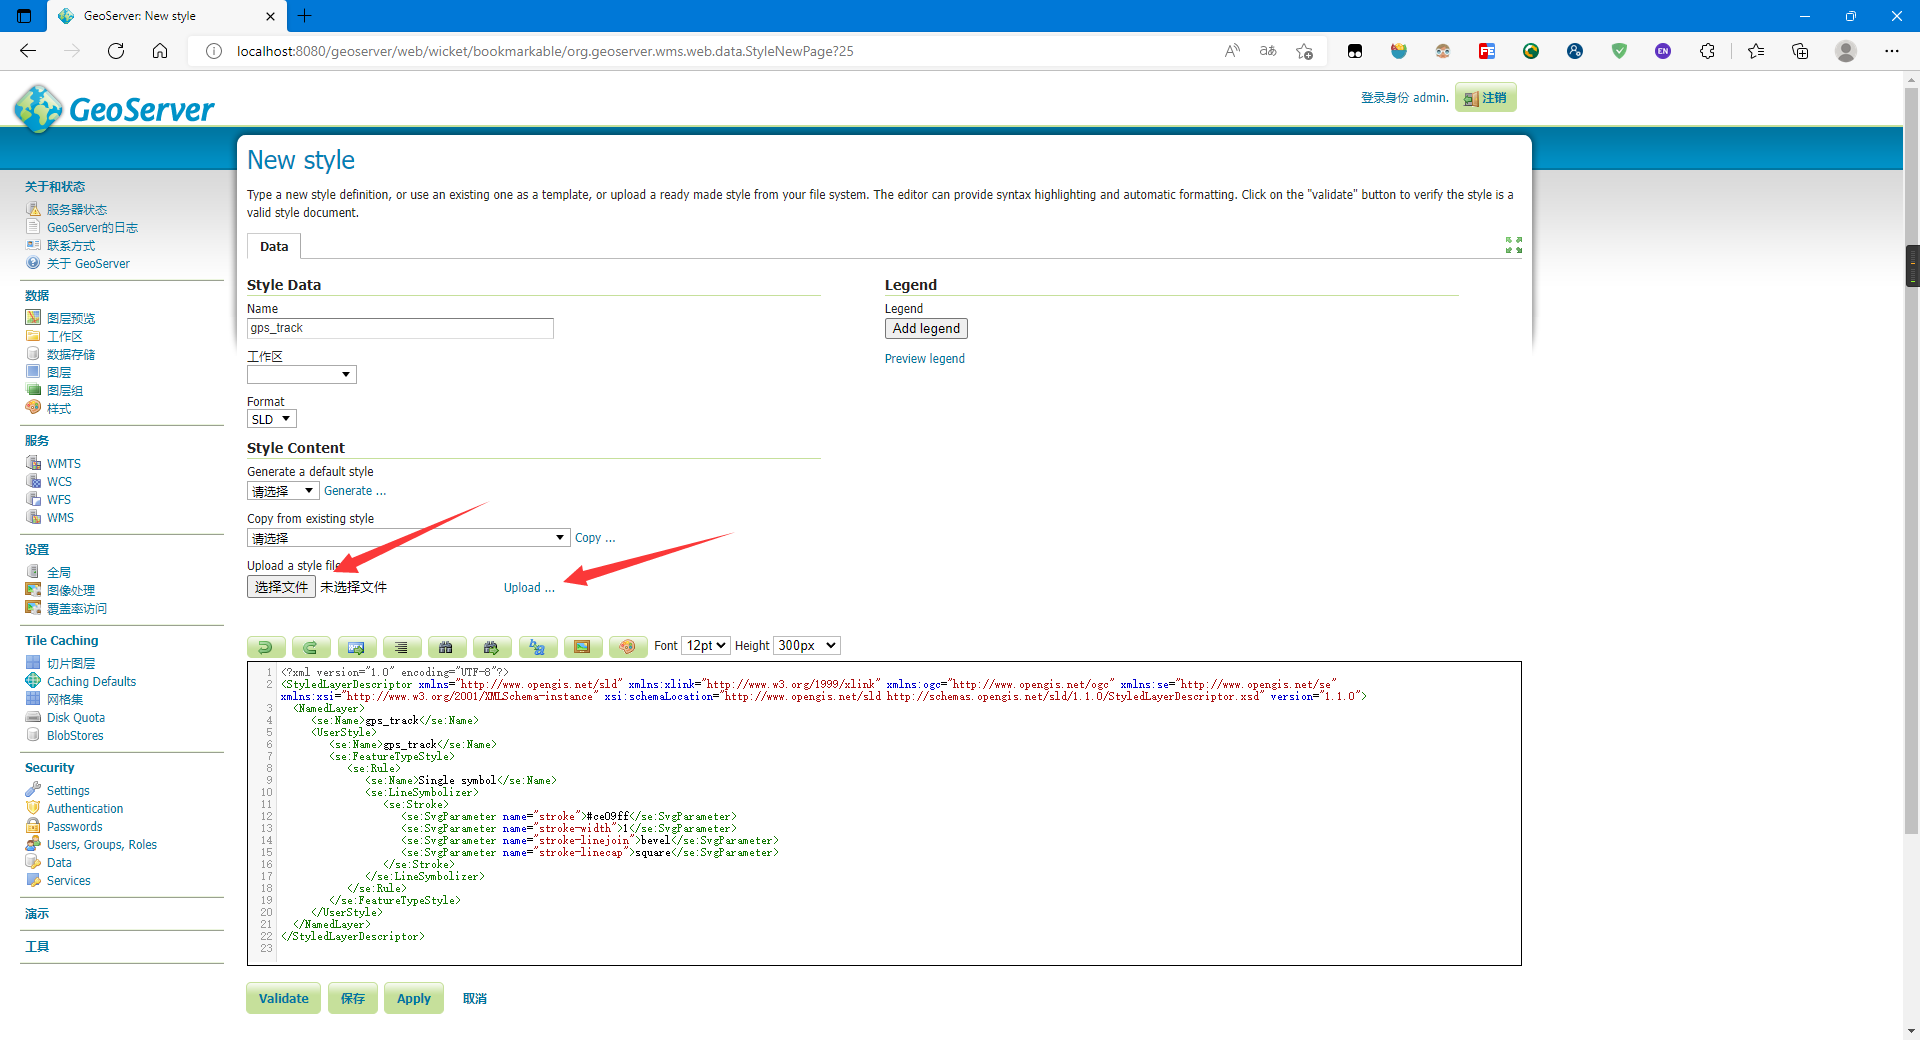
- upload后文本框内会出现相应的文本代码
点击验证与保存
点击图层选择你的图层并点击发布设置样式:
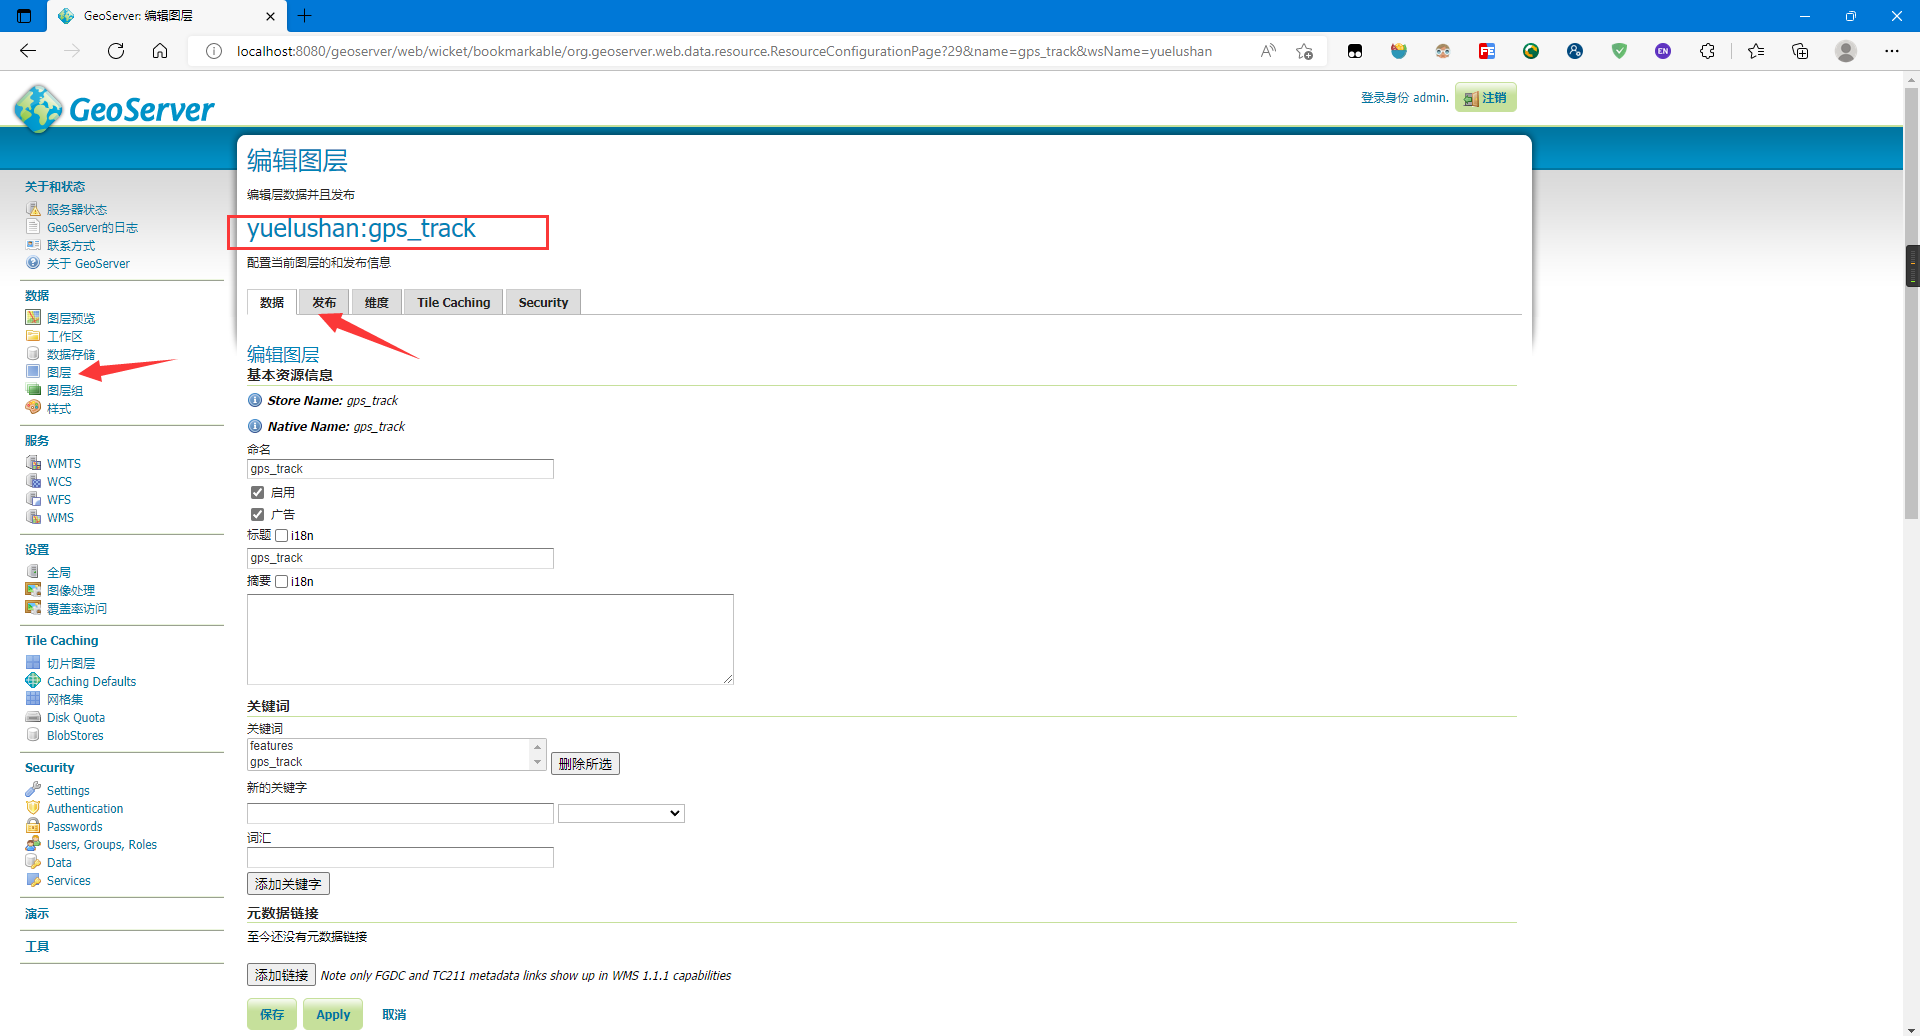
设置你创建的样式为默认样式并保存:
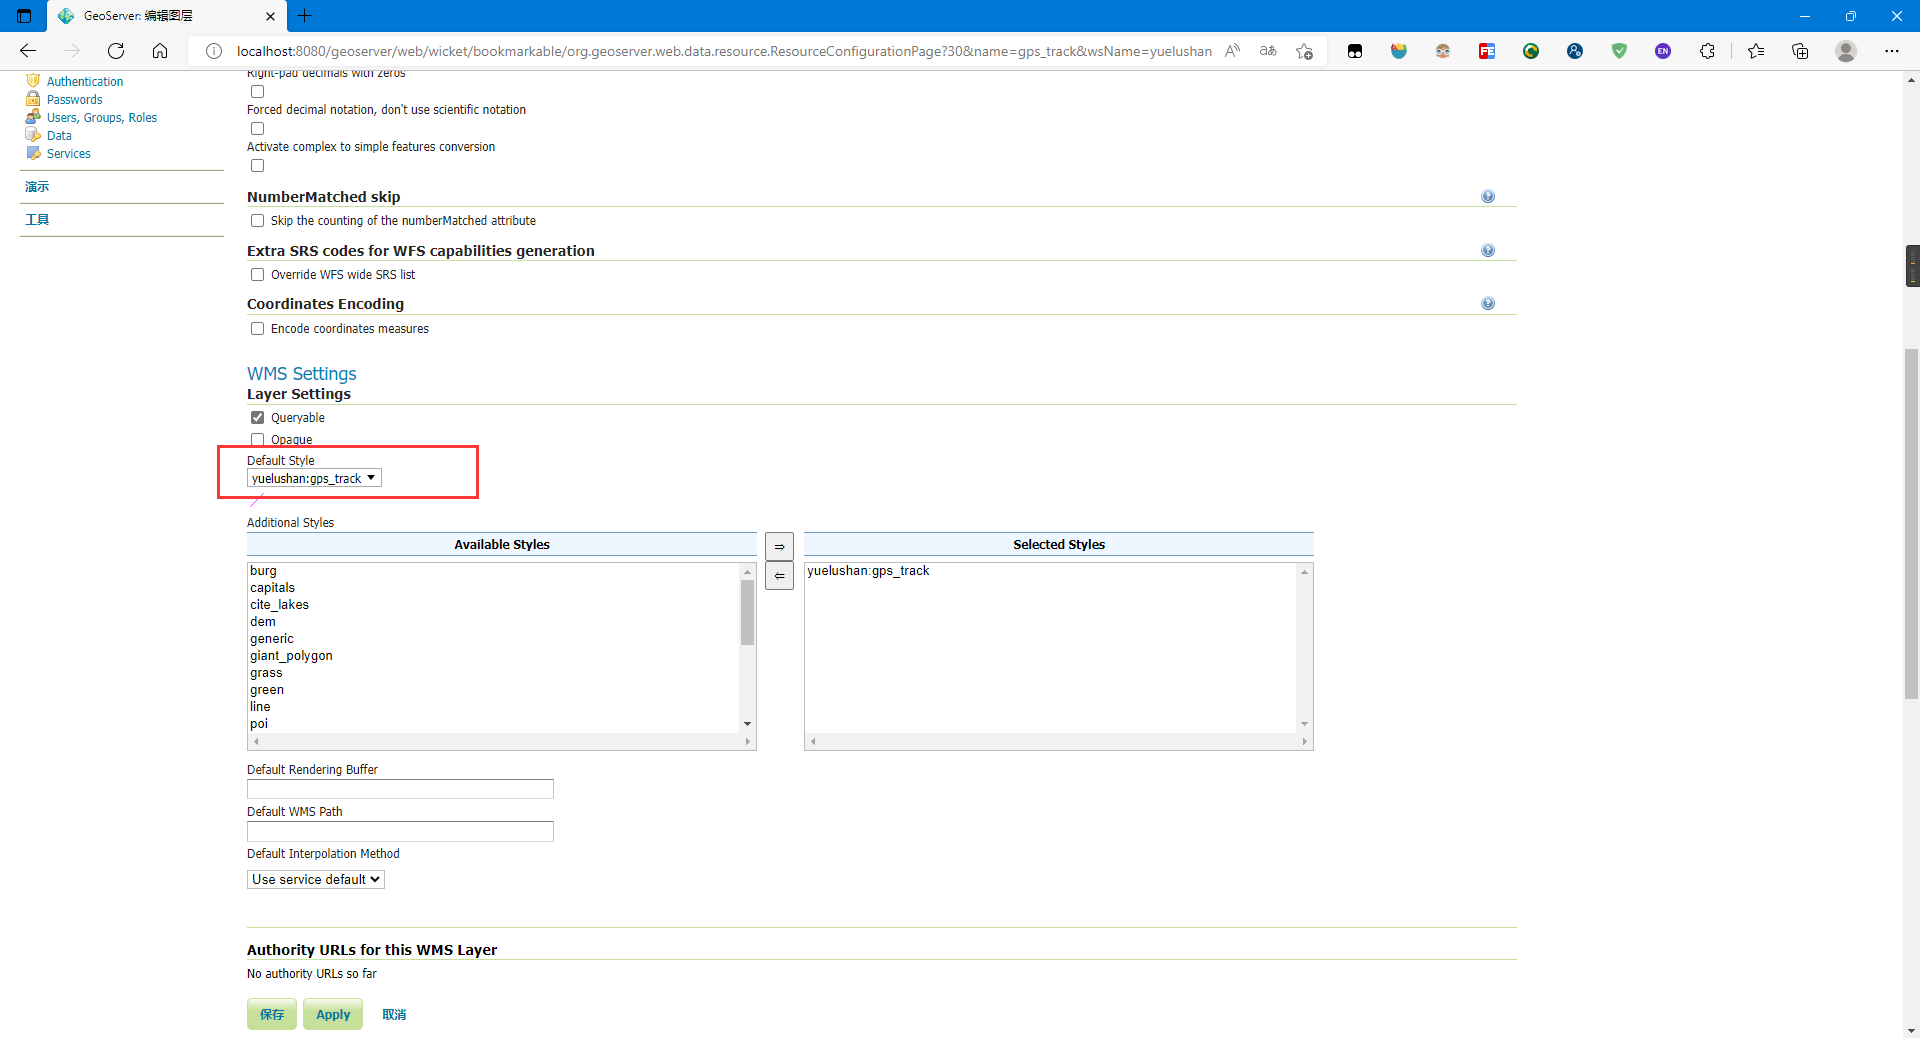
再次预览,可以发现样式已经更改:
5. 使用OpenLayers调用地图服务
其实刚才的预览就已经是使用OpenLayers调用地图服务
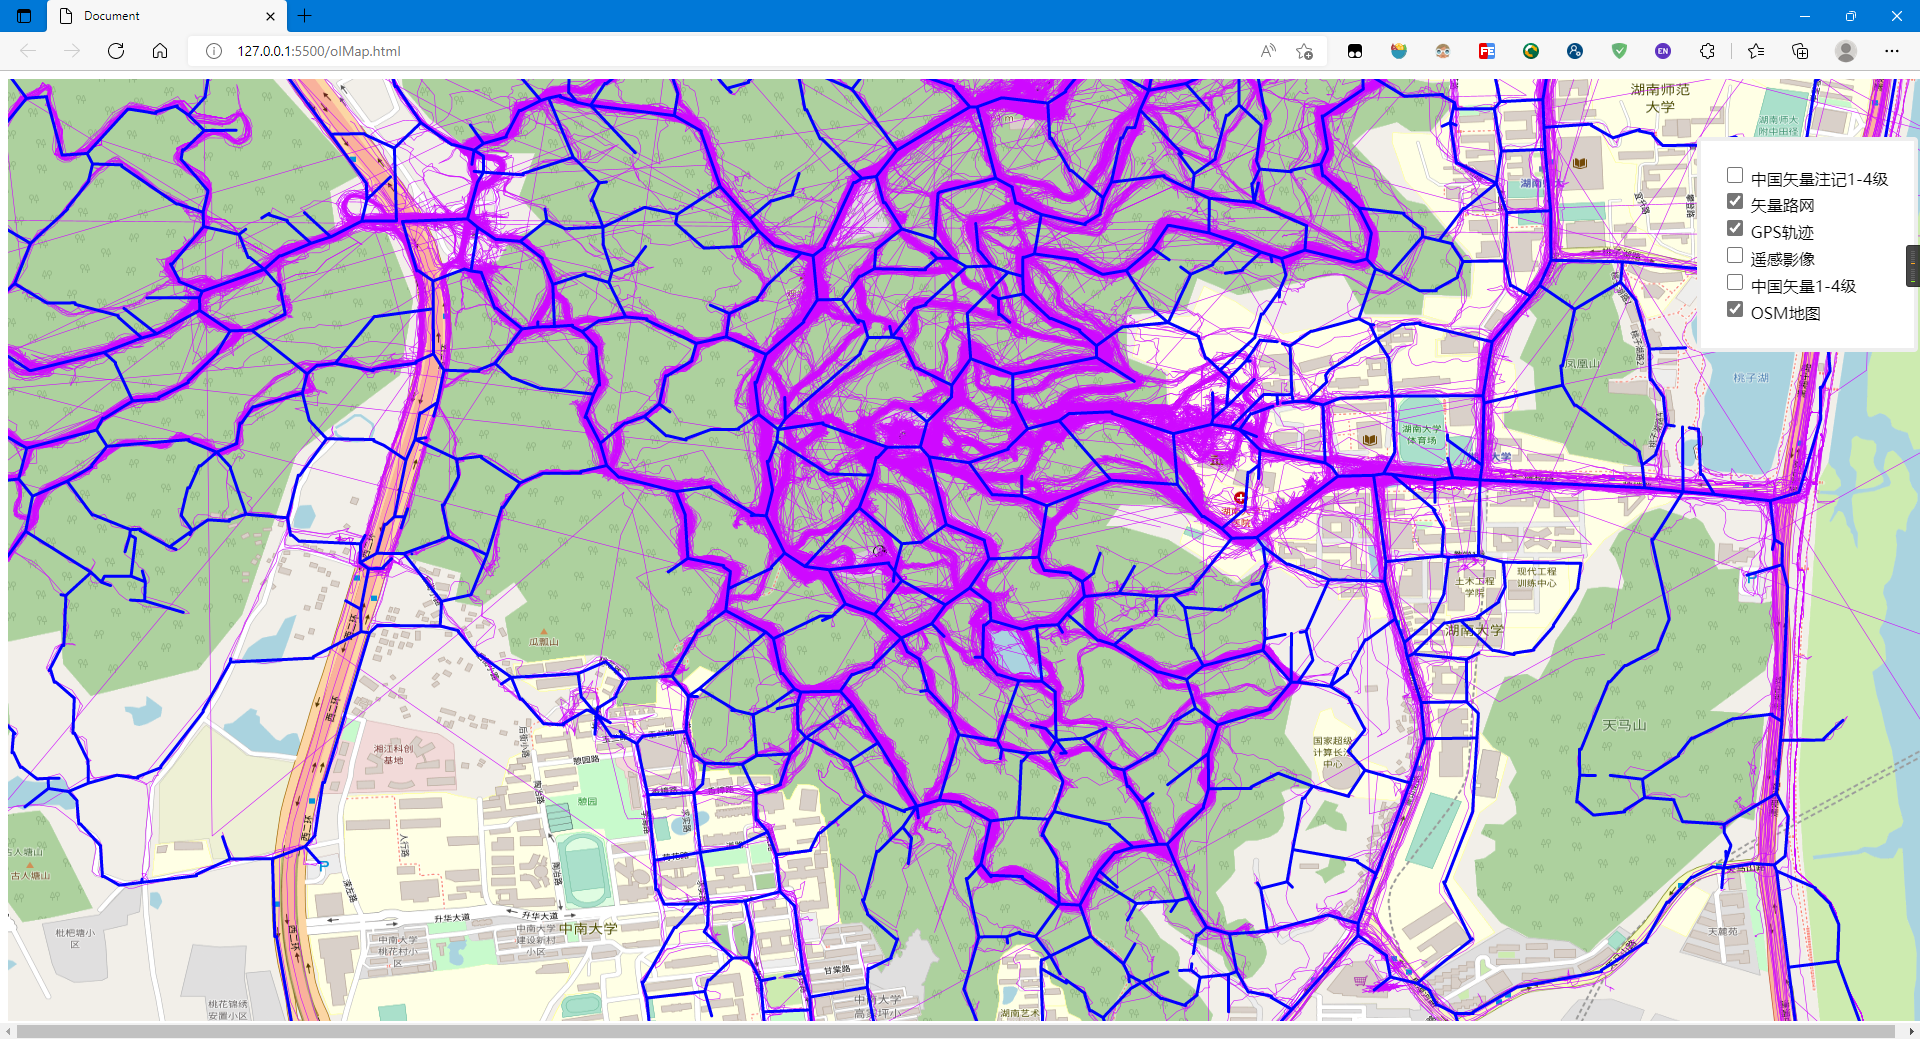
这里笔者主要是使用OpenLayer的图层控制插件ol-layerswitcher: walkermatt/ol-layerswitcher: Layer control for OpenLayers (github.com) 来加载与控制影像地图、轨迹地图与矢量路网等
加载OpenLayer与ol-layerswitcher的CDN:
<script src="https://cdnjs.cloudflare.com/ajax/libs/openlayers/4.6.5/ol.js"></script> <script src="https://unpkg.com/ol-layerswitcher@3.8.3"></script> <link rel="stylesheet" href="https://unpkg.com/ol-layerswitcher@3.8.3/dist/ol-layerswitcher.css" /> <link rel="stylesheet" href="https://cdnjs.cloudflare.com/ajax/libs/openlayers/4.6.5/ol.css">
加载GPS轨迹地图:
new ol.layer.Tile({ title: 'GPS轨迹', source: new ol.source.TileWMS({ url: 'http://localhost:8080/geoserver/yuelushan/wms', params: { 'LAYERS': 'yuelushan:gps_track' } }) }),
添加图层控制控件:
const layerSwitcher = new LayerSwitcher({ reverse: true, groupSelectStyle: 'group' }); olMap.addControl(layerSwitcher);
- 图层名为加载图层时的title
完整代码如下:
<!DOCTYPE html> <html lang="zh"> <head> <meta charset="UTF-8"> <meta http-equiv="X-UA-Compatible" content="IE=edge"> <meta name="viewport" content="width=device-width, initial-scale=1.0"> <title>Document</title> <script src="https://cdnjs.cloudflare.com/ajax/libs/openlayers/4.6.5/ol.js"></script> <script src="https://unpkg.com/ol-layerswitcher@3.8.3"></script> <link rel="stylesheet" href="https://unpkg.com/ol-layerswitcher@3.8.3/dist/ol-layerswitcher.css" /> <link rel="stylesheet" href="https://cdnjs.cloudflare.com/ajax/libs/openlayers/4.6.5/ol.css"> <style> #olmap { width: 100%; height: 99%; position: absolute; } #menu { position: absolute; top: 30px; left: 20px; z-index: 11; } </style> </head> <body> <body> <div id="olmap"></div> <script type="text/javascript"> var projection = ol.proj.get("EPSG:4326"); var projectionExtent = projection.getExtent(); var size = ol.extent.getWidth(projectionExtent) / 256; var resolutions = []; for (var z = 2; z < 19; ++z) { resolutions[z] = size / Math.pow(2, z); } var vectorSource = new ol.source.Vector({ url: "./final_map.json", format: new ol.format.GeoJSON() }) var olMap = new ol.Map({ target: "olmap", layers: [ new ol.layer.Tile({ title: "OSM地图", source: new ol.source.XYZ({ url: 'http://{a-c}.tile.openstreetmap.org/{z}/{x}/{y}.png' }) }), new ol.layer.Tile({ title: "中国矢量1-4级", source: new ol.source.WMTS({ url: "http://t{0-6}.tianditu.gov.cn/vec_c/wmts?tk=1d109683f4d84198e37a38c442d68311", name: "中国矢量1-4级", layer: "vec", style: "default", matrixSet: "c", format: "tiles", wrapX: true, tileGrid: new ol.tilegrid.WMTS({ origin: ol.extent.getTopLeft(projectionExtent), resolutions: resolutions, matrixIds: [0, 1, 2, 3, 4, 5, 6, 7, 8, 9, 10, 11, 12, 13, 14] }) }), }), new ol.layer.Tile({ title: '遥感影像', source: new ol.source.BingMaps({ key: "ApTJzdkyN1DdFKkRAE6QIDtzihNaf6IWJsT-nQ_2eMoO4PN__0Tzhl2-WgJtXFSp", imagerySet: 'Aerial', }), }), new ol.layer.Tile({ title: 'GPS轨迹', source: new ol.source.TileWMS({ url: 'http://localhost:8080/geoserver/yuelushan/wms', params: { 'LAYERS': 'yuelushan:gps_track' } }) }), new ol.layer.Vector({ title: "矢量路网", source: vectorSource, style: new ol.style.Style({ // stroke: new ol.style.Stroke({ // color: 'rgba(0,255,0,0.8)', // width: 4, // }), stroke: new ol.style.Stroke({ color: '#0000ff',//颜色 width: 3,//宽度 lineCap: 'round',//线帽样式 //butt:末端添加平直边缘;round:末端添加圆形线帽;square:末端添加方形线帽; lineJoin: 'round'//线条连接处样式 //bevel:创建斜角;round:创建圆角;square:创建尖角; }) }), }), new ol.layer.Tile({ title: "中国矢量注记1-4级", source: new ol.source.WMTS({ name: "中国矢量注记1-4级", url: "http://t{0-6}.tianditu.gov.cn/cva_c/wmts?tk=1d109683f4d84198e37a38c442d68311", layer: "cva", style: "default", matrixSet: "c", format: "tiles", wrapX: true, tileGrid: new ol.tilegrid.WMTS({ origin: ol.extent.getTopLeft(projectionExtent), resolutions: resolutions, matrixIds: [0, 1, 2, 3, 4, 5, 6, 7, 8, 9, 10, 11, 12, 13, 14] }) }), }), ], view: new ol.View({ // 将长沙作为地图中心 center: [112.92597770690918, 28.186654954789518], projection: 'EPSG:4326', zoom: 14, }), controls: [], }); const layerSwitcher = new LayerSwitcher({ reverse: true, groupSelectStyle: 'group' }); olMap.addControl(layerSwitcher); </script> </body> </html>
使用VS Code的Live Server插件加载网页:


【推荐】国内首个AI IDE,深度理解中文开发场景,立即下载体验Trae
【推荐】编程新体验,更懂你的AI,立即体验豆包MarsCode编程助手
【推荐】抖音旗下AI助手豆包,你的智能百科全书,全免费不限次数
【推荐】轻量又高性能的 SSH 工具 IShell:AI 加持,快人一步
· TypeScript + Deepseek 打造卜卦网站:技术与玄学的结合
· Manus的开源复刻OpenManus初探
· AI 智能体引爆开源社区「GitHub 热点速览」
· 从HTTP原因短语缺失研究HTTP/2和HTTP/3的设计差异
· 三行代码完成国际化适配,妙~啊~