Difference between scipy.fftpack and numpy.fft
scipy.fftpack 和 numpy.fft 的区别
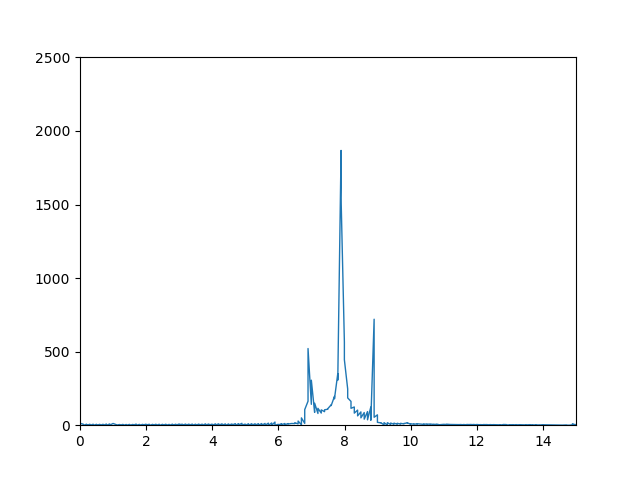
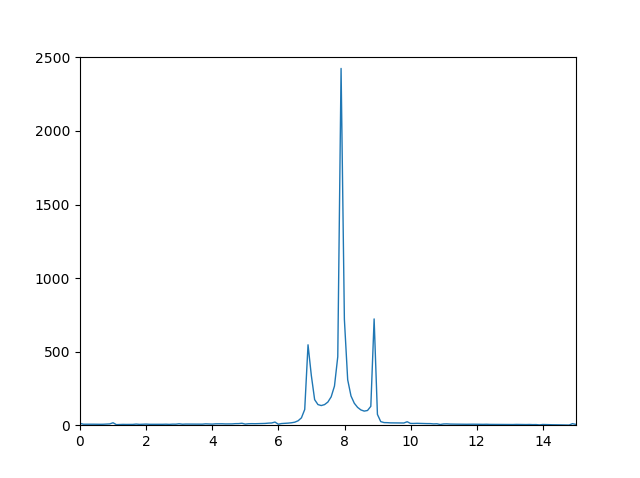
When applying scipy.fftpack.rfft and numpy.fft.rfft I get the following plots respectively:
Scipy:
Numpy:
While the shape of the 2 FFTs are roughly the same with the correct ratios between the peaks, the numpy one looks much smoother, whereas the scipy one has slightly smaller max peaks, and has much more noise.
===========================================================================
From NumPy's doc for rfft:
Returns:
out : complex ndarray
The truncated or zero-padded input, transformed along the axis indicated by axis, or the last one if axis is not specified. If n is even, the length of the transformed axis is (n/2)+1. If n is odd, the length is (n+1)/2.
It is not written explicitly but the "transformed data" is here complex.
From SciPy's doc for rfft
z : real ndarray
The returned real array contains:
[y(0),Re(y(1)),Im(y(1)),...,Re(y(n/2))]              if n is even
[y(0),Re(y(1)),Im(y(1)),...,Re(y(n/2)),Im(y(n/2))]   if n is odd
Conclusion: the storage is different.
For a starter, look at the length of magnitude, it will be different in both cases. I give an example below for clarity:
In [33]: data = np.random.random(size=8)

In [34]: np.fft.rfft(data)
Out[34]:
array([ 3.33822983+0.j        ,  0.15879369+0.48542266j,
        0.00614876+0.03590621j, -0.67376592-0.69793372j,  1.51730861+0.j        ])

In [35]: scipy.fftpack.rfft(data)
Out[35]:
array([ 3.33822983,  0.15879369,  0.48542266,  0.00614876,  0.03590621,
       -0.67376592, -0.69793372,  1.51730861])
The first element in both cases is the so-called "DC component" (the mean of the signal).
Then, you can recognize in the SciPy version the succession of real and imaginary parts of the NumPy version.
欢迎转载,转载请保留页面地址。帮助到你的请点个推荐。


 浙公网安备 33010602011771号