Python FFT (Fast Fourier Transform)
- np.fft.fft
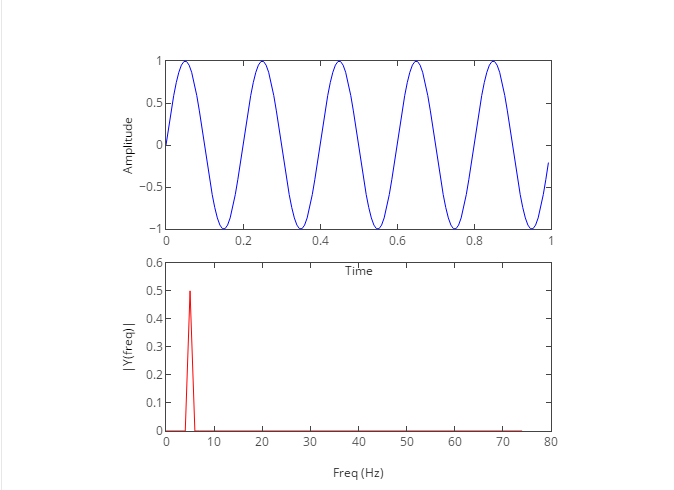
import matplotlib.pyplot as plt
import plotly.plotly as py
import numpy as np
# Learn about API authentication here: https://plot.ly/python/getting-started
# Find your api_key here: https://plot.ly/settings/api

Fs = 150.0;  # sampling rate
Ts = 1.0/Fs; # sampling interval
t = np.arange(0,1,Ts) # time vector

ff = 5;   # frequency of the signal
y = np.sin(2*np.pi*ff*t)

n = len(y) # length of the signal
k = np.arange(n)/n
frq = Fs*k # two sides frequency range
frq = frq[range(n/2)] # one side frequency range

Y = np.fft.fft(y)/n # fft computing and normalization
Y = Y[range(n/2)]

fig, ax = plt.subplots(2, 1)
ax[0].plot(t,y)
ax[0].set_xlabel('Time')
ax[0].set_ylabel('Amplitude')

ax[1].plot(frq,abs(Y),'r') # plotting the spectrum
ax[1].set_xlabel('Freq (Hz)')
ax[1].set_ylabel('|Y(freq)|')
欢迎转载,转载请保留页面地址。帮助到你的请点个推荐。

 浙公网安备 33010602011771号