SpringCloud学习之三:Turbine聚合监控
Turbine聚合监控
Spring Cloud版本:Hoxton.SR5
1. 简介
上一章已经搭建了简单的服务提供者和服务消费者,并且服务消费者集成了断路器Hystrix,并且可通过actuator暴露的/actuator/hystrix.stream端点进行监控。但显示数据为纯文本形式,所以可进行如下优化。
- 使用Hystrix Dashboard进行图形化显示
- 可进行图形化显示,观察方便
- 多个微服务仅能一个一个进行查看
- 同一个微服务有多个实例进行负载均衡时,无法进行汇总查看
- 使用Turbine进行聚合监控
- 可查看整个微服务所有服务的Hystrix情况
- 可将同一微服务的不同实例进行汇总
- 当某些微服务与Turbine网络不通时,则无法进行汇总
- Turbine与微服务耦合度高,当一个微服务改变服务名时,Turbine也需要同步修改
- 使用Turbine+RabbitMQ进行聚合监控
- 具备Turbine监控的所有优点
- 当网络不通时,可将数据上报到RabbitMQ中
- Turbine与微服务进行解耦
根据以上的优化方案,最终形成如下的架构
2. Hystrix Dashboard实现可视化监控
-
创建一个SpringBoot项目,引入如下依赖:
spring-cloud-starter-netflix-eureka-client:进行服务注册spring-cloud-starter-netflix-hystrix-dashboard:可视化监控<dependency> <groupId>org.springframework.cloud</groupId> <artifactId>spring-cloud-starter-netflix-hystrix-dashboard</artifactId> </dependency> <dependency> <groupId>org.springframework.cloud</groupId> <artifactId>spring-cloud-starter-netflix-eureka-client</artifactId> </dependency> -
在启动类上添加
@EnableDiscoveryClient、@EnableHystrixDashboard注解@EnableDiscoveryClient @SpringBootApplication @EnableHystrixDashboard public class SclHystrixDashboardApplication { public static void main(String[] args) { SpringApplication.run(SclHystrixDashboardApplication.class, args); } } -
在配置文件application.yml中添加如下内容
server: port: 8401 spring: application: name: scl-hystrix-dashboard # 服务名称 eureka: client: register-with-eureka: true # 是否注册到服务注册中心 fetch-registry: false # 是否从注册中心抓取信息,若不存在服务调用设置为false即可,反之则设置为true service-url: defaultZone: http://root:123456@test1:8100/eureka-server1/eureka,http://root:123456@test2:8200/eureka-server2/eureka,http://root:123456@test3:8300/eureka-server3/eureka # 服务注册中心地址 -
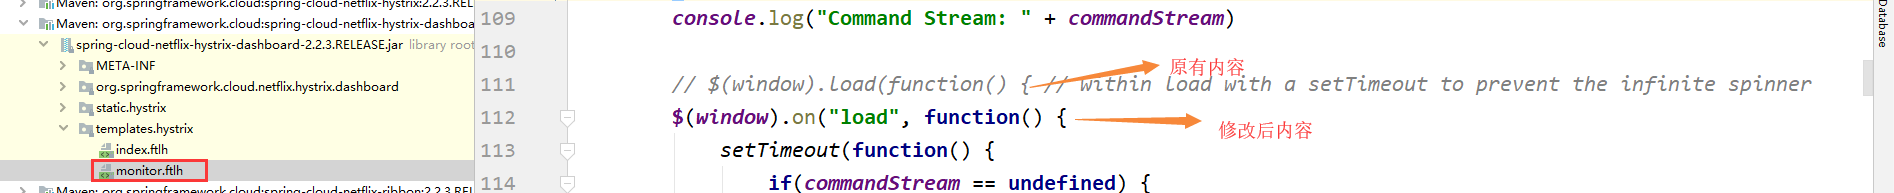
修改源码
- 在maven本地仓库中找到
spring-cloud-netflix-hystrix-dashboard-2.2.3.RELEASE.jar文件 - 用解压缩工具打开jar包,找到
templates.hystrix/monitor.ftlh并打开 - 将文件里所有的
$(window).load(function() {修改为$(window).on("load", function() {,保存即可 - 也可直接解压,然后使用
jar cvf spring-cloud-netflix-hystrix-dashboard-2.2.3.RELEASE.jar *修改后重新打包
- 在maven本地仓库中找到
-
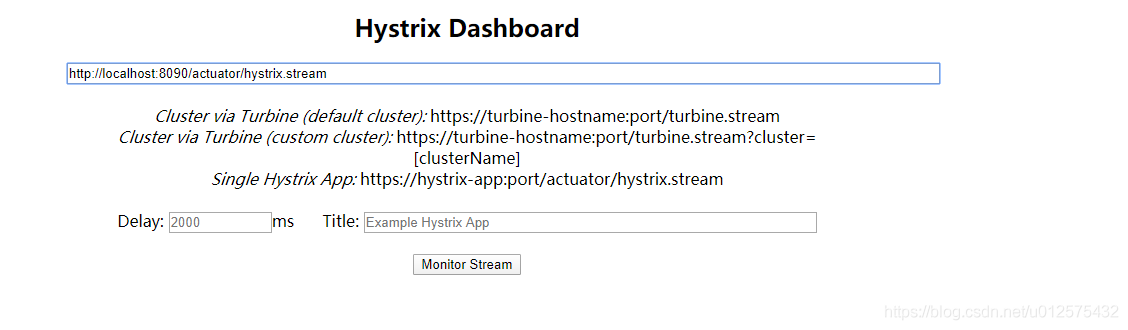
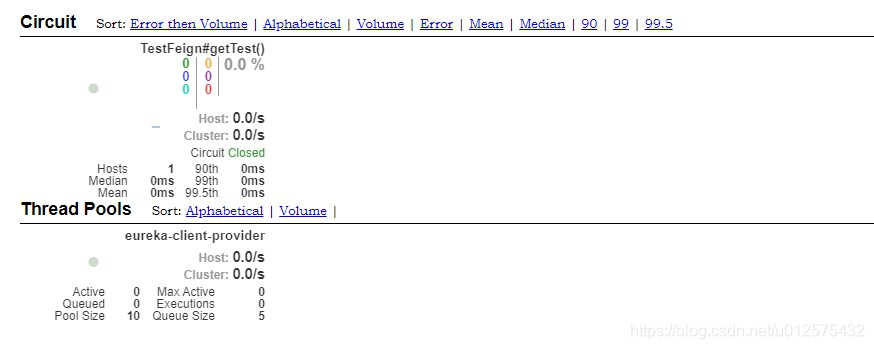
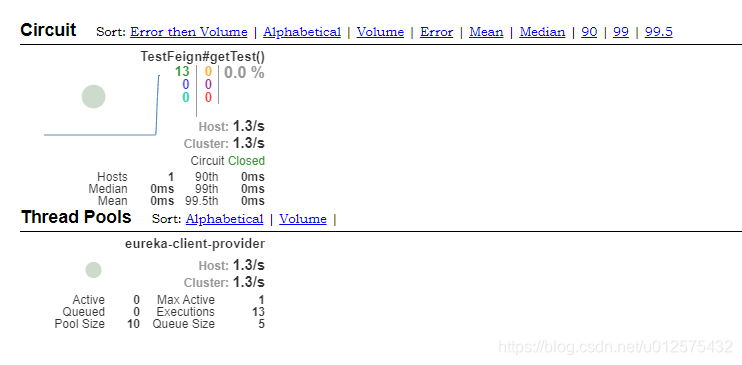
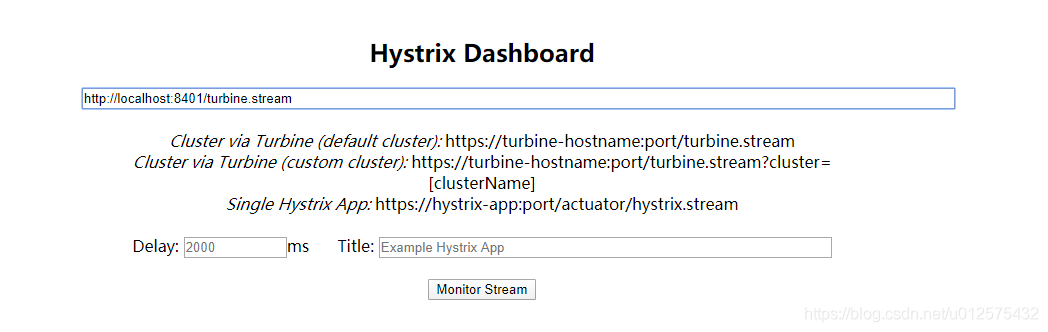
启动项目,访问http://localhost:8401/hystrix,在输入框输入上一章实现的consumer暴露的hystrix监控端口地址http://localhost:8090/,然后点击Monitor Stream按钮
-
此时调用几次consumer的接口,http://localhost:8090/consumer/info,即可看见数据变化
3. Turbine实现聚合监控
-
在上面的项目中添加
spring-cloud-starter-netflix-turbine依赖,实现聚合监控<dependency> <groupId>org.springframework.cloud</groupId> <artifactId>spring-cloud-starter-netflix-hystrix-dashboard</artifactId> </dependency> <dependency> <groupId>org.springframework.cloud</groupId> <artifactId>spring-cloud-starter-netflix-eureka-client</artifactId> </dependency> <!-- 新加依赖 --> <dependency> <groupId>org.springframework.cloud</groupId> <artifactId>spring-cloud-starter-netflix-turbine</artifactId> </dependency> -
在启动类添加
@EnableTurbine注解@EnableTurbine @EnableDiscoveryClient @SpringBootApplication @EnableHystrixDashboard public class SclHystrixDashboardApplication { public static void main(String[] args) { SpringApplication.run(SclHystrixDashboardApplication.class, args); } } -
修改配置文件application.yml,添加turbine相关配置
server: port: 8401 spring: application: name: scl-hystrix-dashboard # 服务名称 eureka: client: register-with-eureka: true # 是否注册到服务注册中心 fetch-registry: true # 需要从注册中心获取各个服务的hystrix信息,需设置为true service-url: defaultZone: http://root:123456@test1:8100/eureka-server1/eureka,http://root:123456@test2:8200/eureka-server2/eureka,http://root:123456@test3:8300/eureka-server3/eureka # 服务注册中心地址 turbine: app-config: eureka-client-consumer # 需要聚合的服务名称,多个服务使用逗号(,)分隔 cluster-name-expression: "'default'" -
将上一章实现的服务消费者,修改一个端口再次启动,这样就存在两个消费者
-
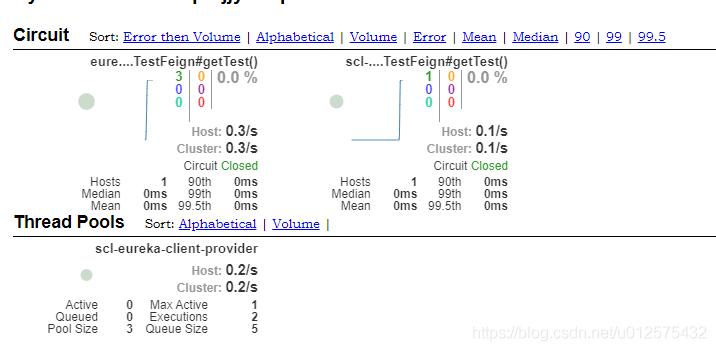
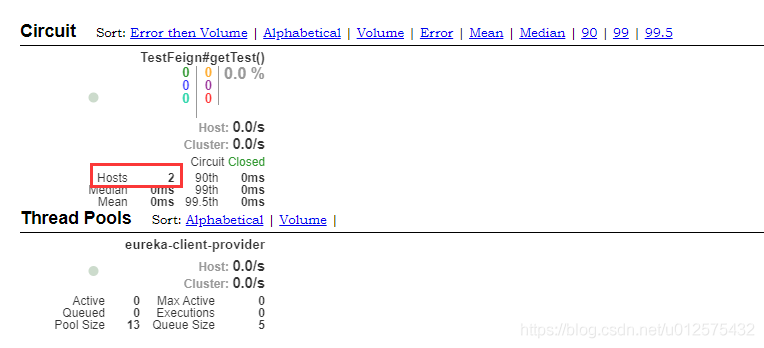
完成Turbine配置后重新启动项目,访问http://localhost:8401/hystrix,在输入框输入Turbine的监控端口地址http://localhost:8401/turbine.stream,然后点击Monitor Stream按钮。进入后可发现Hosts已变成2
-
在两个消费者里都调用几次接口,http://localhost:8090/consumer/info,http://localhost:8091/consumer/info,即可看见数据变化
4. Turbine利用RabbitMQ实现聚合监控
Turbine利用RabbitMQ实现聚合监控,需要将各个服务作为生产者,生成Hystrix数据到RabbitMQ中;Turbine作为消费者,从RabbitMQ中消费Hystrix数据,然后利用Hystrix Dashboard聚合显示。因此改造涉及服务消费者与Turbine监控端
4.1 RabbitMQ搭建
https://blog.csdn.net/u012575432/article/details/107001029
4.2 服务消费者
-
添加以下依赖
<dependency> <groupId>org.springframework.cloud</groupId> <artifactId>spring-cloud-netflix-hystrix-stream</artifactId> </dependency> <dependency> <groupId>org.springframework.cloud</groupId> <artifactId>spring-cloud-starter-stream-rabbit</artifactId> </dependency> -
修改配置文件application.yml,添加RabbitMQ相关配置
spring: rabbitmq: host: 127.0.0.1 port: 5672 username: guest password: guest -
重启项目
4.3 Turbine监控
-
删除依赖
spring-cloud-starter-netflix-hystrix-dashboard,同时添加spring-cloud-starter-netflix-turbine-stream、spring-cloud-starter-stream-rabbit两个依赖,最终依赖如下<dependency> <groupId>org.springframework.cloud</groupId> <artifactId>spring-cloud-starter-netflix-hystrix-dashboard</artifactId> </dependency> <dependency> <groupId>org.springframework.cloud</groupId> <artifactId>spring-cloud-starter-netflix-eureka-client</artifactId> </dependency> <dependency> <groupId>org.springframework.cloud</groupId> <artifactId>spring-cloud-starter-netflix-turbine-stream</artifactId> </dependency> <dependency> <groupId>org.springframework.cloud</groupId> <artifactId>spring-cloud-starter-stream-rabbit</artifactId> </dependency> -
修改配置文件application.yml,添加RabbitMQ相关配置,并删除Turbine相关配置。最终配置如下
server: port: 8401 spring: application: name: scl-hystrix-dashboard # 服务名称 rabbitmq: host: 127.0.0.1 port: 5672 username: guest password: guest eureka: client: register-with-eureka: true # 是否注册到服务注册中心 fetch-registry: true # 是否从注册中心抓取信息,若不存在服务调用设置为false即可,反之则设置为true service-url: defaultZone: http://root:123456@test1:8100/eureka-server1/eureka,http://root:123456@test2:8200/eureka-server2/eureka,http://root:123456@test3:8300/eureka-server3/eureka # 服务注册中心地址 -
启动类中删除
@EnableTurbine注解,添加@EnableTurbineStream注解@EnableTurbineStream @EnableDiscoveryClient @SpringBootApplication @EnableHystrixDashboard public class SclHystrixDashboardApplication { public static void main(String[] args) { SpringApplication.run(SclHystrixDashboardApplication.class, args); } } -
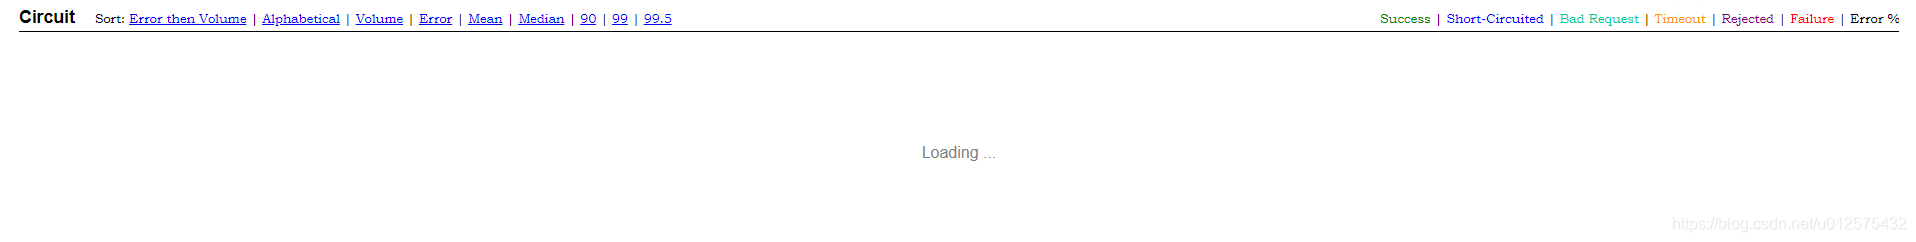
重新启动项目,访问http://localhost:8401/hystrix,在输入框输入Turbine的监控端口地址http://localhost:8401,然后点击Monitor Stream按钮。
注意:使用RabbitMQ后,Turbine监控地址变成 http://localhost:8401
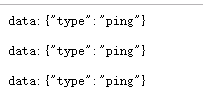
PS:若使用低版本的SpringCloud,此时可正常显示监控数据;若使用高版本的SpringCloud,则一直处于loading ...状态,并且访问 http://localhost:8401 地址,也无数据
4.4 解决Turbine无法显示监控数据的问题
使用高版本的SpringCloud无法显示监控数据是因为服务生产Hystrix数据到RabbitMQ中和Turbine从RabbitMQ消费数据使用的不是同一个交换器。
通过RabbitMQ将两个交换器进行绑定即可
- 访问RabbitMQ的Web管理界面,查看Exchanges
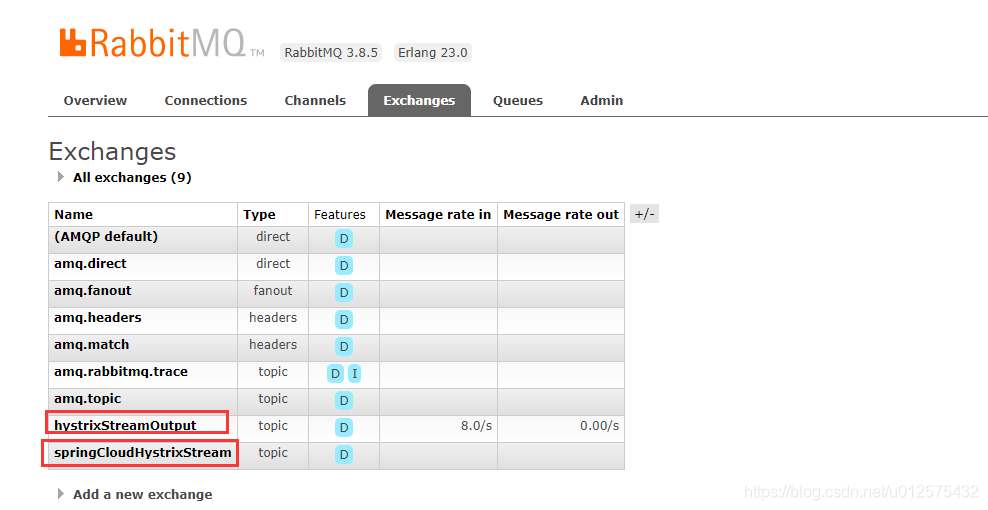
- 可以看到两个跟hystrix相关的交换器,将hystrixStreamOutput与springCloudHystrixStream进行绑定即可
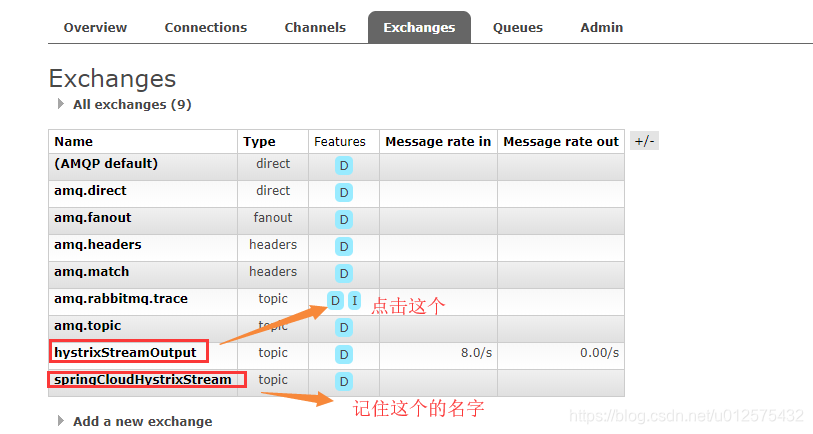
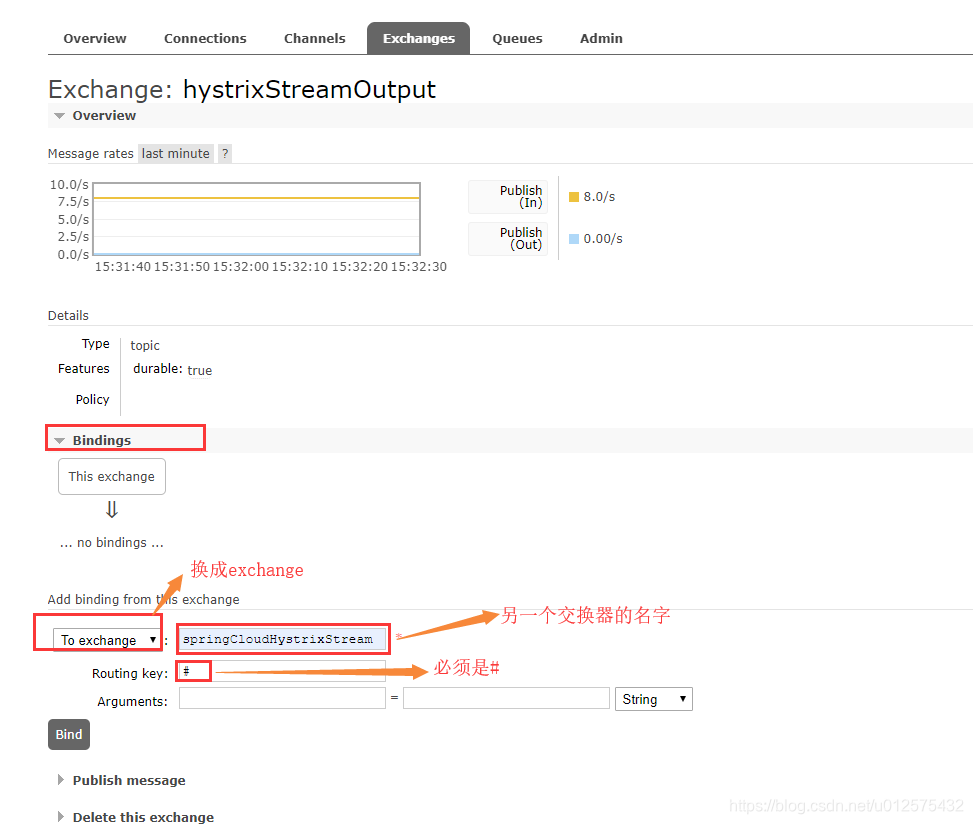
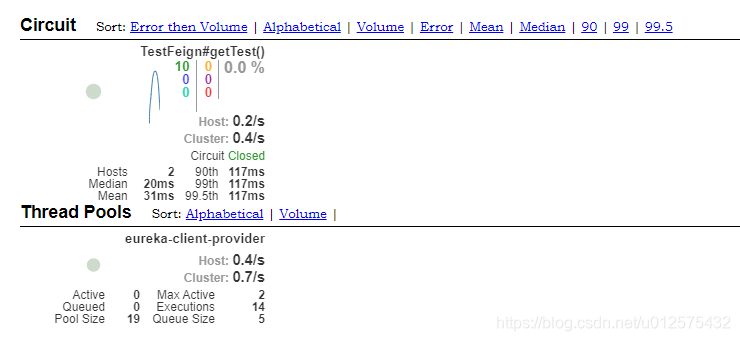
- 访问http://localhost:8401/hystrix,在输入框输入Turbine的监控端口地址http://localhost:8401,然后点击Monitor Stream按钮,即可看到监控数据