数学工具(二)插值
以一次线条插值为例:
import numpy as np
import matplotlib.pyplot as plt
import pandas as pd
from scipy.interpolate import splrep,splev
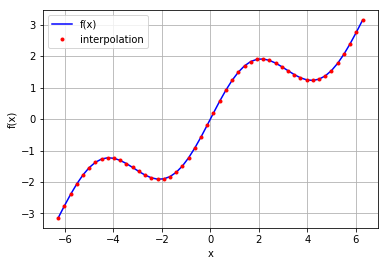
def f(x):
return np.sin(x) + 0.5 * x
x=np.linspace(-2np.pi,2np.pi,50)
ipo = splrep(x, f(x),k=1)
iy=splev(x,ipo)
plt.plot(x, f(x), 'b' , label='f(x)')
plt.plot(x, iy, 'r.' , label='interpolation')
plt.legend(loc=0)
plt.grid(True)
plt.xlabel('x')
plt.ylabel('f(x)')