Python 数据分析—画图
一、matplotlib的用法
折线图+一些常用的设置
#显示中文
import matplotlib as mpl
mpl.rcParams['font.sans-serif'] = [u'SimHei']
mpl.rcParams['axes.unicode_minus'] = False

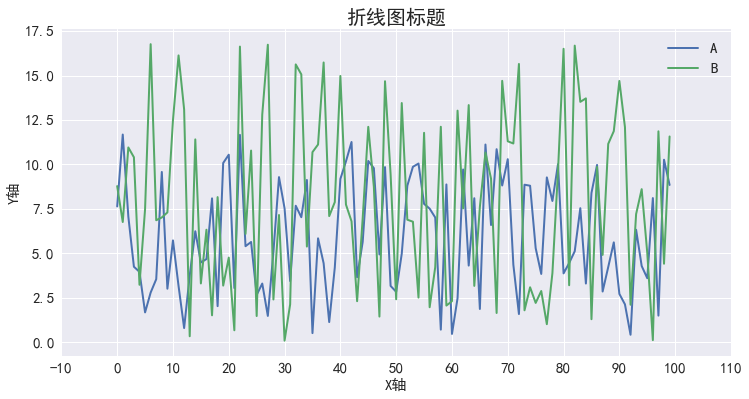
fig,ax = plt.subplots()
fig.set_size_inches(12,6)             #设置图像大小
ax.plot(data.iloc[:,1:3])             #画图
ax.set_xlabel('X轴',fontsize=15)      #x轴的名称
ax.set_ylabel('Y轴',fontsize=15)
ax.legend(['A','B'])                  #标签
ax.set_xticks(np.arange(-10,120,10))  #设置x轴的坐标
plt.yticks(fontsize=15)               #设置坐标的字体大小
plt.title('折线图标题',fontsize=20)
data = pd.DataFrame({'A':np.random.rand(100)*20,'B':np.random.rand(100)*12,'C':np.random.rand(100)*17,'D':np.random.rand(100)*10})
直方图
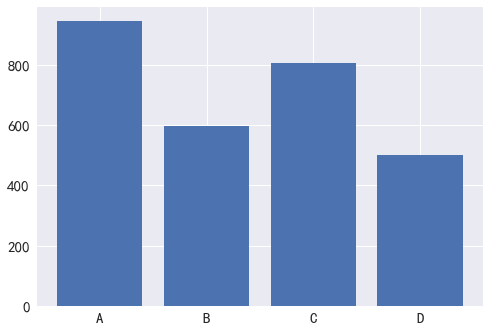
这里简直要吐血,要先设置set_xticks 在设置set_xticklabels
fig,ax = plt.subplots()
ax.bar(range(4),data.sum())
ax.set_xticks(range(4))
ax.set_xticklabels(data.columns)
多个对比
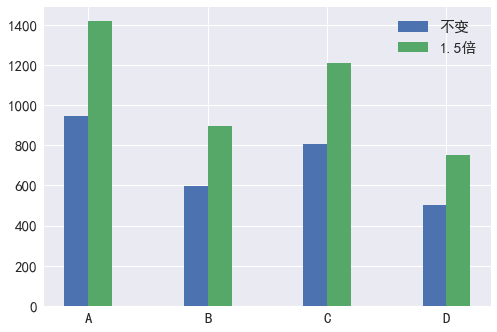
fig,ax = plt.subplots()
ax.bar(np.arange(4),data.sum(),width=0.2,label='不变')
ax.bar(np.arange(4)+0.2,data.sum()*1.5,width=0.2,label='1.5倍')
ax.set_xticks(np.arange(4)+0.1)
ax.set_xticklabels(data.columns)
plt.legend()  #这里可以加入loc
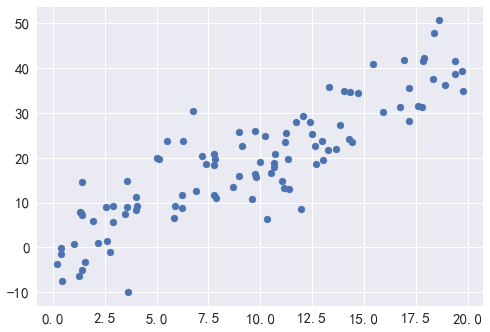
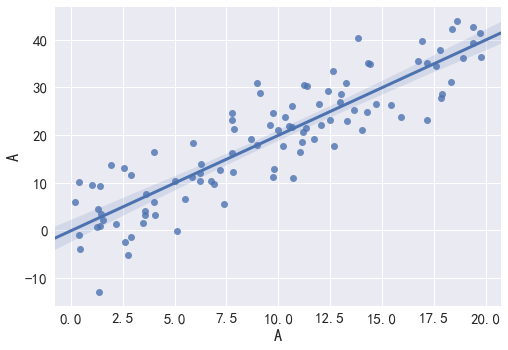
散点图,如果要加趋势线就用sns吧
fig,ax = plt.subplots()
ax.scatter(data.iloc[:,0],data.iloc[:,0]*2 + np.random.randn(100)*6)
#sns.regplot(x = data.iloc[:,0],y = data.iloc[:,0]*2 + np.random.randn(100)*6)
多个图的制作
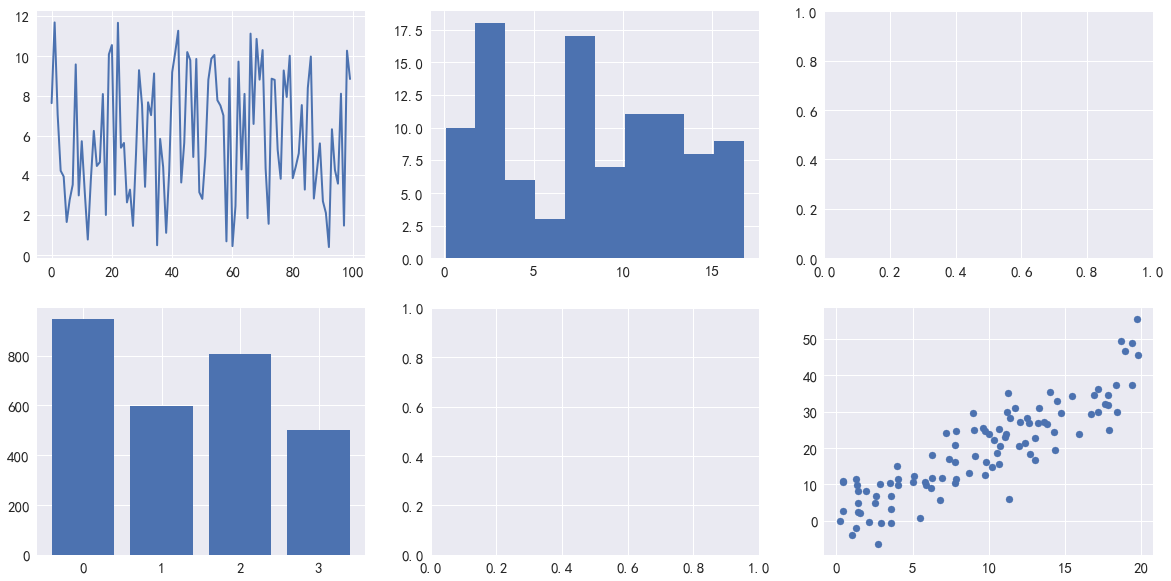
fig,ax = plt.subplots(2,3)
fig.set_size_inches(20,10)
ax[0,0].plot(data.iloc[:,1])
ax[0,1].hist(data.iloc[:,2])
ax[1,0].bar(np.arange(4),data.sum())
ax[1,2].scatter(data.iloc[:,0],data.iloc[:,0]*2 + np.random.randn(100)*6)
二、seaborn用法
http://www.cnblogs.com/douzujun/p/8366283.html
1、seaborn整体的风格设置
这部分主要了解sns的全局设置,包括set_style几种风格,set_content()有好几个默认的模式,paper,talk,poster,notebook颜色逐步加深,在此基础上可以对字体等进行修改
import pandas as pd
import numpy as np
import matplotlib.pyplot as plt
%matplotlib inline
import seaborn as sns

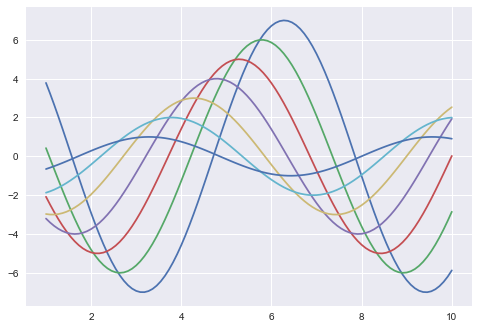
def cosplot():
    x = np.linspace(1,10,100)
    for i in range(7):
        plt.plot(x, np.cos(x + i * .5) * (7 - i))

#使用sns设置之后的图形
cosplot()
sns.set_style('whitegrid')  #sns可选择的类型有,darkgrid,dark,whitegrid,white,ticks
cosplot()

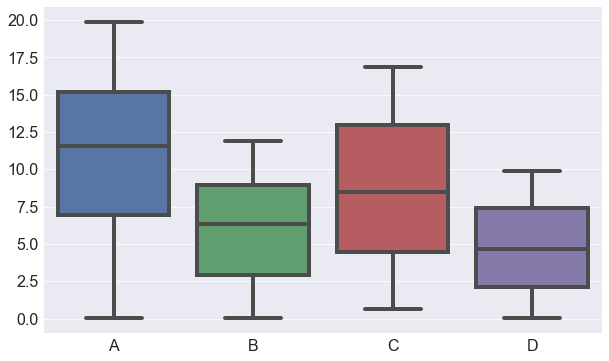
#箱型图,对于pandas数据类型,直接调用boxplot就可生成,每一列是一个箱子
sns.set_style('darkgrid')
data = pd.DataFrame({'A':np.random.rand(100)*20,'B':np.random.rand(100)*12,'C':np.random.rand(100)*17,'D':np.random.rand(100)*10})
sns.set_context('paper',font_scale=2,rc = {'lines.linewidth':4})  #分别设置坐标轴的字体大小和线的粗细
plt.figure(figsize=(10,6))    #设置图像大小
sns.boxplot(data,palette="deep")
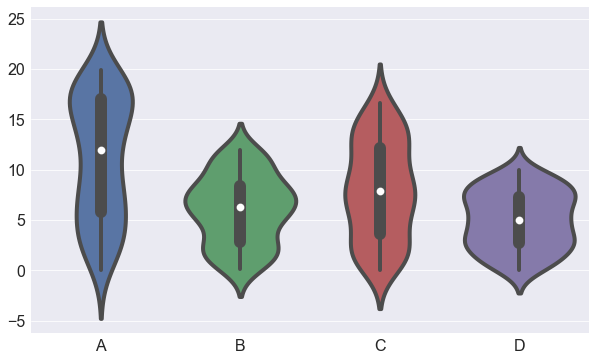
#sns.violinplot(data,palette="deep")   #这个是小提琴图
2、颜色设置
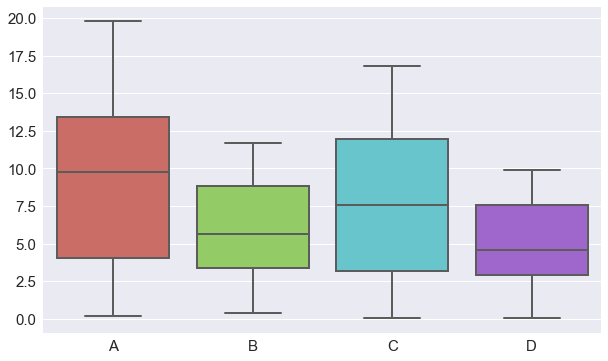
#对于箱型图
plt.figure(figsize=(10,6))
sns.set_context('notebook',font_scale=1.5,rc = {'lines.linewidth':2})
sns.boxplot(data,palette=sns.color_palette('hls',4))  #这里可以设置颜色
3、画图实践(主要是一些特殊的图形,一般图形直接使用matplotlib)
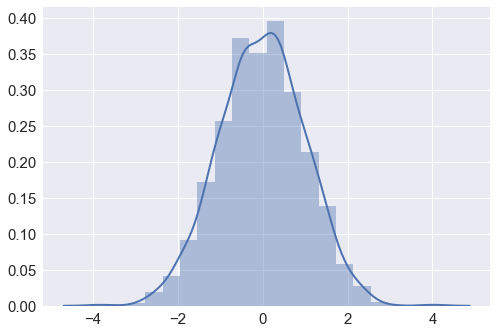
#单变量——直方图
x = np.random.normal(size=2000)
sns.distplot(x,kde = True,bins=20)  #kde是否显示曲线,bins设置格子大小
# 两个变量求相关
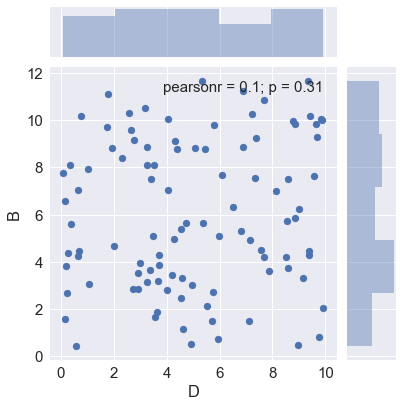
sns.jointplot(x = 'D',y='B',data=data)
#数据量很大时候使用hex图
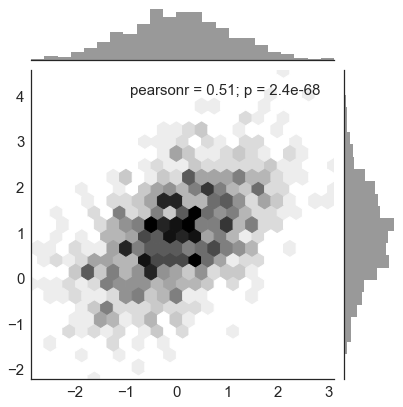
mean, cov = [0, 1], [(1, .5), (.5, 1)]
x, y = np.random.multivariate_normal(mean, cov, 1000).T
# hex图,
with sns.axes_style("white"):
    sns.jointplot(x=x, y=y, kind="hex", color="k")
#多变量时候使用两两比较
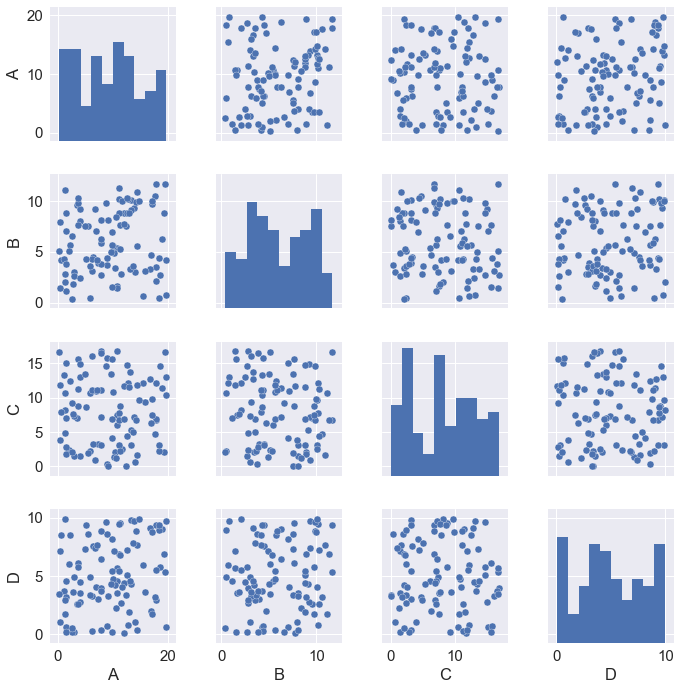
sns.pairplot(data)
