基本用法
import numpy as np
import matplotlib.pyplot as plt

# 年份
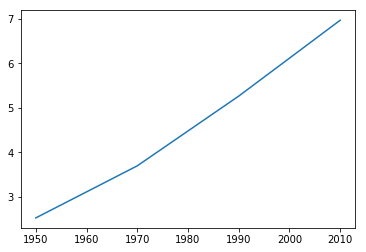
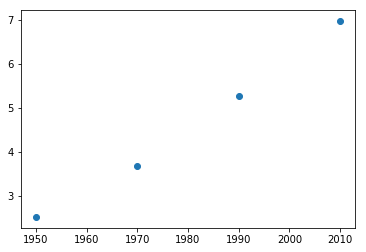
year = [1950,1970,1990,2010]
# 全球总人口(单位:10亿)
pop = [2.519,3.692,5.263,6.972]

# 画折线图
plt.plot(year,pop)  # year:x轴,pop:y轴
# 显示出折线图
plt.show()

# 画散点图
plt.scatter(year,pop)
plt.show()

画直方图
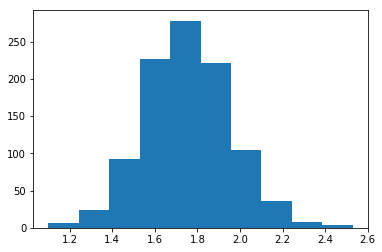
# 数据样本为1000个身高的正态模拟数据
values = np.round(np.random.normal(1.75,0.20,1000),2)
# bins表示直方图划分的区间数
plt.hist(values,bins = 10)
plt.show()

图表个性化
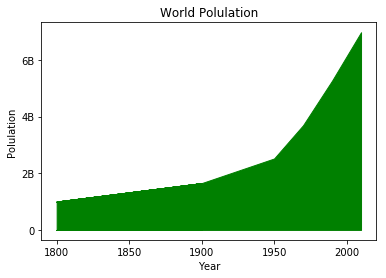
pop = [1.0,1.262,1.650] + pop
year = [1800,1850,1900] + year

# 设置图表标题
plt.title('World Polulation')
# x,y轴名称
plt.xlabel('Year')
plt.ylabel('Polulation')

# y轴刻度,第二个参数为显示的刻度
plt.yticks([0,2,4,6,8,10],['0','2B','4B','6B','8B','10B'])

# 填充曲线下方区域
plt.fill_between(year,pop,0,color = 'green')

plt.show()

解决绘图时中文显示为方块的问题
import matplotlib.pyplot as plt
plt.rcParams['font.sans-serif'] = ['SimHei']  # 指定默认字体
plt.rcParams['axes.unicode-minus'] = False  # 解决负号显示为方块的问题


