

05.样式的使用.html
<!DOCTYPE html>
<html lang="en">

<head>
  <meta charset="UTF-8">
  <meta name="viewport" content="width=device-width, initial-scale=1.0">
  <meta http-equiv="X-UA-Compatible" content="ie=edge">
  <title>Document</title>
  <script src="lib/echarts.min.js"></script>
</head>


<body>
  <div style="width: 600px;height:400px"></div>
  <script>
    var mCharts = echarts.init(document.querySelector("div"))

    var option = {
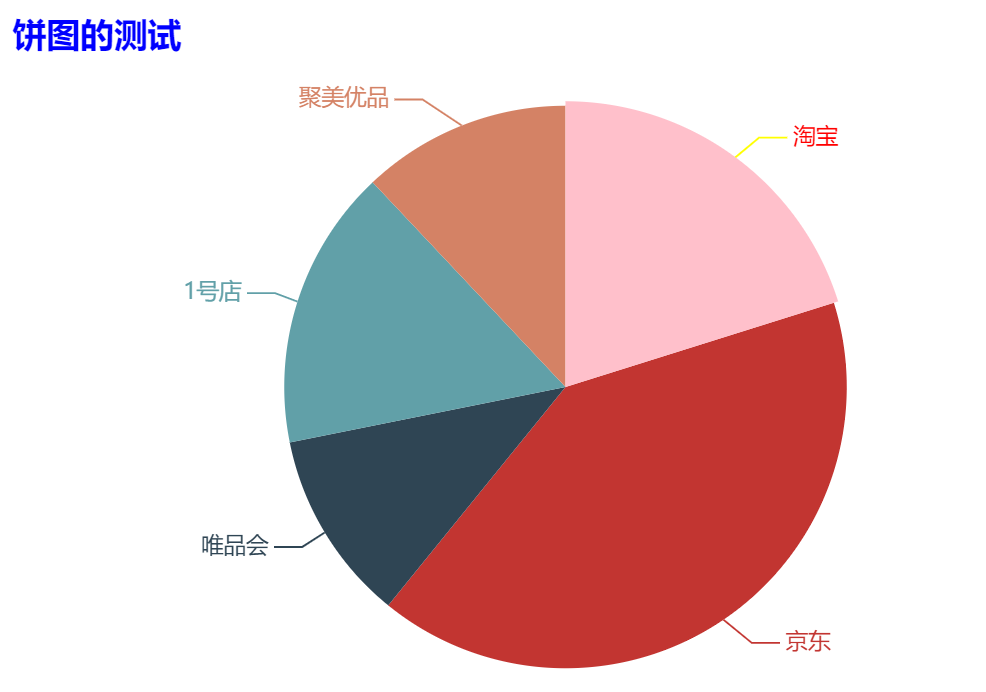
      title: {
        text: '饼图的测试',
        textStyle: { // 控制标题的文字样式
          color: 'blue'
        }
      },
      series: [
        {
          type: 'pie',
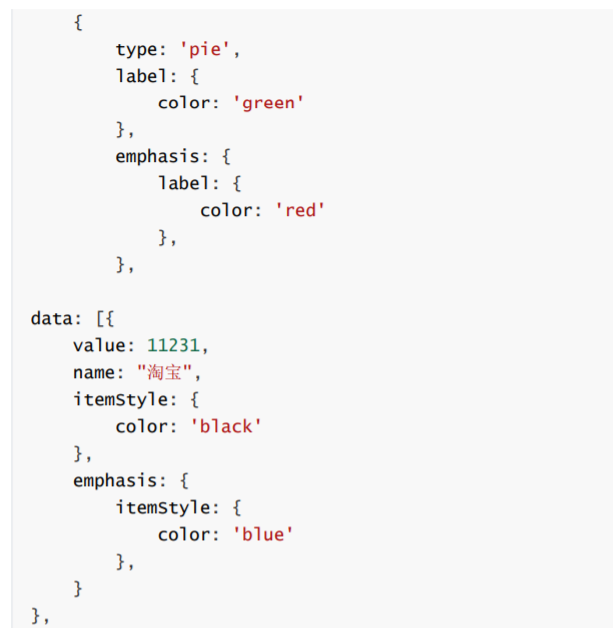
          data: [{
            value: 11231,
            name: "淘宝",
            itemStyle: { // 控制淘宝这一区域的样式
              color: 'yellow'
            },
            label: {
              color: 'green'
            },
            // 高亮
            emphasis: {
              itemStyle: { // 控制淘宝这一区域的样式
                color: 'pink'
              },
              label: {
                color: 'red'
              }
            }
          },
          {
            value: 22673,
            name: "京东"
          },
          {
            value: 6123,
            name: "唯品会",
          },
          {
            value: 8989,
            name: "1号店"
          },
          {
            value: 6700,
            name: "聚美优品"
          }]
        }
      ]
    }
    mCharts.setOption(option)
  </script>
</body>

</html>


