22.雷达图的实现.html
<!DOCTYPE html>
<html lang="en">

<head>
  <meta charset="UTF-8">
  <meta name="viewport" content="width=device-width, initial-scale=1.0">
  <meta http-equiv="X-UA-Compatible" content="ie=edge">
  <title>Document</title>
  <script src="lib/echarts.min.js"></script>
</head>

<body>
  <div style="width: 600px;height:400px"></div>
  <script>
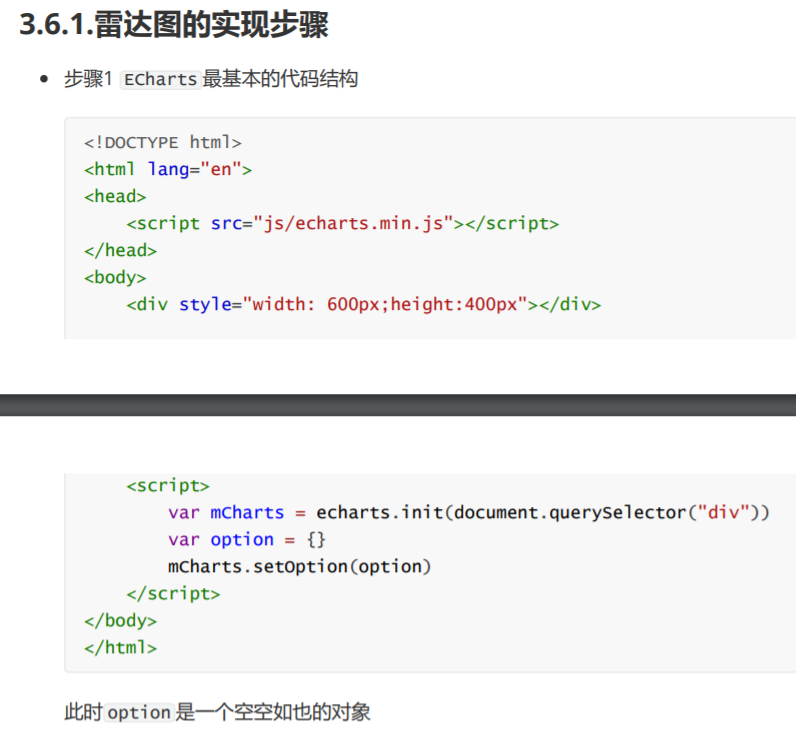
    //1. ECharts最基本的代码结构
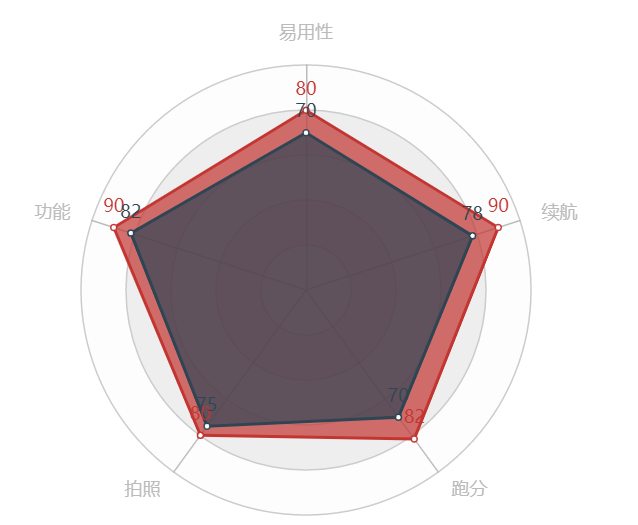
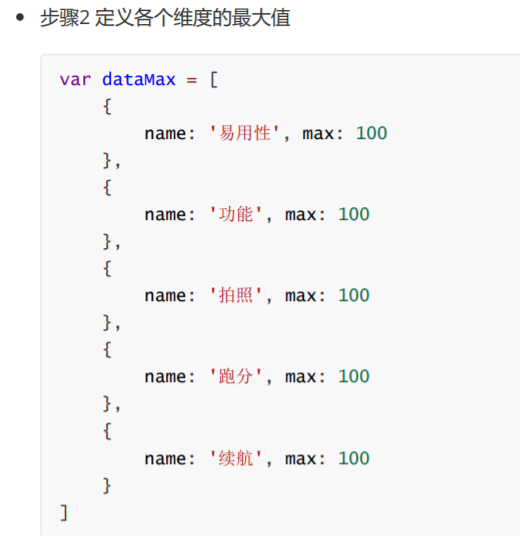
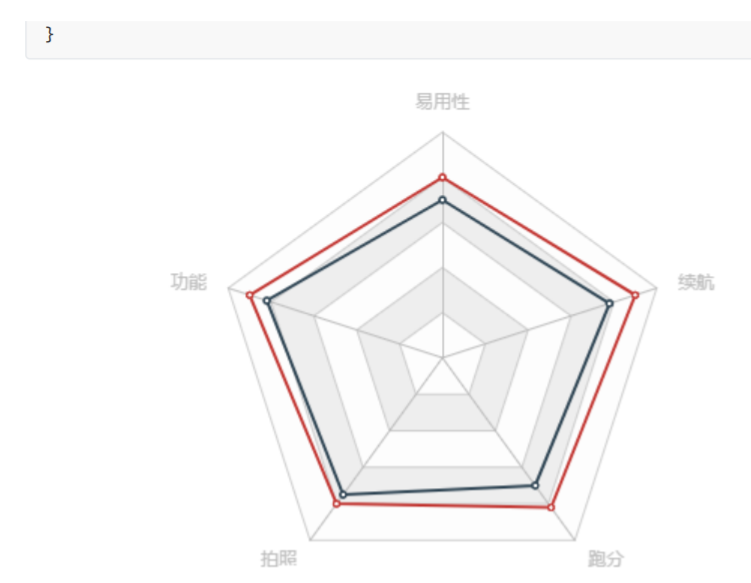
    //2. 定义各个维度的最大值, 通过radar属性配置
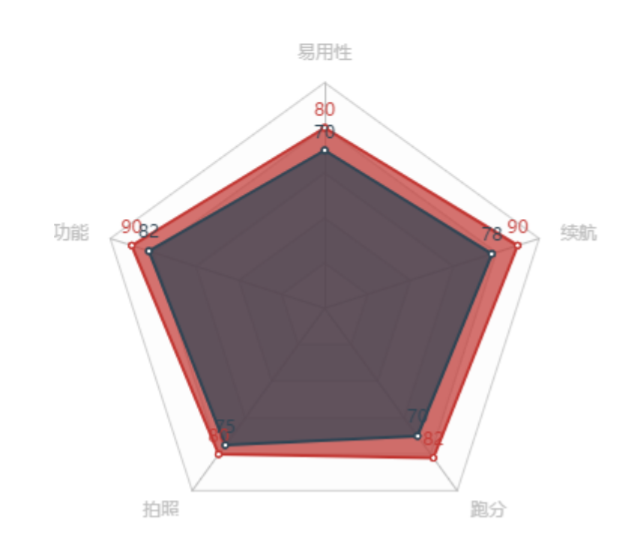
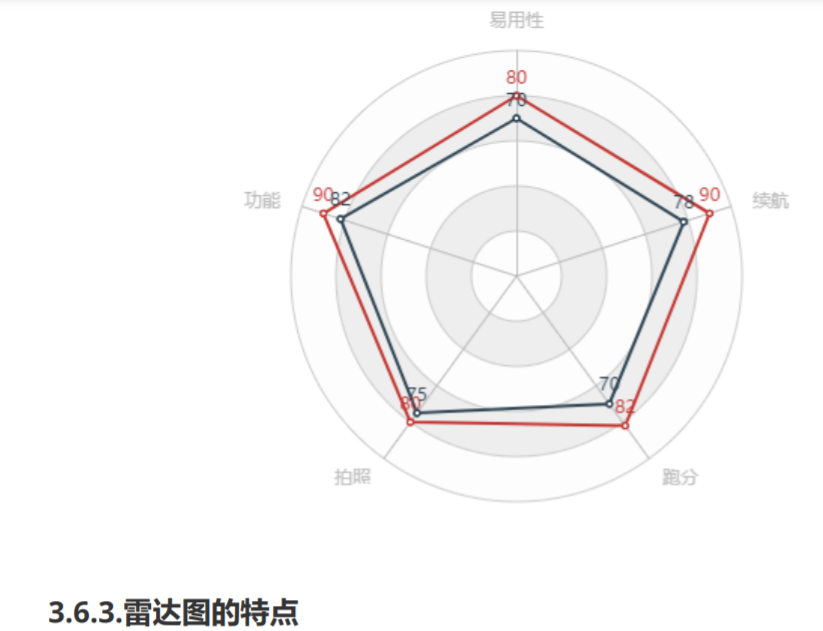
    //   易用性,功能,拍照,跑分,续航, 每个维度的最大值都是100
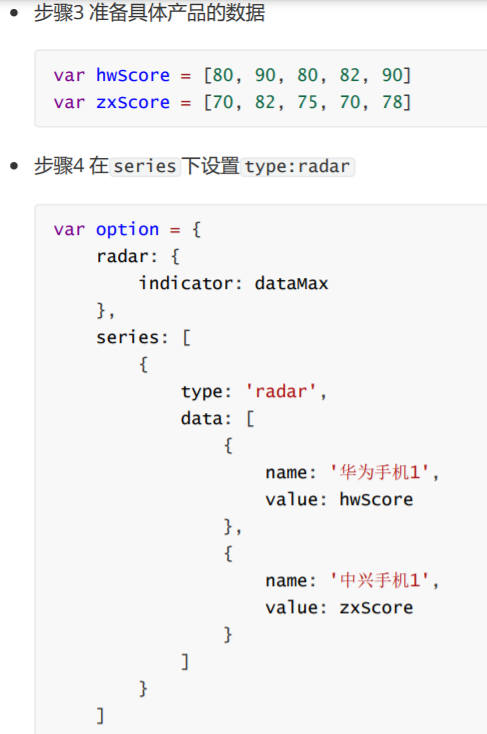
    //3. 准备产品数据, 设置给series下的data
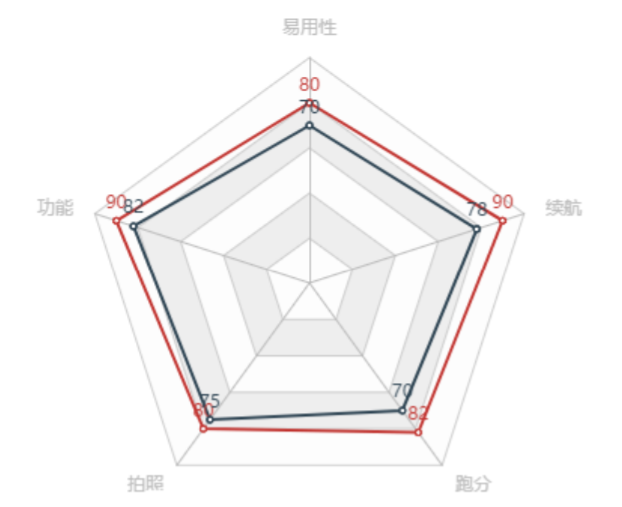
    //   华为手机1: 80, 90, 80, 82, 90
    //   中兴手机1: 70, 82, 75, 70, 78
    //4. 将type的值设置为radar
    var mCharts = echarts.init(document.querySelector("div"))
    // 各个维度的最大值
    var dataMax = [
      {
        name: '易用性',
        max: 100
      },
      {
        name: '功能',
        max: 100
      },
      {
        name: '拍照',
        max: 100
      },
      {
        name: '跑分',
        max: 100
      },
      {
        name: '续航',
        max: 100
      }
    ]

    var option = {
      radar: {
        indicator: dataMax, // 配置各个维度的最大值
        shape: 'circle' // 配置雷达图最外层的图形:circle,默认值polygon
      },
      series: [
        {
          type: 'radar', // radar 此图表时一个雷达图
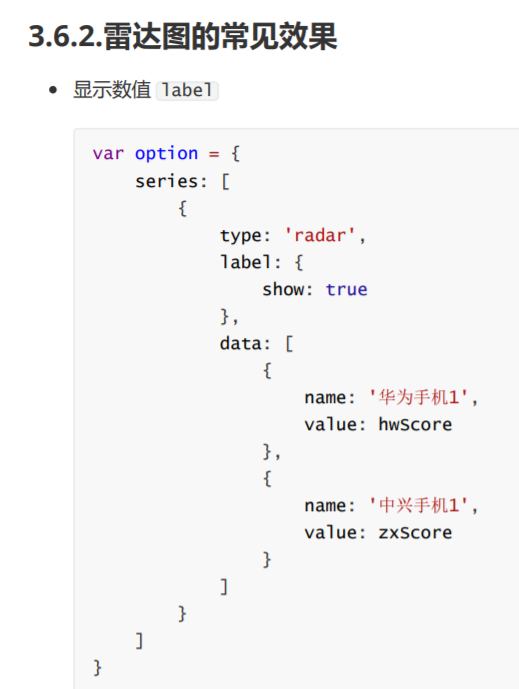
          label: { // 设置标签的样式
            show: true // 显示数值
          },
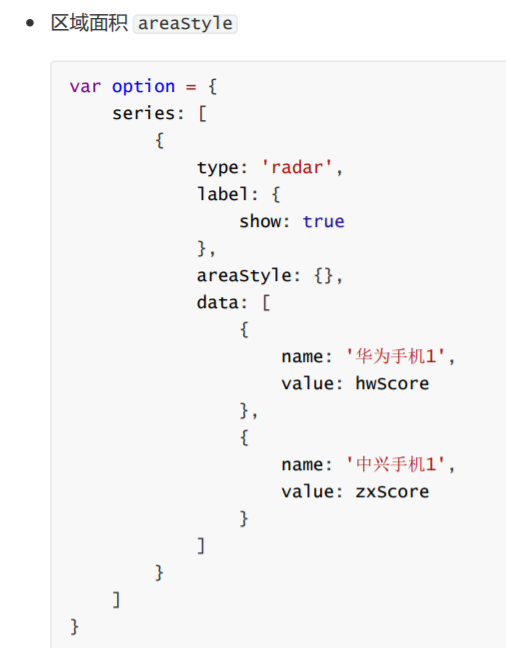
          areaStyle: {}, // 将每一个产品的雷达图形成阴影的面积
          data: [
            {
              name: '华为手机1',
              value: [80, 90, 80, 82, 90]
            },
            {
              name: '中兴手机1',
              value: [70, 82, 75, 70, 78]
            }
          ]
        }
      ]
    }
    mCharts.setOption(option)
  </script>
</body>

</html>
