581 canvas、zrender、svg入门案例
canvas
canvas 是 HTML5 的新特性,它允许我们使用 canvas 元素在网页上通过 JavaScript 绘制图像。
在canvas 上绘制的图像不是DOM元素,不能进行DOM操作,只能选中整个canvas 画布。
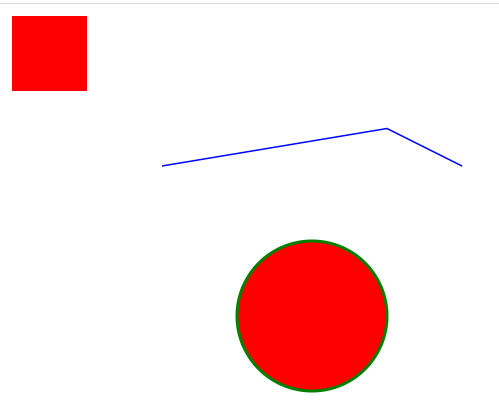
入门案例:绘制点、矩形、直线和圆形
::: details
<!DOCTYPE html>
<html>

<head>
</head>

<body>
  <canvas id="canvas" width="800" height="800"></canvas>
  <script>
    const canvas = document.getElementById('canvas'); // 获取 DOM 对象
    const ctx = canvas.getContext('2d'); // 获取 Canvas 对象
    ctx.fillStyle = 'red'; // 填充为红色
    ctx.fillRect(0, 0, 50, 50); // 绘制矩形,参数:矩形左上角的 x、y坐标,宽,高

    // 我的绘制矩形
    // context.beginPath();
    // context.lineWidth = 5;
    // context.strokeStyle = 'red';
    // context.fillStyle = 'yellowgreen';
    // context.rect(0, 0, 50, 50);
    // context.fill(); // 只有通过fill这种方式,才能绘制矩形边框,fillRect不行
    // context.stroke();

    ctx.beginPath(); // 开始绘制路径
    ctx.lineWidth = 1; // 线条宽度
    ctx.strokeStyle = 'blue'; // 线条填充色
    ctx.moveTo(100, 100); // 起点坐标
    ctx.lineTo(250, 75); // 中间点坐标
    ctx.lineTo(300, 100); // 终点坐标
    ctx.stroke(); // 绘制线段

    ctx.beginPath();
    ctx.lineWidth = 2;
    ctx.strokeStyle = 'green'; // 圆形边框色
    ctx.fillStyle = 'red'; // 圆形填充色
    ctx.arc(200, 200, 50, 0, 2 * Math.PI); // 绘制圆形
    ctx.stroke(); // 绘制圆形的边框
    ctx.fill(); // 绘制圆形的填充色

    ctx.beginPath();
    ctx.lineWidth = 1;
    ctx.strokeStyle = 'red';
    ctx.moveTo(300, 300);
    ctx.lineTo(301, 301); // 绘制一个点
    ctx.stroke();
  </script>
</body>

</html>
:::
思考:你能否总结出 canvas 绘图的流程?
::: details
- 编写 canvas 标签(注意指定宽高)
- 获取 canvas DOM 对象
- 获取 Canvas 对象
- 设置绘图属性
- 调用绘图 API
:::
::: tip
canvas 参考手册
:::
进阶案例:图片压缩
::: details
<!DOCTYPE html>
<html>
  <head>
  </head>
  <body>
    <input type="file" id="upload">
    <script>
      const ACCEPT = ['image/jpg', 'image/png', 'image/jpeg']; // 限定图片文件类型
      const MAXSIZE = 1024 * 1024 * 3; // 限定图片最大容量
      const MAXSIZE_STR = '3MB';
      function convertImageToBase64(file, cb) {
        let reader = new FileReader();
        reader.addEventListener('load', function(e) {
          const base64Image = e.target.result; // 获取文件内容,等同于 reader.result
          cb(base64Image);
          reader = null;
        });
        reader.readAsDataURL(file); // 读取 file 对象中的内容
      }
      function compress(base64Image, cb) {
        let maxW = 1024;
        let maxH = 1024;

        const image = new Image();
        image.addEventListener('load', function() {
          let ratio; // 压缩比
          let needCompress = false; // 是否需要压缩
          if (maxW < image.naturalWidth) {
            needCompress = true;
            ratio = image.naturalWidth / maxW;
            maxH = image.naturalHeight / ratio;
          }
          if (maxH < image.naturalHeight) {
            needCompress = true;
            ratio = image.naturalHeight / maxH;
            maxW = image.naturalWidth / ratio;
          }
          if (!needCompress) {
            maxW = image.naturalWidth;
            maxH = image.naturalHeight;
          }
          const canvas = document.createElement('canvas');
          canvas.setAttribute('id', '__compress__');
          canvas.width = maxW;
          canvas.height = maxH;
          canvas.style.visibility = 'hidden';
          document.body.append(canvas);

          const ctx = canvas.getContext('2d');
          ctx.clearRect(0, 0, maxW, maxH);
          ctx.drawImage(image, 0, 0, maxW, maxH); // 渲染图片
          const compressImage = canvas.toDataURL('image/jpeg', 0.9); // 压缩图片
          cb(compressImage);
          const _image = new Image();
          _image.src = compressImage;
          document.body.appendChild(_image);
          canvas.remove(); // 移除 canvas
        });
        image.src = base64Image; // 将图片设置到 image 的 src 属性中
        document.body.appendChild(image);
      }
      function uploadImage(compressImage) {
        console.log('upload image to server...', compressImage);
      }

      const upload = document.getElementById('upload');
      upload.addEventListener('change', function(e) {
        const file = e.target.files[0];
        console.log(file);
        if (!file) {
          return;
        }
        const { type: fileType, size: fileSize } = file;
        // 图片类型检查
        if (!ACCEPT.includes(fileType)) {
          alert('不支持上传该格式文件!');
          upload.value = '';
          return;
        }
        // 图片大小检查
        if (fileSize > MAXSIZE) {
          alert('文件超出' + MAXSIZE_STR + '!');
          upload.value = '';
          return;
        }
        // 压缩文件
        convertImageToBase64(file, (base64Image) => compress(base64Image, uploadImage));
      });
    </script>
  </body>
</html>
:::
svg
SVG是一种基于 XML 的图像文件格式,它的英文全称为Scalable Vector Graphics,意思为可缩放的矢量图形
入门案例:绘制点、矩形、直线和圆形
https://www.youbaobao.xyz/datav-res/examples/test-svg.html
~
::: details
<!DOCTYPE html>
<html>

<head>
</head>

<body>
  <svg width="800" height="800">
    <rect width="50" height="50" style="fill:red;stroke-width:0;stroke:rgb(0,0,0);" />
    <!-- 起点、终点坐标 -->
    <line x1="100" y1="100" x2="250" y2="75" style="stroke:blue;stroke-width:1" />
    <line x1="250" y1="75" x2="300" y2="100" style="stroke:blue;stroke-width:1" />
    <!-- 圆心、半径 -->
    <circle cx="200" cy="200" r="50" stroke="green" stroke-width="2" fill="red" />
    <line x1="300" y1="300" x2="301" y2="301" style="stroke:red;stroke-width:1" />
  </svg>
</body>

</html>
:::
思考:你能否总结出 svg 绘图的流程?
::: details
- 编写 svg 标签,指定宽高
- 编写 svg 绘图标签
- 编写绘图属性和样式
:::
::: tip
svg 参考手册
:::
zrender
zrender 是二维绘图引擎,它提供 Canvas、SVG、VML 等多种渲染方式。ZRender 也是 ECharts 的渲染器。 【zrender是 ECharts 底层的渲染器,对Canvas、SVG进行了封装。】
入门案例:绘制点、矩形、直线和圆形
https://www.youbaobao.xyz/datav-res/examples/test-zrender.html
::: details
<!DOCTYPE html>
<html>

<head>
  <script src="https://cdn.jsdelivr.net/npm/zrender@4.3.0/dist/zrender.js"></script>
</head>

<body>
  <div id="container" style="width: 800px;height: 800px;"></div>
  <script>
    var zr = zrender.init(document.getElementById('container'));
    var rect = new zrender.Rect({
      //  起点坐标,宽高
      shape: {
        x: 0,
        y: 0,
        width: 50,
        height: 50
      },
      style: {
        fill: 'red',
        lineWidth: 0
      }
    });
    var line = new zrender.Polyline({
      shape: {
        points: [
          [100, 100],
          [250, 75],
          [300, 100]
        ]
      },
      style: {
        stroke: 'blue',
        lineWidth: 1
      }
    });
    var circle = new zrender.Circle({
      shape: {
        cx: 200,
        cy: 200,
        r: 50
      },
      style: {
        fill: 'red',
        stroke: 'green',
        lineWidth: 2
      }
    });
    var point = new zrender.Polyline({
      shape: {
        points: [
          [300, 300],
          [301, 301]
        ]
      },
      style: {
        stroke: 'red',
        lineWidth: 1
      }
    });
    zr.add(rect);
    zr.add(line);
    zr.add(circle);
    zr.add(point);
  </script>
</body>

</html>
:::
思考:你能否总结出 zrender 绘图的流程?
::: details
- 引入 zrender 库
- 编写 div 容器
- 初始化 zrender 对象
- 初始化 zrender 绘图对象
- 调用 zrender add 方法绘图
:::
想深入学习 zrender 的同学可以参考官方案例,源码可以在 zrender-docs 中找到

