

matlab绘制分组boxplot图
matlab采用boxplot绘制分组箱形图时不是很方便,这里给出一种实现方法。
假设ratio1~ratio9每个矩阵的形状均为[N, L],其中,L为一组数据中有几个类别,N为每个类别的数据量。共有9组数据(ratio1~ratio9)。
MRL2 = {ratio1, ratio2, ratio3, ratio4, ratio5, ratio6, ratio7, ratio8, ratio9};

% Create example data
G1=MRL2{1};
G2=MRL2{2};
G3=MRL2{3};
G4=MRL2{4};
G5=MRL2{5};
G6=MRL2{6};
G7=MRL2{7};
G8=MRL2{8};
G9=MRL2{9};

% prepare data
data=cell(6,9);
for ii=1:size(data,1)
Gc1{ii}=G1(:,ii);
Gc2{ii}=G2(:,ii);
Gc3{ii}=G3(:,ii);
Gc4{ii}=G4(:,ii);
Gc5{ii}=G5(:,ii);
Gc6{ii}=G6(:,ii);
Gc7{ii}=G7(:,ii);
Gc8{ii}=G8(:,ii);
Gc9{ii}=G9(:,ii);
end
data=vertcat(Gc1,Gc2,Gc3,Gc4,Gc5,Gc6,Gc7,Gc8,Gc9);
figure
%set(gca, 'LooseInset', get(gca,'TightInset'))

multiple_boxplot(data')
% or
multiple_boxplot(data)
主函数如下:
function multiple_boxplot(data,xlab,Mlab,colors)
% data is a cell matrix of MxL where in each element there is a array of N
% length. M is how many data for the same group, L, how many groups.
%
% Optional:
% xlab is a cell array of strings of length L with the names of each
% group
%
% Mlab is a cell array of strings of length M
%
% colors is a Mx4 matrix with normalized RGBA colors for each M.
% check that data is ok.
if ~iscell(data)
    error('Input data is not even a cell array!');
end
% Get sizes
M=size(data,2);
L=size(data,1);
if nargin>=4
    if size(colors,2)~=M
        error('Wrong amount of colors!');
    end
end
if nargin>=2
    if length(xlab)~=L
        error('Wrong amount of X labels given');
    end
end
% Calculate the positions of the boxes
positions=1:0.25:M*L*0.25+1+0.25*L;
positions(1:M+1:end)=[];
% Extract data and label it in the group correctly
x=[];
group=[];
for ii=1:L
    for jj=1:M
        aux=data{ii,jj};
        x=vertcat(x,aux(:));
        group=vertcat(group,ones(size(aux(:)))*jj+(ii-1)*M);
    end
end
% Plot it
boxplot(x,group, 'positions', positions);
%boxplot(x,group, 'positions', positions, 'PlotStyle','compact');


% Set the Xlabels
aux=reshape(positions,M,[]);
labelpos = sum(aux,1)./M;
set(gca,'xtick',labelpos)
if nargin>=2
    set(gca,'xticklabel',xlab);
else
    idx=1:L;
    set(gca,'xticklabel',strsplit(num2str(idx),' '));
end

% Get some colors
if nargin>=4
    cmap=colors;
else
    cmap = hsv(M); % jet, hsv
    %cmap=vertcat(cmap,ones(L,1)*0.5);
    cmap=[cmap,ones(M,1)*0.5];
end
color=repmat(cmap, L, 1);
% Apply colors
h = findobj(gca,'Tag','Box');
for jj=1:length(h)
   patch(get(h(jj),'XData'),get(h(jj),'YData'),color(jj,1:3),'FaceAlpha',color(jj,4));
end
if nargin>=3
    legend(fliplr(Mlab));
end

end
效果:
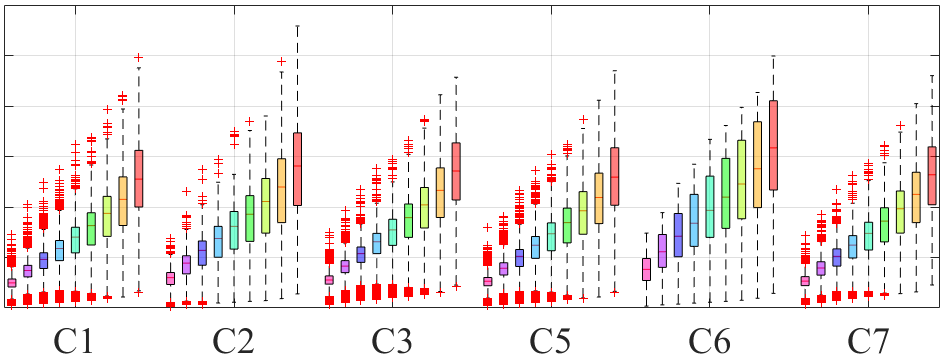
或输入data的转置(改变分组方式)

快去成为你想要的样子!


